 Open Access Article
Constructing NiSe2@MoS2 nano-heterostructures on a carbon fiber paper for electrocatalytic oxygen evolution
Yazhou Huang *,
Jiacai Huang,
Kunshan Xu and
Ranran Geng
Industrial Center, Nanjing Institute of Technology, Nanjing 211167, People's Republic of China. E-mail: huangyazhou@njit.edu.cn
First published on 6th August 2021
Abstract
Although MoS2 has shown its potential as an electro-catalyst for the oxygen evolution reaction (OER), its research is still insufficient. In this study, as a novel MoS2-based heterostructure electro-catalyst for OER, namely NiSe2@MoS2 nano-heterostructure, was constructed on a carbon fiber paper (CFP) substrate by a simple approach, which includes electrochemical deposition of NiSe2 film and hydrothermal processing of MoS2 film. In addition to a series of observations on the material structure, electrocatalytic OER performance of NiSe2@MoS2 was fully evaluated and further compared with other MoS2-based OER electro-catalysts. It exhibits an outstanding catalytic performance with an overpotential η10 of 267 mV and a Tafel slope of 85 mV dec−1. Only 6% loss of current density before and after 10 h indicates its excellent durability. The results indicate that the obtained NiSe2@MoS2 is an excellent OER electro-catalyst and worth exploring as a substitute for noble metal-based materials.
1. Introduction
In order to solve the contradiction between environmental protection and energy demand, exploring clean energy such as hydrogen and oxygen has attracted wide attention.1 Among different methods, splitting water into hydrogen and oxygen by the electrochemical method possesses advantages of high efficiency and abundant water resources, and is considered to be one of the most promising methods.2–7 However, the application of this method is limited because the high overpotential in the oxygen evolution reaction (OER) process will lead to a significant loss of energy.8 Although noble metal oxides such as IrO2 and RuO2 are considered to be efficient catalysts for the reduction of the OER overpotential, they cannot be used on a large scale owing to their scarcity and high-cost.9,10 Therefore, it is of great importance to find other OER catalysts with low cost and abundant reserves, and a lot of efforts have been made in this regard.11–18Recently, as a layered material, MoS2 has been regarded as an efficient electro-catalyst for the hydrogen evolution reaction (HER) and exhibited an excellent performance.19,20 However, research on its OER catalytic performance is still not sufficient. The theoretical calculation shows that the OER active sites of MoS2 are at the edge with sulfur vacancies, which are similar to HER.21 According to the reports, there are two main methods to improve the OER catalytic activity of MoS2. The first method is to increase the exposure of the active sites by reducing the grain size and increasing the substrate gap.22 However, the improvement is limited owing to the intrinsic structure of MoS2.23 The second method is to improve the electronic structure of MoS2, for example, hybridizing MoS2 with other materials to facilitate the chemical adsorption of oxygen-containing intermediates, so as to reduce the kinetics of OER.24 Recently, Co/Ni-sulfide@MoS2 heterostructures such as Co9S8@MoS2,25 CoS2–C@MoS2,26 and MoS2/Ni3S2 (ref. 27) have demonstrated excellent OER activities. Compared with sulfide, the electronegativity of selenide is lower, which might weaken the chemical bond between the Se atom and the bonding electrons, and thus exhibits greater activity.28–31 For example, in the OER process, the Tafel slope of NiSe2 is 97 mV dec−1, which is lower than that of Ni3S2 (118 mV dec−1).27,32 Therefore, it is worthwhile to construct the nanoscale Ni–selenide@MoS2 heterostructure on a substrate with abundant gaps and high conductivity as a catalyst for OER.
In this study, a novel MoS2-based nano-heterostructure electro-catalyst, NiSe2@MoS2, was constructed on a carbon fiber paper (CFP) substrate for OER by a simple method, which includes the electrochemical deposition and hydrothermal processes. Various techniques were then employed to observe the material structure. Moreover, the electrocatalytic OER performances were fully evaluated by electrochemical measurements and further compared with other MoS2-based OER electro-catalysts.
2. Experimental
2.1. Construction of the NiSe2@MoS2 nano-heterostructure on CFP
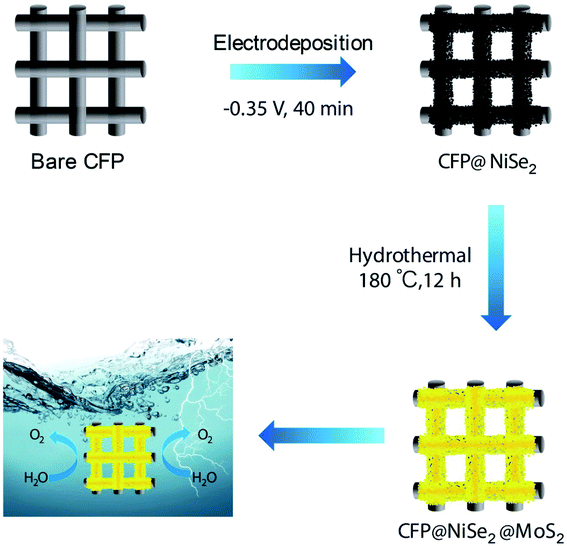
As shown in Fig. 1, the construction process of the NiSe2@MoS2 nano-heterostructure includes two steps: electrochemical deposition of the NiSe2 film and hydrothermal synthesis of the MoS2 film.First, the NiSe2 film was electrodeposited on a carbon fiber paper (CFP, 1 × 1 cm2, TGP-H-60, Toray) by a three-electrode electrochemical cell (CHI660E, CH Instruments). The CFP substrate, a saturated calomel electrode (SCE), and a graphite rod were employed as the working, reference, and counter electrodes, respectively. The electrolyte composed of 100 mL deionized water, 4.45 g NiCl2·6H2O, 1.44 g SeO2, and 1.02 g LiCl. The potential was kept at −0.35 V (vs. SCE) for 40 min. Then, the deposited NiSe2 film (CFP@NiSe2) was washed using deionized water and dried in a vacuum drying oven at 60 °C.
Second, the MoS2 film was coated on CFP@NiSe2 by the hydrothermal synthesis. In this process, the amount of precursor and technological conditions are very strict. The precursor solution, including 0.06 g (NH4)6Mo7O24·4H2O, 0.15 g SC(NH2)2, and 30 mL deionized water, was magnetically stirred for 5 min and allowed to stand at 60 °C for 1 h. Then, it was transferred into a 50 mL airtight reactor and was allowed to stand at 180 °C for 12 h to afford CFP@NiSe2@MoS2. It was washed with deionized water and dried in a vacuum drying oven at 60 °C. Detailed procedures refer to ref. 33.
2.2. Characterization
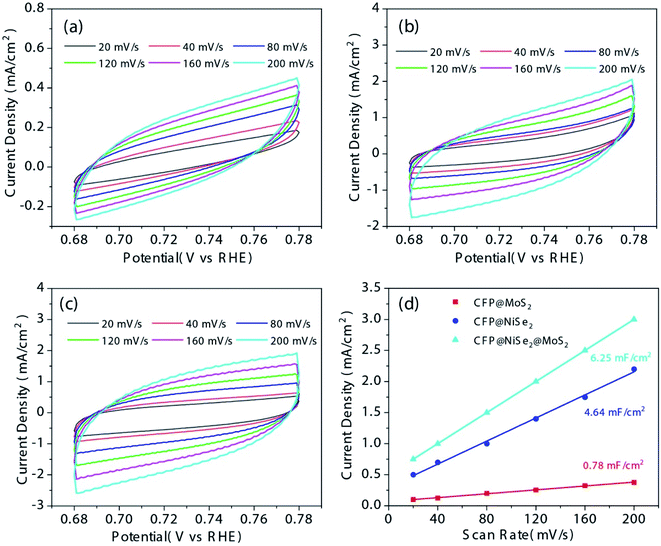
First, the material structure of the obtained samples was observed by various means. The morphology observation was carried out via scanning electron microscopy (SEM, S-4800, Hitachi), high-resolution transmission electron microscopy (HRTEM, TECNAI G2F20, FEI), and X-ray diffraction (XRD, X'Pert3, Panalytical). Before TEM characterization, the samples were ground into powder and transferred to a copper grid. XRD was carried out with Cu Kα radiation (λ = 1.54 Å) at 40 mA and 45 kV. The chemical elements of samples were observed via energy dispersive spectroscopy (EDS, S-4800, Hitachi) and X-ray photoelectron spectroscopy (XPS, EscaLab-250Xi, Thermofisher). XPS source is Al Kα (hυ = 1486.6 eV) with a power of 22.8 W.Second, the electrocatalytic OER performances of the obtained samples were observed through a three-electrode electrochemical cell that employs Hg/HgO and graphite rod as reference and counter electrodes, respectively, in a 1 M KOH electrolyte solution. Before the measurement, high-purity oxygen was injected into the electrolyte for 20 min to eliminate the interference of oxygen. Then, the oxygen bubbles formed on the electrode surface were dislodged by magnetic stirring during the process of measurement. The potential ERHE was obtained by the equation of ERHE = EHg/HgO + 0.059pH + 0.098. OER polarization curves were obtained by linear sweep voltammetry (LSV) at a scan rate of 10 mV s−1 from 0.5 to 2 V (vs. RHE). The result was corrected by the equation of ηcorr = ηexp − iR to eliminate the effect of series resistance. Electrochemical impedance spectra (EIS) were obtained at 1.51 V (vs. RHE) in a frequency range of 105–0.1 Hz with an amplitude of 5 mV. The double-layer capacitance (Cdl), obtained by cyclic voltammetry (CV) tests at different scan rates from 20 to 200 mV s−1 in a range of 0.68–0.78 V (vs. RHE), was used to evaluate the electrochemically active surface area (ECSA).
3. Results and discussion
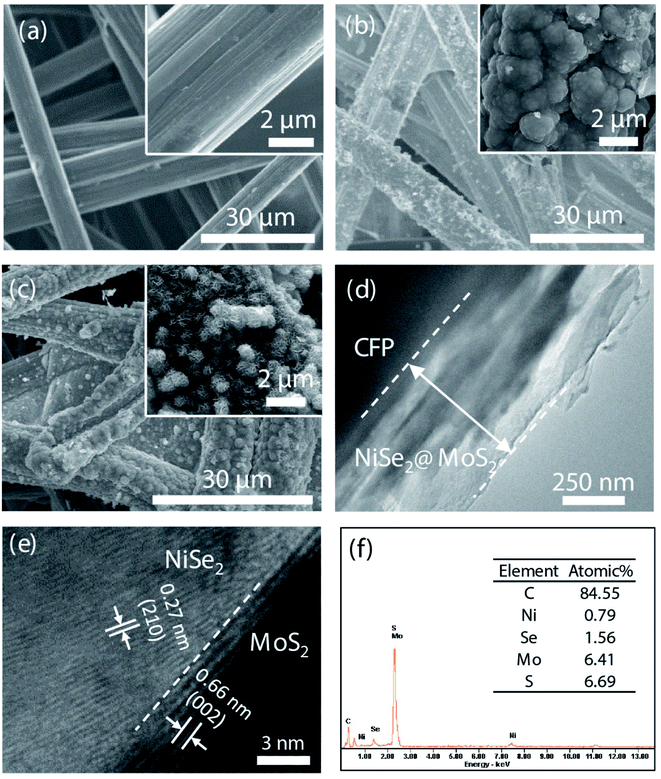
NiSe2 and MoS2 films were coated on a CFP substrate, respectively. According to Fig. 2(a–c), rich voids between carbon fibers in the CFP substrate can enlarge the contact of the catalyst to the electrolyte, which are beneficial to improving the OER activity. According to the enlarged view in the inset, due to the poor crystallinity induced by the low temperature in the constructing process, both NiSe2 and MoS2 nanosheets are disorderly distributed in the film. Owing to the disorderly distribution, abundant edges of NiSe2 and MoS2 nanosheets can further improve the contact area and activity. Moreover, the close contact between NiSe2 and CFP obtained by the electrochemical deposition can reduce the charge transfer impedance in the OER process. As shown in Fig. 2(d), the thickness of the NiSe2@MoS2 film is ∼550 nm. According to further HRTEM observation (Fig. 2(e)), the NiSe2@MoS2 heterostructure is composed of 0.27 nm MoS2 (002) face and 0.66 nm NiSe2 (210) face. EDS spectra were further recorded to observe the element composition of the heterostructure (Fig. 2(f)). The ratio of Se/Ni is close to 2 while that of S/Mo is close to 1, indicating that the obtained NiSe2@MoS2 is sulfur deficient.As shown in Fig. 3, the samples were further observed by Raman spectroscopy. In the spectrum of CFP@NiSe2@MoS2, peaks Ag and Tg of NiSe2 are shown at ∼208 and ∼235 cm−1, respectively, while E12g and A1g of MoS2 are shown at ∼379 and ∼405 cm−1, respectively, indicating that NiSe2@MoS2 is indeed deposited on CFP.34,35 The interfering peak at ∼290 cm−1, originating from internal strain of MoS2, is caused by the disorder of the grains and defects.36 The S–Se peak at ∼360 cm−1, originating from S–Se pairs, further confirms that the NiSe2@MoS2 heterostructure is formed.37 Compared with CFP@MoS2, peaks E12g and A1g of MoS2 in CFP@NiSe2@MoS2 exhibit an obvious blue shift, because the crystal symmetry is destroyed by the defects. The defects are from the NiSe2 substrate and NiSe2@MoS2 heterostructures, which can improve the exposure of active sites and OER activity of MoS2.38–40 Moreover, peaks Ag and Tg cannot be observed independently in CFP@NiSe2, indicating that the crystallinity of NiSe2 prepared by the electrochemical deposition is relatively low. Then, the crystallinity is improved by the subsequent hydrothermal process of MoS2, which helps to reduce the charge transfer impedance in the process of OER.
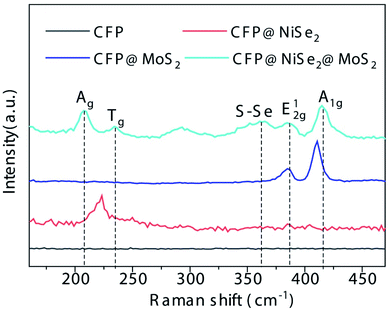 | ||
| Fig. 3 Raman results of the samples. Peaks Ag and Tg belong to NiSe2, while E12g and A1g belong to MoS2. The presence of the peak S–Se confirms that the NiSe2@MoS2 heterostructure was formed. | ||
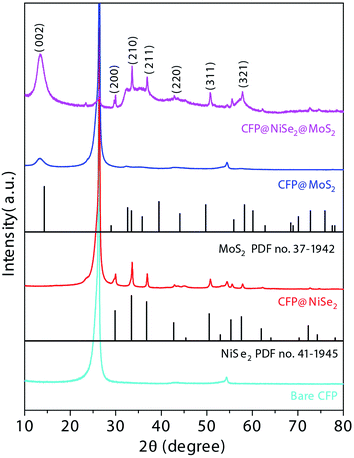
As shown in Fig. 4, structures of the samples were also observed by XRD. The standard diffraction peaks of NiSe2 and MoS2 are shown in PDF no. 41-1945 and no. 37-1942, respectively. Peaks at 26.3 and 54.2° originate from the CFP substrate. In the spectra of CFP@NiSe2, peaks corresponding to (200), (210), (211), (220), (311), and (321) planes of NiSe2 are clearly shown at around 29.4, 33.5, 36.6, 43.5, 50.7, and 57.5°, respectively.32 According to the spectra of CFP@MoS2, the (002) peak of MoS2 can be observed at 13.1°. The simultaneous appearance of peaks of NiSe2 and MoS2 in CFP@NiSe2@MoS2 further confirms that NiSe2 and MoS2 are successfully deposited on the CFP substrate. Moreover, compared with CFP @MoS2, the (002) peak has a blue shift from 13.1 to 13.5 in CFP@NiSe2@MoS2 owing to the defects from the NiSe2 substrate and NiSe2@MoS2 heterostructures. This structure is in favor of the improvement of the OER activity, which is consistent with the Raman results.
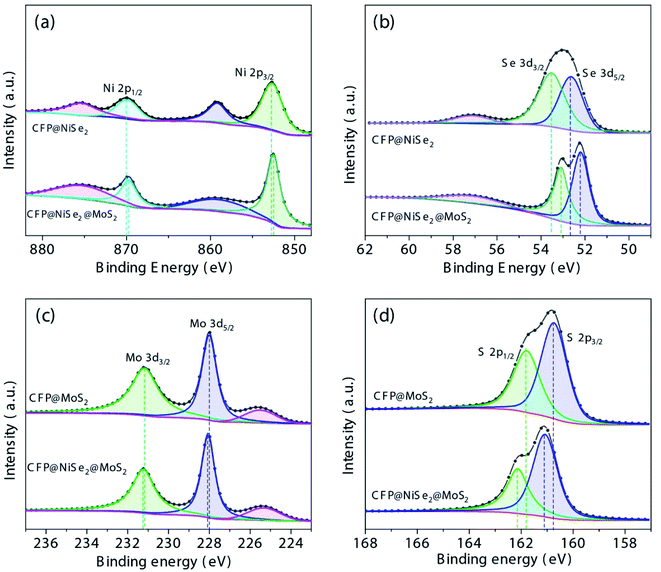
The composition of the samples was further analyzed by XPS. According to the spectra of Ni 2p and Se 3d shown in Fig. 5(a and b), peaks of Ni 2p1/2 and Ni 2p3/2 belonging to Ni4+ of NiSe2 are shown at 870.2 and 853.1 eV with their satellite peaks at 875.7 and 859.2 eV, respectively.41 Peaks of Se 3d3/2 and Se 3d5/2 at 53.5 and 52.7 eV, respectively, belong to Se22− of NiSe2, while an oxidized Se peak is shown at 57 eV.42 Moreover, as shown in Fig. 5(c and d), peaks of Mo 3d3/2 and Mo 3d5/2 at 231.2 and 228 eV are attributed to Mo4+ of MoS2, and the peak at 225.5 eV is due to the Mo–S bond. Peaks of S 2p1/2 and S 2p3/2 at 161.8 and 160.8 eV are due to S22− of MoS2.43 Therefore, NiSe2 and MoS2 have been deposited on CFP successfully. In addition, compared with CFP@NiSe2 and CFP@MoS2, peaks of Ni 2p and Se 3d show a negative shift, while those of Mo 3d and S 2p have a positive shift in CFP@NiSe2@MoS2, further confirming that the NiSe2@MoS2 heterostructure has been formed.44 The Mo-to-S ratio also needs to be observed because OER active sites of MoS2 have been shown at its edge with S-vacancies.21 According to the peaks of Mo 3d and S 2p shown in Fig. 5(c and d), compared with CFP@MoS2, the Mo/S ratio increases from 0.81 to 0.93 in CFP@NiSe2@MoS2, indicating that S-vacancies increase by about 15% in the latter. Thus, the obtained NiSe2@MoS2 can expose more active sites and improve the OER activity.
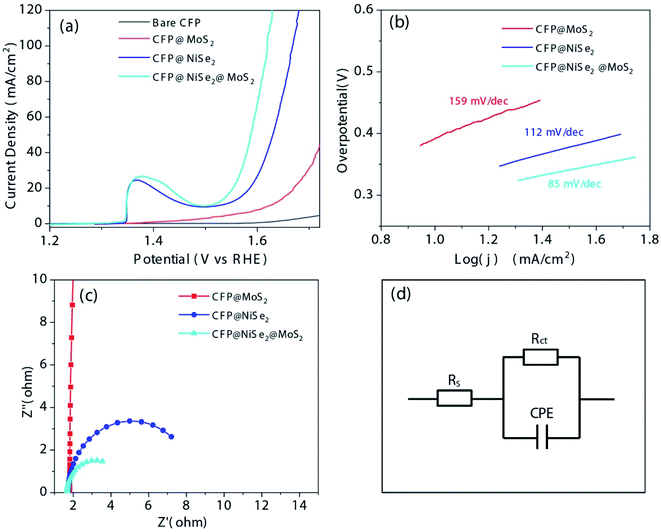
The electrocatalytic OER performances of the samples were evaluated by various electrochemical measurements. The OER polarization curves obtained by LSV in 1 M KOH solution are shown in Fig. 6(a). Unsurprisingly, the bare CFP with an almost zero current density shows no electrocatalytic OER activity in the potential window from 1.2 to 1.7 V (vs. RHE). For CFP@MoS2, the potential driving the current density of 10 mA cm−2 needs 1.62 V (vs. RHE), which indicates an overpotential η10 of 390 mV. Although it has some reduction than CFP, it is still relatively high and worthless as an OER catalyst. In the curve of CFP@NiSe2, the peak at ∼1.36 V (vs. RHE) is attributed to the oxidation of Ni.32,45 It was first oxidized to Ni(OH)2, which proceeded as Ni + 2OH− → Ni(OH)2 + 2e−. As the potential increased, Ni(OH)2 was further oxidized to NiOOH, which proceeded as Ni(OH)2 + OH− → NiOOH + H2O + e−. The overpotential η10 of 290 mV is lower than that of CFP@MoS2. When the current density increases to 20 mA cm−2, the overpotential η20 of 356 mV is also lower than that of CFP@MoS2 (440 mV), indicating a better activity. However, it is not the best. Obviously, CFP@NiSe2@MoS2 with η10 of 267 mV and η20 of 320 mV exhibits the highest catalytic performance.
Tafel slopes of the samples were further observed by fitting the polarization curves with the Tafel equation (η = a + b![[thin space (1/6-em)]](https://www.rsc.org/images/entities/char_2009.gif) log
log![[thin space (1/6-em)]](https://www.rsc.org/images/entities/char_2009.gif) j, where b is the Tafel slope). According to Fig. 6(b) and Table 1, Tafel slopes of the samples are 159, 112, and 85 mV dec−1, respectively. The much smaller Tafel slope of CFP@NiSe2@MoS2 further confirms its excellent OER catalytic performance. It is also compared with that of other MoS2-based and noble metal oxide electro-catalysts reported recently (Table 2). CFP@MoS2 with η10 of 390 mV and b of 159 mV dec−1 shows an obvious activity improvement than the exfoliated MoS2, which can be attributed to the more exposure of active sites induced by the small grain.23 Compared with CFP@MoS2, the performance of CFP@NiSe2@MoS2 has a further improvement. Moreover, the performance of CFP@NiSe2@MoS2 and MoS2/Ni3S2 is similar. However, compared to the dependence of MoS2/Ni3S2 on nickel foam, NiSe2@MoS2 can be deposited on the surface of any conductor as shown in this study, which greatly expands its application.27 Compared with that of Co3S4@MoS2, CoS2–C@MoS2, Co3O4@MoS2/CC, and RuO2, although the Tafel slope of CFP@NiSe2@MoS2 is bigger, it has a smaller overpotential η10, indicating that CFP@NiSe2@MoS2 is an excellent OER electro-catalyst and worth exploring as a substitute for noble metal-based materials.
j, where b is the Tafel slope). According to Fig. 6(b) and Table 1, Tafel slopes of the samples are 159, 112, and 85 mV dec−1, respectively. The much smaller Tafel slope of CFP@NiSe2@MoS2 further confirms its excellent OER catalytic performance. It is also compared with that of other MoS2-based and noble metal oxide electro-catalysts reported recently (Table 2). CFP@MoS2 with η10 of 390 mV and b of 159 mV dec−1 shows an obvious activity improvement than the exfoliated MoS2, which can be attributed to the more exposure of active sites induced by the small grain.23 Compared with CFP@MoS2, the performance of CFP@NiSe2@MoS2 has a further improvement. Moreover, the performance of CFP@NiSe2@MoS2 and MoS2/Ni3S2 is similar. However, compared to the dependence of MoS2/Ni3S2 on nickel foam, NiSe2@MoS2 can be deposited on the surface of any conductor as shown in this study, which greatly expands its application.27 Compared with that of Co3S4@MoS2, CoS2–C@MoS2, Co3O4@MoS2/CC, and RuO2, although the Tafel slope of CFP@NiSe2@MoS2 is bigger, it has a smaller overpotential η10, indicating that CFP@NiSe2@MoS2 is an excellent OER electro-catalyst and worth exploring as a substitute for noble metal-based materials.
| Catalyst | Overpotential η10 (mV) | Overpotential η20 (mV) | Tafel slope b (mV dec−1) |
|---|---|---|---|
| CFP@NiSe2@MoS2 | 267 | 320 | 85 |
| CFP@NiSe2 | 290 | 356 | 112 |
| CFP@MoS2 | 390 | 440 | 159 |
As shown in Fig. 6(c), electrochemical impedance spectra (EIS) of the samples were measured and fitted by the equivalent circuit (Fig. 6(d)), where Rs is the series resistance, Rct is the charge-transfer resistance, and CPE is the constant phase elements. According to Fig. 6(c) and Table 3, Rs and Rct of the samples are 1.81 and 567.6, 1.71 and 6.74, 1.68 and 3.03 Ω, respectively. It can be obtained that Rs values of the samples are slightly different. However, the Rct value has a significant decrease from 567.6 to 3.03 Ω, which indicates that CFP@NiSe2@MoS2 can substantially improve the OER activity.
| Catalyst | Resistance Rs (Ω) | Resistance Rct (Ω) | Cdl (mF cm−2) |
|---|---|---|---|
| CFP@NiSe2@MoS2 | 1.68 | 3.03 | 0.78 |
| CFP@NiSe2 | 1.71 | 6.74 | 4.64 |
| CFP@ MoS2 | 1.81 | 567.6 | 6.25 |
Cdl was used to evaluate ECSA of the samples. As shown in Fig. 7(a–c), CV tests of the samples were performed with different scan rates from 20 to 200 mV s−1 in the regions of non-faradaic potentials (0.68–0.78 V (vs. RHE)). Current density differences between anodic and cathodic versus the scanning rate at 0.73 V a (vs. RHE) are shown in Fig. 7(d). Fitting these data linearly can obtain the Cdl value. According to Fig. 7(d) and Table 3, Cdl values of the samples are 0.78, 4.64, and 6.25 mF cm−2, respectively. The much larger Cdl of CFP@NiSe2@MoS2 among the samples indicates that the ECSA was significantly increased. Hence, the outstanding OER performance of CFP@NiSe2@MoS2 is not only due to the faster electron transfer rate but also due to the increasing ECSA.
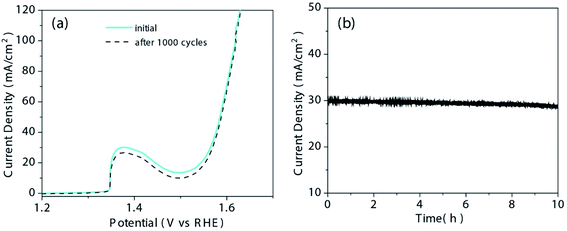
The durability of CFP@NiSe2@MoS2 was further measured by repeating the CV test for 1000 cycles. According to Fig. 8(a), the difference in current density is negligible before and after 1000 cycles. The current density versus time under a constant overpotential of 340 mV is shown in Fig. 8(b). Only 6% loss after 10 h indicates its outstanding durability.
The mechanism that NiSe2@MoS2 has a better catalytic performance than pure MoS2 or NiSe2 can be summarized as follows:
(1) The disordered NiSe2 increases the contact area between MoS2 and the electrolyte solution. NiSe2@MoS2 samples are obtained by depositing MoS2 on NiSe2, while pure MoS2 and NiSe2 are deposited directly on the bare CFP substrate. Compared with the smooth bare CFP substrate, the disordered distribution of NiSe2 nanosheets (as shown in Fig. 2) can further increase the superficial area of MoS2, so as to increase the contact area between MoS2 and the electrolyte solution. This is an effective way to improve the OER efficiency of MoS2. According to the Cdl results (as shown in Fig. 7), the ECSA of NiSe2@MoS2 significantly increased than that of pure NiSe2 and MoS2.
(2) The hybridization of NiSe2 increases the defects of MoS2, which can improve the exposure of active sites and OER activity of MoS2. It has been demonstrated that defects such as doping, atomic vacancy and lattice distortion can increase the exposure of active sites of MoS2.38–40 According to the results of the material characterization, the defects of MoS2 do increase in NiSe2@MoS2. As shown in the Raman results (Fig. 3), some phenomena in NiSe2@MoS2 such as the appearance of the interfering peak at ∼290 cm−1, the blue shift and expansion of the characteristic peak of MoS2, indicate that the crystal symmetry of MoS2 was damaged by the defects.
According to the XPS results (Fig. 5), the ∼15% increase of S-vacancies in NiSe2@MoS2 confirms that the hybridization of NiSe2 increases the exposure of active sites of MoS2.
(3) Doping Ni atoms into MoS2 at the interface of the NiSe2@MoS2 heterostructure can effectively reduce the kinetic energy barrier of the initial water-dissociation step and facilitate the desorption of –OH,27 so as to improve the OER performance. According to Raman and XPS results (Fig. 3 and 5), it can be confirmed that the chemical bonds between NiSe2 and MoS2 are generated at the interface of the NiSe2@MoS2 heterostructure.
4. Conclusion
In summary, the novel NiSe2@MoS2 nano-heterostructure for electrocatalytic OER has been constructed on a CFP substrate by a simple method. The electrocatalytic OER performances were fully evaluated by electrochemical measurements and further compared with that of other MoS2-based and noble metal oxide electro-catalysts. It exhibits an outstanding catalytic performance with an overpotential η20 of 323 mV and a Tafel slope of 85 mV dec−1. Just 6% loss of current density before and after 10 h also indicates its excellent durability. Therefore, it is an excellent OER electro-catalyst and worth exploring as a substitute for noble metal-based materials.Author contributions
Yazhou Huang: resources, conceptualization, methodology, investigation, writing – original draft, writing – review & editing. Jiacai Huang: writing – review & editing, methodology, formal analysis. Kunshan Xu: methodology, data curation. Ranran Geng: validation, formal analysis.Conflicts of interest
There are no conflicts to declare.Acknowledgements
This work was supported by the National Natural Science Foundation of China (51905259), the Natural Science Foundation of Jiangsu Province (BK20191017), the Natural Science Research Program for Higher Education of Jiangsu Province (19KJB460003, 20KJA510007), the Scientific Research Fund of Nanjing Institute of Technology (YKJ201859).References
- M. S. Dresselhaus and I. L. Thomas, Nature, 2001, 414, 332–337 CrossRef CAS.
- A. Yamaguchi, R. Inuzuka, T. Takashima, T. Hayashi, K. Hashimoto and R. Nakamura, Nat. Commun., 2014, 5, 4256 CrossRef CAS PubMed.
- L. Gao, X. Cui, Z. Wang, C. D. Sewell, Z. Li, S. Liang, M. Zhang, J. Li, Y. Hu and Z. Lin, Proc. Natl. Acad. Sci. U. S. A., 2021, 118, e2023421118 CrossRef CAS.
- G. Liao, J. Fang, Q. Li, S. Li, Z. Xu and B. Fang, Nanoscale, 2019, 11, 7062–7096 RSC.
- Y. Zhang, X. Wang, F. Luo, Y. Tan, L. Zeng, B. Fang and A. Liu, Appl. Catal., B, 2019, 256, 117852 CrossRef CAS.
- S. Shen, Z. Lin, K. Song, Z. Wang, L. Huang, L. Yan, F. Meng, Q. Zhang, L. Gu and W. Zhong, Angew. Chem., Int. Ed., 2021, 60, 12360–12365 CrossRef CAS.
- Z. Lin, S. Shen, Z. Wang and W. Zhong, iScience, 2021, 24, 102469 CrossRef.
- C. C. Mccrory, S. Jung, J. C. Peters and T. F. Jaramillo, J. Am. Chem. Soc., 2013, 135, 16977–19687 CrossRef CAS PubMed.
- J. Wang, W. Cui, Q. Liu, Z. Xing, A. M. Asiri and X. Sun, Adv. Mater., 2016, 28, 215–230 CrossRef CAS.
- W. Zhong, Z. Lin, S. Feng, D. Wang, S. Shen, Q. Zhang, L. Gu, Z. Wang and B. Fang, Nanoscale, 2019, 11, 4407–4413 RSC.
- L. Xu, Z. Wang, J. Wang, Z. Xiao, X. Huang, Z. Liu and S. Wang, Nanotechnology, 2017, 28, 165402 CrossRef.
- H. Li, Y. Shao, Y. Su, Y. Gao and X. Wang, Chem. Mater., 2016, 28, 1155–1164 CrossRef CAS.
- J. R. Swierk, S. Klaus, L. Trotochaud, A. T. Bell and T. D. Tilley, J. Phys. Chem. C, 2015, 119, 19022–19029 CrossRef CAS.
- T. Chun, C. Ningyan, P. Zonghua, X. Wei and S. Xuping, Angew. Chem., Int. Ed., 2015, 54, 9351–9355 CrossRef.
- L. Feng, F. Song and X. Hu, Energy Environ. Sci., 2015, 8, 2347–2351 RSC.
- X. Cui, S. Lei, A. C. Wang, L. Gao, Q. Zhang, Y. Yang and Z. Lin, Nano Energy, 2020, 70, 104525 CrossRef CAS.
- A. Xu, W. Tu, S. Shen, Z. Lin, N. Gao and W. Zhong, Appl. Surf. Sci., 2020, 528, 146949 CrossRef CAS.
- Z. Wang, Z. Lin, J. Deng, S. Shen, F. Meng, J. Zhang, Q. Zhang, W. Zhong and L. Gu, Adv. Energy Mater., 2021, 11, 2003023 CrossRef CAS.
- Y. Yan, B. Y. Xia, Z. Xu and X. Wang, ACS Catal., 2014, 4, 1693–1705 CrossRef CAS.
- J. D. Benck, Z. B. Chen, L. Y. Kuritzky, A. J. Forman and T. F. Jaramillo, ACS Catal., 2012, 2, 1916–1923 CrossRef CAS.
- B. Mohanty, M. Ghorbani-Asl, S. Kretschmer, A. Ghosh, P. Guha, S. K. Panda, B. Jena, A. V. Krasheninnikov and B. K. Jena, ACS Catal., 2018, 8, 1683–1689 CrossRef CAS.
- D. Xiong, Q. Zhang, W. Li, J. Li, X. Fu, M. F. Cerqueira, P. Alpuim and L. Liu, Nanoscale, 2017, 9, 2711–2717 RSC.
- Y. Huang, L. Liu and X. Liu, Nanotechnology, 2019, 30, 095402 CrossRef CAS PubMed.
- H. Zhu, J. Zhang, R. Yanzhang, M. Du, Q. Wang, G. Gao, J. Wu, G. Wu, M. Zhang, B. Liu, J. Yao and X. Zhang, Adv. Mater., 2015, 27, 4752–4759 CrossRef CAS PubMed.
- J. Bai, T. Meng, D. Guo, S. Wang, B. Mao and M. Cao, ACS Appl. Mater. Interfaces, 2018, 10, 1678–1689 CrossRef CAS.
- Y. Zhu, L. Song, N. Song, M. Li, C. Wang and X. Lu, ACS Sustainable Chem. Eng., 2019, 7, 2899–2905 CrossRef CAS.
- J. Zhang, T. Wang, D. Pohl, B. Rellinghaus, R. Dong, S. Liu, X. Zhuang and X. Feng, Angew. Chem., 2016, 128, 6814–6819 CrossRef.
- X. Zhao, Y. Yang, Y. Li, X. Cui, Y. Zhang and P. Xiao, J. Mater. Sci., 2016, 51, 3724–3734 CrossRef CAS.
- W. Zhong, Z. Wang, N. Gao, L. Huang, Z. Lin, Y. Liu, F. Meng, J. Deng, S. Jin, Q. Zhang and L. Gu, Angew. Chem., Int. Ed., 2020, 59, 22743–22748 CrossRef CAS.
- W. Zhong, B. Xiao, Z. Lin, Z. Wang, L. Huang, S. Shen, Q. Zhang and L. Gu, Adv. Mater., 2021, 33, 2007894 CrossRef CAS.
- Z. Lin, B. Xiao, Z. Wang, W. Tao, S. Shen, L. Huang, J. Zhang, F. Meng, Q. Zhang, L. Gu and W. Zhong, Adv. Funct. Mater., 2021, 2102321 CrossRef.
- J. Zhu and Y. Ni, CrystEngComm, 2018, 20, 3344–3352 RSC.
- Y. Huang, J. Lv, J. Huang, K. Xu and L. Liu, Nanotechnology, 2021, 32, 175602 CrossRef PubMed.
- F. Wang, Y. Li, T. A. Shifa, K. Liu, F. Wang, Z. Wang, P. Xu, Q. Wang and J. He, Angew. Chem., Int. Ed., 2016, 55, 6919–6924 CrossRef CAS PubMed.
- L. Liu, Y. Huang, J. Sha and Y. Chen, Nanotechnology, 2017, 28, 195605 CrossRef PubMed.
- Z. Jin, S. Shin, D. H. Kwon, S.-J. Han and Y.-S. Min, Nanoscale, 2014, 6, 14453–14458 RSC.
- C. d. l. Heras and F. Agulló-Rueda, J. Phys.: Condens. Matter, 2000, 12, 5317–5324 CrossRef.
- J. Xie, H. Zhang, S. Li, R. Wang, X. Sun, M. Zhou, J. Zhou, X. W. Lou and Y. Xie, Adv. Mater., 2013, 25, 5807–5813 CrossRef CAS PubMed.
- H. Li, C. Tsai, A. L. Koh, L. Cai, A. W. Contryman, A. H. Fragapane, J. Zhao, H. S. Han, H. C. Manoharan, F. Abild-Pedersen, J. K. Nørskov and X. Zheng, Nat. Mater., 2016, 15, 48–53 CrossRef CAS PubMed.
- J. Zhang, X. Xu, L. Yang, D. Cheng and D. Cao, Small Methods, 2019, 3, 1900653 CrossRef CAS.
- I. H. Kwak, H. S. Im, D. M. Jang, Y. W. Kim, K. Park, Y. R. Lim, E. H. Cha and J. Park, ACS Appl. Mater. Interfaces, 2016, 8, 5327–5334 CrossRef CAS.
- J. Liang, Y. Yang, J. Zhang, J. Wu, P. Dong, J. Yuan, G. Zhang and J. Lou, Nanoscale, 2015, 7, 14813–14816 RSC.
- L. Liu, X. Liu and S. Jiao, J. Colloid Interface Sci., 2020, 564, 77–87 CrossRef CAS PubMed.
- S. Li, W. Zang, X. Liu, S. J. Pennycook, Z. Kou, C. Yang, C. Guan and J. Wang, Chem. Eng. J., 2019, 359, 1419–1426 CrossRef CAS.
- M. W. Louie and A. T. Bell, J. Am. Chem. Soc., 2013, 135, 12329–12337 CrossRef CAS.
- J. Wu, M. Liu, K. Chatterjee, K. P. Hackenberg, J. Shen, X. Zou, Y. Yan, J. Gu, Y. Yang, J. Lou and P. M. Ajayan, Adv. Mater. Interfaces, 2016, 3, 1500669 CrossRef.
- Y. Guo, J. Tang, Z. Wang, Y.-M. Kang, Y. Bando and Y. Yamauchi, Nano Energy, 2018, 47, 494–502 CrossRef CAS.
- J. Liu, J. Wang, B. Zhang, Y. Ruan, H. Wan, X. Ji, K. Xu, D. Zha, L. Miao and J. Jiang, J. Mater. Chem. A, 2018, 6, 2067–2072 RSC.
- S. Jung, C. C. L. McCrory, I. M. Ferrer, J. C. Peters and T. F. Jaramillo, J. Mater. Chem. A, 2016, 4, 3068–3076 RSC.
| This journal is © The Royal Society of Chemistry 2021 |

