 Open Access Article
Effect of Ce doping on the structure–activity relationship of MoVOx composite metal oxides†
Luyao Denga,
Shuangming Li*ab,
Yongwei Liua,
Zixuan Lua,
Yaoxin Fana,
Yunong Yana and
Sansan Yu *ab
*ab
aCollege of Chemical Engineering, Shenyang University of Chemical Technology, No. 9, 11 St., Shenyang Economic & Technological Development Zone, Shenyang 110142, China. E-mail: lishuangming@syuct.edu.cn
bKey Laboratory of Chemical Separation Technology of Liaoning Province, Shenyang University of Chemical Technology, Shenyang 110142, China. E-mail: ssyu@syuct.edu.cn; Fax: +86 24 89383760; Tel: +86 24 89388453
First published on 8th November 2021
Abstract
A series of Ce-doped MoVOx composite metal oxide catalysts were prepared by the rotary evaporation method. The effects of Ce doping ratio on the crystal phase composition, morphology and surface properties of the catalysts were investigated. The results show that the crystal phase composition of samples with different Ce doping content is also obviously different. When the doping amount is small, V0.95Mo0.97O5 is the main crystal phase, while MoO3 is dominant when the doping amount is large. The Ce-doped catalyst showed obvious rod-shaped morphology and its average single point pore diameter and the number of acidic sites increased. Compared to the un-doped MoVOx, the pore size of the sample synthesized at a Mo/Ce atomic ratio of 10/1 exhibited an increase of 41.11 nm. In addition, the effect of Ce doping on the catalytic performance of MoVOx was investigated with the selective oxidation of benzyl alcohol as a probe reaction. After doping, the MoVOx catalyst showed improved benzyl alcohol conversion and selectivity to benzaldehyde. At a Mo/Ce atomic ratio of 10/1, the conversion rate of benzyl alcohol reaches 83.26%, which is 64.56% higher than that without doping, and the highest product yield can reach 76.47%.
1. Introduction
The selective oxidation of alcohols and hydrocarbons is one of the important reactions in the chemical industry. Through this reaction, a series of high value-added oxygen-containing products such as alcohols, aldehydes, ketones, and acids can be produced.1–3 The selective oxidative dehydrogenation of benzaldehyde is a typical example. However, the type of catalyst has an important influence on the formation of the target product. In the past few years, the most commonly used catalysts for selective oxidation of benzyl alcohol are heterogeneous catalysts, and metal-based oxides are some of the most important heterogeneous catalysts.4–7 Among them Mo based oxides have broad prospects in the selective oxidation of alcohols and hydrocarbons due to their unique structure and catalytic performance. At present, Mo–V–O composite metal oxides are widely used in selective oxidation of alcohols and hydrocarbons, such as oxidation of glycerol to acrylic acid, and oxidation of propane, acrolein, and isobutane to acrylic acid, and ethane, respectively.8–10 Studies have shown that the single metal oxide MoO3 can exhibit excellent catalytic activity in alcohol dehydrogenation reactions, but MoO3 alone is prone to phase change and deactivation during the catalytic process.11,12 When MoO3 and other Mo based oxides co-exist, they can form a synergistic effect with the main crystalline phase, which can significantly improve the selectivity of the catalyst and prolong the service life of the catalyst. However, it is still difficult for the catalytic performance of Mo–V–O composite metal oxides to meet the needs of industrialization. How to further improve its catalytic performance (i.e. raw material conversion and product selectivity) is an urgent problem to be solved in this field. It is documented that the structure of MoVOx is the decisive factor affecting its catalytic performance, in which the crystal phase composition, pore size, and redox capacity are affected by the preparation conditions.13–16 Therefore, the structure of the catalyst can be optimized by controlling the preparation method and conditions.At present, the methods for optimizing catalyst structure mainly include carrier supporting, weak acid treating, additives adding and element doping.17–19 Among them, as a simplest and effective method, element doping has been widely used in the improvement of composite metal oxide catalysts structure and properties in recent years.20 For example, introduce a less amount of W element can enhance the acidity of Mo–V–O catalyst, and the yield of glycerol oxidation to acrylic acid can reaches 50.5%, the doping of P doping can increase the acidic sites of the Mo–V–Te–O catalyst and increase the selectivity of propane oxidation to acrylic acid, from almost zero to 17%.17 The addition of Au can change the particle morphology of Mo–V–Te–Nb–O catalyst and significantly promote the oxidative dehydrogenation of propane.21 Mn can enhance the surficial V5+ content of Mo–V–Te–Nb–O catalyst, improving the catalytic performance of the catalyst for oxidative dehydrogenation of ethane to ethylene.22 Mg doping can improve the activity of Mo–V–W–Cu–Sb catalyst, in which the conversion rate of acrolein and the yield of acrylic acid reaches 99.2% and 95.2%, respectively.18 The appropriate amount of Cr doping can reduce the strength of acidic sites of Mo–V–Te–Nb–O catalyst, promoting the activation of propane and the selectivity (78.3%).23 In addition, the rare earth element cerium (Ce) is also an important element for the structural optimization of composite metal oxides. The existence of Ce will affect the growth process of catalyst particles, which is conducive to obtain small-size particles.24 Moreover, due to the Ce element has unique redox properties and high oxygen storage capacity, the Ce3+/Ce4+ ion pair formed on the surface of the composite metal oxide can significantly increase the redox capacity of the catalyst, enhancing the migration of lattice oxygen and the catalytic activity of oxides.25
To our knowledge, there is no report on the effect of Ce doping on the structure and performance of Mo–V–O composite metal oxide catalyst at present. In this work, the effect of Ce doping amount on the crystal phase composition, specific surface area, pore size, particle size, acidic sites, and morphology of MoVOx is investigated. Furthermore, the catalytic performance of Ce-doped MoVOx in the selective oxidation of benzyl alcohol to benzaldehyde is also studied. An appropriate Ce doping ratio can change the crystal phase structure and micromorphology of the catalyst and improve the catalytic performance, in which the conversion rate of benzyl alcohol and the selectivity of benzaldehyde reached 83.26% and 91.81%, respectively.
2. Experimental section
2.1 Preparation
Ce-doped MoVOx composite metal oxide catalysts were prepared by the rotary evaporation method. Weigh (NH4)6Mo7O24·4H2O, NH4VO3 and Ce(NO3)3·6H2O according to Mo/V/Ce (molar ratio) = 1![[thin space (1/6-em)]](https://www.rsc.org/images/entities/char_2009.gif) :
:![[thin space (1/6-em)]](https://www.rsc.org/images/entities/char_2009.gif) 0.4
0.4![[thin space (1/6-em)]](https://www.rsc.org/images/entities/char_2009.gif) :
:![[thin space (1/6-em)]](https://www.rsc.org/images/entities/char_2009.gif) x (x = 0, 0.02, 0.05, 0.10, 0.20, 0.33) and dissolve them in 100 mL deionized water to obtain mixed solution A, which was stirred at a constant temperature of 70 °C for 30 minutes, obtaining a clear and transparent orange-yellow solution B, the solution B was rotary evaporated and then precursor was obtained. The precursor was calcined in air at 260 °C for 2 h, and then calcined in nitrogen at 500 °C for 2 h. Ce doped MoVOx was obtained. The catalyst particles with a diameter of 0.90–0.45 mm were obtained by grinding, tableting, crushing, and sieving. The preparation ratio of the Ce doped catalyst is shown in Table 1.
x (x = 0, 0.02, 0.05, 0.10, 0.20, 0.33) and dissolve them in 100 mL deionized water to obtain mixed solution A, which was stirred at a constant temperature of 70 °C for 30 minutes, obtaining a clear and transparent orange-yellow solution B, the solution B was rotary evaporated and then precursor was obtained. The precursor was calcined in air at 260 °C for 2 h, and then calcined in nitrogen at 500 °C for 2 h. Ce doped MoVOx was obtained. The catalyst particles with a diameter of 0.90–0.45 mm were obtained by grinding, tableting, crushing, and sieving. The preparation ratio of the Ce doped catalyst is shown in Table 1.
| Catalyst | Mo | V | Ce |
|---|---|---|---|
| Ce-0 | 1 | 0.4 | 0 |
| Ce-0.02 | 1 | 0.4 | 0.02 |
| Ce-0.05 | 1 | 0.4 | 0.05 |
| Ce-0.10 | 1 | 0.4 | 0.1 |
| Ce-0.20 | 1 | 0.4 | 0.2 |
| Ce-0.33 | 1 | 0.4 | 0.33 |
(NH4)6Mo7O24·4H2O, NH4VO3, C7H8O, Ce(NO3)3·6H2O and C7H6O were analytical reagent (AR) grade and purchased from Sinopharm Chemical Reagent Co, Ltd. (Shanghai, China), C7H8, C8H8O2, C2H6O, C6H12 were analytical reagent (AR) grade and purchased from HengXing Chemical Reagent Co, Ltd. (Tianjin, China). Deionized water (H2O) made in the laboratory.
2.2 Characterization
The structure and purity of the products were identified by XRD, which was carried out on a D8 Advance X-ray generator (Bruker AXS Company, Germany) by using Cu Kα radiation. The X-ray intensity was measured over a 2θ diffraction angle from 5° to 60° with a step size of 5° min−1. Scanning electron microscopy (SEM) observations were performed on a field emission scanning electron microscope (Gimin300, ZEISS, Germany). The specific surface area was recorded by the BET method using nitrogen adsorption–desorption isotherms at liquid nitrogen temperature of −196 °C on an Autosorb-IQ gas adsorption analyzer (Beijing Builder, China). Hydrogen temperature-programmed reduction (H2-TPR) and ammonia temperature-programmed desorption (NH3-TPD) were carried out in a ChemBET system (Quantachrome, USA) equipped with a thermal conductivity detector. For H2-TPR, 0.1 g catalyst was reduced in 10% H2/Ar with a flow rate of 30 mL min−1 from room temperature to 900 °C at a heating rate of 10 °C min−1. For NH3-TPD, catalysts were carried out in 7% NH3/He from room temperature to 950 °C with the same heating rate. The X-ray photoelectron spectroscopy (XPS) was carried out on an ESCALAB 250Xi spectrometer (Thermo Fischer, USA), in which the excitation source was Al Kα ray (hν = 1486.6 eV). All binding energies (BE) were calibrated by using C 1s peak of contaminant carbon (BE = 284.6 eV) as an internal standard.2.3 Catalytic tests
The oxidation of benzyl alcohol was carried out in a fixed-bed stainless steel tubular reactor (i.d. 8 mm, length 400 mm). The carrier gas is a mixture of nitrogen and oxygen, reactor was heated to the reaction temperature. The raw material solution with a concentration of 50% was prepared by dissolving benzyl alcohol in cyclohexane. The raw material solution (0.05 mL min−1) was supplied through a syringe pump. The raw steam is mixed with N2 and O2 and then enters the reactor. The space velocity is 30.87 h−1. The reaction products were collected at a given time interval after being condensed with ice water and then analyzed by a liquid chromatograph (HPLC, Agilent 1260, USA) equipped with diode array (DAD) as detector and ZORBAX SB-C18 chromatography columns.3. Results and discussion
3.1 Characterization
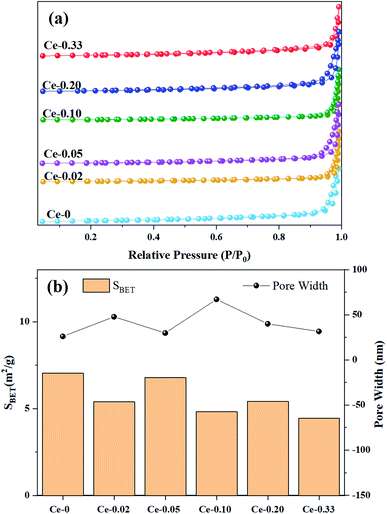
| Catalyst | SBETa (m2 g−1) | DPa (nm) | Average grain sizeb (nm) |
|---|---|---|---|
| a Calculated by BET analysis.b Calculated from XRD data using Scherrer formula. | |||
| Ce-0 | 7.035 | 26.01 | 2699.92 |
| Ce-0.02 | 5.391 | 47.80 | 2573.83 |
| Ce-0.05 | 6.779 | 29.79 | 2523.08 |
| Ce-0.10 | 4.828 | 67.12 | 2124.37 |
| Ce-0.20 | 5.414 | 39.99 | 2062.57 |
| Ce-0.33 | 4.458 | 31.55 | 1287.89 |
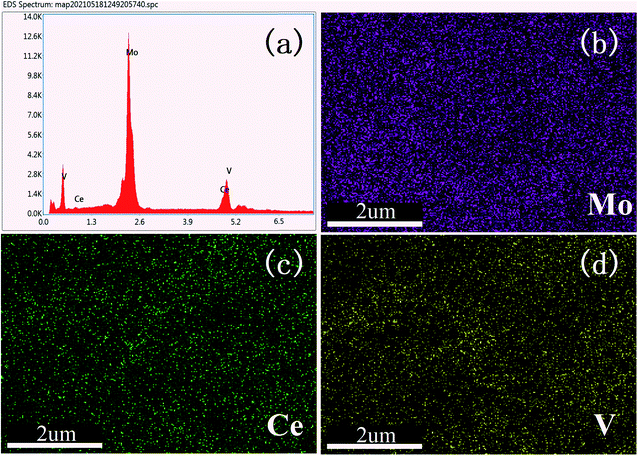
For further verification of the incorporation of Ce atoms, EDS elemental mapping images were obtained for the Ce-0.10 sample, as shown in Fig. 3. The results show that all components (Mo, V, and Ce) were highly distributed within the samples. There is no evidence of metal oxide aggregation or segregation effect. The highest content of Mo atom is 73%, V atom is 18%, and Ce atom is 9%.
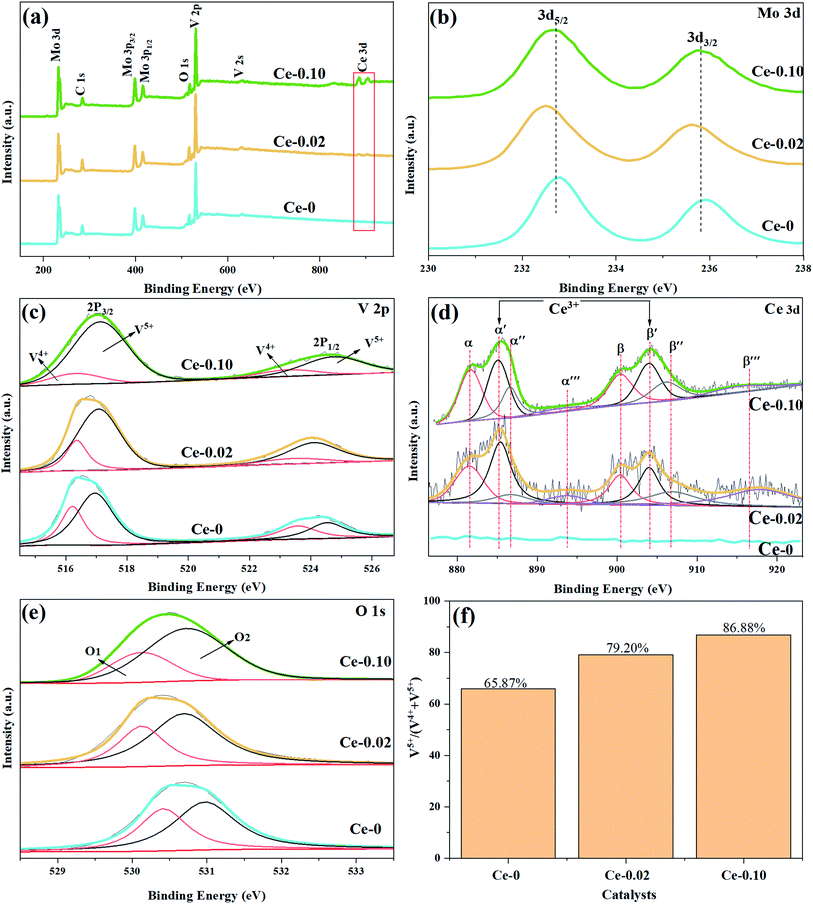 | ||
| Fig. 7 XPS survey spectrum of Ce doped MoVOx catalysts (a), high resolution spectra of Mo 3d (b), V 2p (c), Ce 3d (d), O 1s (e) and V5+/(V4++V5+) (f). | ||
| Catalyst | Atomic (%) | ||
|---|---|---|---|
| Ce 3d | Mo 3d | V 2p | |
| Ce-0 | 0 | 34.20 | 10.87 |
| Ce-0.02 | 0.92 | 27.48 | 11.56 |
| Ce-0.10 | 3.56 | 32.42 | 10.86 |
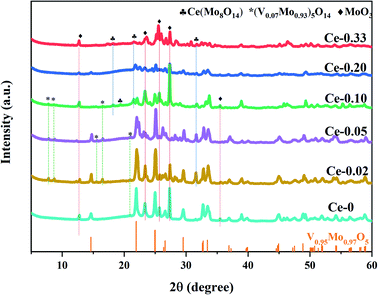
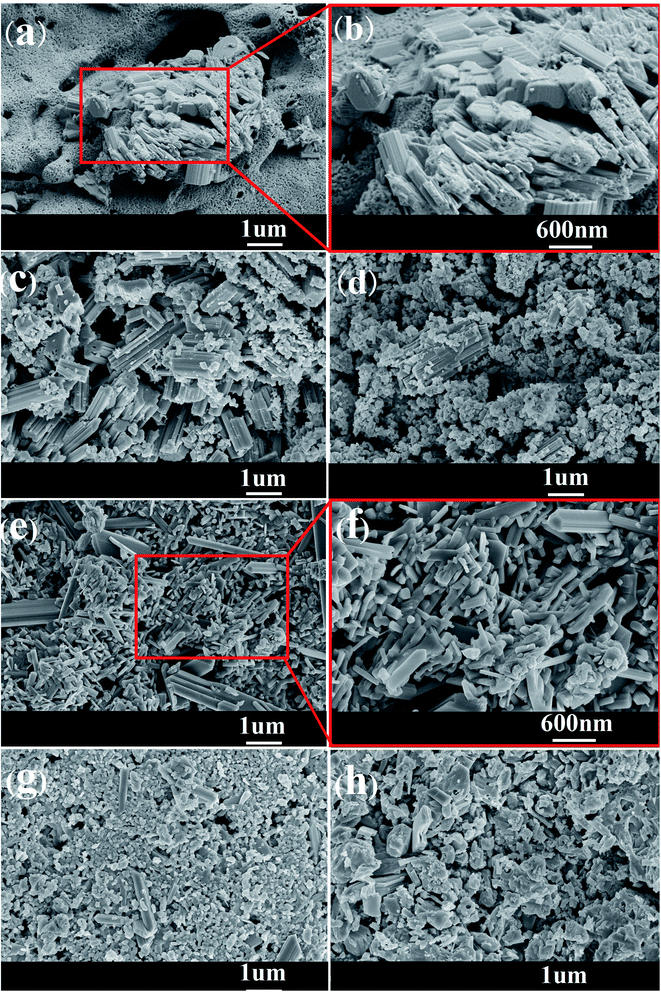
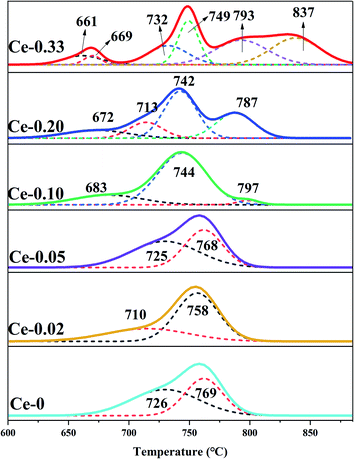
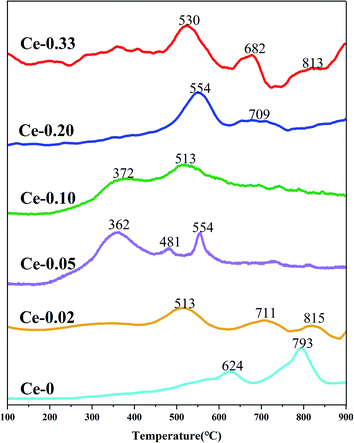
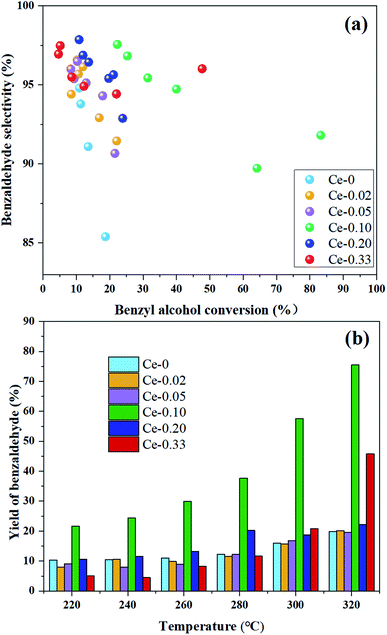
With the doping of Ce, the crystal phases of V0.95Mo0.97O5 and (V0.07Mo0.93)5O14 gradually disappear, and Ce(Mo8O14) gradually forms; in Ce-0.10 samples, MoO3 has the highest diffraction peak intensity, and its synergistic effect with V0.95Mo0.97O5 is also the most significant. The specific surface area of the catalyst is similar and does not change much. There is a rising first and falling trend in pore diameter, the grain size gradually becomes smaller, the reduction temperature shifts to low temperature. However, for the three samples with more Ce doping, the Ce4+ content decreased, the reduction peak area corresponding to the Ce element increased, and a new high-temperature reduction peak appeared, this probably one of the reasons that the performance of Ce-0.10 samples have been significantly improved, while the performance of Ce-0.20 and Ce-0.33 samples have been reduced. The Ce-doped catalyst contains more Brønsted acid sites, the trend of catalytic performance of different Ce doped MoVOx samples, was completely consistent with that of the changing trend of Brønsted acid sites. The best catalytic performance is achieved under the doping amount of the Ce-0.10 sample. At this time, the conversion of benzyl alcohol is 83.26%, the selectivity of benzaldehyde is 91.81%, and the yield of benzaldehyde is 76.47%. Indicating that the amount of Ce doping is related to the NH3 adsorption capacity, which has an important influence on the catalytic activity. With the increase of Ce doping ratio, the contents of Mo6+ and V5+ also increase, and the Ce 3d in the catalyst increased from 0.92% (Ce-0.02) to 3.56% (Ce-0.10) (Table 3). Ce doping makes the catalyst pore size larger and greatly improves the oxygen storage capacity. At the same time, the rod-shaped is fully exposed, resulting in the increase of active sites in contact with raw materials, and the lower reduction temperature is more conducive to the improvement of catalytic performance. The results show that the performance of the MoVOx catalyst is greatly improved by doping Ce, but excessive Ce doping will have a negative effect on the catalytic performance.
4. Conclusions
Six Ce-doped MoVOx composite metal oxides were fabricated by using the rotary evaporation method and their catalytic performance was investigated. It is concluded that the crystalline phase, morphology, surface properties, as well as acidic and redox properties were influenced greatly by the Ce doping. The addition of Ce in MoVOx can improve the reducibility at low temperature, increase the average pore size and the number of acid sites, and improves the aggregation of rod-shaped, enhances the activity of lattice oxygen reaction, and significantly improves the catalytic performance of MoVOx. MoVOx prepared with Mo/Ce atomic ratio of 10/1 exhibits the best catalytic performance due to its largest pore size, the most acidic sites, and well-dispersed rod-shaped morphology, in which the benzyl alcohol conversion and selectivity to benzaldehyde achieved 83.26% and 91.81%, respectively.Conflicts of interest
There are no conflicts to declare.Acknowledgements
The authors gratefully acknowledge the financial supports by the National Natural Science Foundation of China (No. 21706165), Scientific Research Fund of Liaoning Provincial Education Department, China (No. LQ2019007) and LiaoNing Revitalization Talents Program (No. XLYC2002001), and Natural Science Foundation of Liaoning Province, China (No. 2021-MS-255).References
- C.-G. Gamaliel, Q.-S. Roberto, S. R.-M. Richard, J. S. Valente and O. C.-A. Carlos, Chem. Eng. J., 2014, 252, 75–88 CrossRef.
- D. Delgado, R. Sanchís, J. A. Cecilia, E. Rodríguez-Castellón, A. Caballero, B. Solsona and J. M. López Nieto, Catal. Today, 2019, 333, 10–16 CrossRef CAS.
- G. Reena, S. Bipul, B. Arijit, L. Frederic, S. Siddharth, P. Chandrashekar and B. Ankur, J. Mater. Chem. A, 2016, 4(47), 18559–18569 RSC.
- K. Y. Koltunov, E. V. Ishchenko and V. I. Sobolev, Catal. Commun., 2018, 117, 49–52 CrossRef CAS.
- D. P. Cristina, F. Ermelinda and R. Michele, J. Catal., 2008, 260(2), 384–386 CrossRef.
- Z. Wang, J. J. Feng, X. L. Li, R. Oh, D. D. Shi and O. Akdim, J. Colloid Interface Sci., 2021, 588, 787–794 CrossRef CAS PubMed.
- L. L. Li, X. J. Zhou, L. Liu, S. Jiang, Y. J. Li and L. X. Guo, Catalysis, 2019, 9(6), 538 Search PubMed.
- M. O. Guerrero-Pérez, M. C. Herrera, I. Malpartida, M. A. Larrubia and L. J. Alemany, Catal. Today, 2006, 118(3–4), 360–365 CrossRef.
- X. C. Zhang, M. Wang, C. F. Zhang, J. M. Lu, Y. H. Wang and F. Wang, RSC Adv., 2016, 6(75), 70842–70847 RSC.
- L. F. Rasteiro, L. H. Vieira, C. V. Santilli and L. Martins, RSC Adv., 2018, 8(22), 11975–11982 RSC.
- K. V. Raun, L. F. Lundegaard, B. Pablo, C. C. Appel, N. Kenneth, T. Max, S. Max, D. J. Anker, D. G. Jan and H. Martin, Catal. Lett., 2019, 150, 1434–1444 CrossRef.
- Y. M. He, Y. Wu, W. Z. Weng and H. L. Wan, J. Nat. Gas Chem., 2011, 20(3), 249–255 CrossRef CAS.
- Z. X. Yu, W. Zheng, W. L. Xu, P. Zhang, H. Y. Fu and Y. H. Zhang, T. Nonferr. Metal Soc., 2011, 21, s405–s411 CrossRef.
- B. M. Bacaa, A. Pigamoa, J. L. Duboisb and J. M. M. Millet, Top. Catal., 2003, 23(1), 39–46 CrossRef.
- Q. He, J. Woo, A. Belianinov, V. V. Guliants and A. Y. Borisevich, ACS Nano, 2015, 9(4), 3470–3478 CrossRef CAS PubMed.
- B. Z. Chu, L. Truter, T. A. Nijhuis and Y. Cheng, Appl. Catal. Gen., 2015, 498, 99–106 CrossRef CAS.
- R. K. Grasselli, C. G. Lugmair, A. F. Volpe Jr, A. Andersson and J. D. Burrington, Catal. Today, 2010, 157(1–4), 33–38 CrossRef CAS.
- X. J. Bian, Studies on the selective oxidation of acrolein to acrylic acid over the Mo–V-based complex metal oxide catalysts, Master's thesis, Hunan University, Changsha, 2014 Search PubMed.
- F. Wang and W. Ueda, Appl. Catal. Gen., 2008, 346(1–2), 155–163 CrossRef CAS.
- B. Deniau, J. Millet, S. Loridant, N. Christin and J. L. Dubois, J. Catal., 2008, 260(1), 30–36 CrossRef CAS.
- E. V. Lazareva, V. M. Bondareva, D. A. Svintsitskiy, A. V. Ishchenko, A. S. Marchuk, E. P. Kovalev and T. Y. Kardash, Catal. Today, 2021, 361, 50–56 CrossRef CAS.
- X. Chen, D. Dang, H. An, B. Chu and Y. Cheng, J. Taiwan Inst. Chem. Eng., 2019, 95, 103–111 CrossRef CAS.
- A. X. Xu, Y. Wang, H. Q. Ge, S. Chen, Y. H. Li and W. M. Lu, Chin. J. Catal., 2013, 34(12), 2183–2191 CrossRef CAS.
- J. Wen, H. Guo, X. Ma, Z. Wei, X. He, L. Zhang, B. Li, T. Wang and Y. Cheng, Catal. Sci. Technol., 2020, 10(11), 3739–3747 RSC.
- X. Liu, S. Jiang, M. Niu, S. Li, W. Li and S. Yu, J. Nanosci. Nanotechnol., 2019, 19(2), 833–838 CrossRef CAS PubMed.
- X. Zhang, H. L. Wan, W. Z. Weng and X. D. Yi, Catal. Lett., 2003, 87, 3–4 CrossRef.
- S. M. Li, H. Shao, L. L. Xu, C. Chen, J. S. Ma, Q. Liu, X. G. San, W. X. Li, N. Tsubaki and S. S. Yu, J. Mol. Catal., 2014, 28(2), 132–139 CAS.
- H. Wang, Z. Deng, W. Chu and W. Yang, React. Kinet. Catal. Lett., 2009, 97(2), 233–241 CrossRef CAS.
- D. Verma, B. S. Rana, R. Kumar, M. G. Sibi and A. K. Sinha, Appl. Catal. Gen., 2015, 490, 108–116 CrossRef CAS.
- D. Verma, R. Insyani, Y. W. Suh, S. M. Kim, S. K. Kim and J. Kim, Green Chem., 2017, 19(8), 1969–1982 RSC.
- V. Ranaware, D. Verma, R. Insyani, A. Riaz, S. M. Kim and J. Kim, Green Chem., 2019, 21(5), 1021–1042 RSC.
- K. Asakura, K. Nakatani, T. Kubota and Y. Iwasawa, J. Catal., 2000, 194(2), 309–317 CrossRef CAS.
- J. B. Wagner, O. Timpe, F. A. Hamid, A. Trunschke, U. Wild, S. S. Dang, R. K. Widi, S. Hamid and R. Schlögl, Top. Catal., 2006, 38(1–3), 51–58 CrossRef CAS.
- M. O. Guerrero-Pérez, M. C. Herrera, I. Malpartida, M. A. Larrubia and L. J. Alemany, Catal. Today, 2008, 133–135, 919–924 CrossRef.
- N. Hayashi, Y. Sakai, H. Tsunoyama and A. Nakajima, Langmuir, 2014, 30(34), 10539–10547 CrossRef CAS PubMed.
- D. X. Yin, H. Yang, S. Wang, Z. D. Yang, Q. Y. Liu, X. X. Zhang and X. Zhang, Colloid. Surface. Physicochem. Eng. Aspect., 2020, 607 Search PubMed.
- W. Xu, H. He and Y. Yu, J. Phys. Chem. C, 2009, 113(11), 4426–4432 CrossRef CAS.
Footnote |
| † Electronic supplementary information (ESI) available. See DOI: 10.1039/d1ra05531c |
| This journal is © The Royal Society of Chemistry 2021 |

