 Open Access Article
Structural characterization, anti-inflammatory and glycosidase inhibitory activities of two new polysaccharides from the root of Pueraria lobata
Jiale Cai†
 abc,
Xiaoting Zhong†abc,
Jiayin Liang†abc,
Can Xuabc,
Huanzheng Yuabc,
Minghua Xian
 *abc,
Chunyan Yan*a and
Shumei Wang
 *abc
*abc
aGuangdong Pharmaceutical University, Guangzhou 510006, China. E-mail: gdpuwsm@126.com; ycybridge@gdpu.edu.cn; xmh360@163.com
bKey Laboratory of Digital Quality Evaluation of Chinese Materia Medica of State Administration of TCM, School of Traditional Chinese Medicine, Guangdong Pharmaceutical University, Guangzhou 510006, China
cEngineering & Technology Research Center for Chinese Materia Medica Quality of the Universities of Guangdong Province, School of Traditional Chinese Medicine, Guangdong Pharmaceutical University, Guangzhou 510006, China
First published on 8th November 2021
Abstract
Diabetes seriously endangers public health and brings a heavy economic burden to the country. Inflammation is one of the main inducing factors of type-2 diabetes (T2D) and may cause some complications of diabetes, such as diabetic encephalopathy and peripheral neuropathy. In-depth research and development of drugs to cure diabetes and complications are of great significance. Pueraria lobate is a medicinal herb used in several countries to treat many diseases. Here, two new polysaccharides (PLB-1-1 and PLB-1-2) were isolated and purified from the root of Pueraria lobata with molecular weights of 9.1 × 10³ Da and 3.8 × 10³ Da, respectively. The structure was evaluated by monosaccharide composition, GC-MS and NMR spectroscopy. It was determined that PLB-1-1 comprised →4)-α-D-Glcp-(1→, α-D-Glcp-(1→, →6)-β-D-Galp-(1→, →3)-α-L-Araf-(1→, →3,6)-β-D-Manp-(1→ and →4,6)-β-D-Manp-(1→, and PLB-1-2 consisted of →4)-α-D-Glcp-(1→, β-D-Glcp-(1→, →4,6)-β-D-Glcp-(1→, →3,6)-β-D-Manp-(1→ and α-L-Fucp-(1→. Furthermore, both PLB-1-1 and PLB-1-2 showed anti-inflammatory and inhibitory activities of α-glucosidase and α-amylase in vitro. Therefore, the new polysaccharides, i.e., PLB-1-1 and PLB-1-2, may be considered candidates for the treatment of diabetes and its related complications.
1. Introduction
Diabetes mellitus or diabetes is a long-lasting endocrine malady with considerably elevated levels of blood glucose, and is the most prevalent and progressive disease affecting millions of people across the globe. It is expected to affect 693 million adults by 2045, an increase of more than 50 percent over 2017.1 It is similar to cardiovascular diseases and cancer, and has plagued many doctors and patients in China.2 Diabetes is typically categorized into type-1 diabetes (T1D) and type-2 diabetes (T2D). Moreover, other clinically recognizable subtypes, including monogenic diabetes (for example neonatal diabetes), gestational diabetes, and possible late-onset autoimmune type (adult latent autoimmune diabetes)3 exist. In all patients with diabetes, T2D patients can reach more than 90%, and the incidence rate is much higher than T1D.4,5 At present, the main way to treat T2D is to control diet, increase physical activity and keep weight within the normal range. In addition, there are other prevention and treatment options, such as eating specially designed functional foods.6–8Inflammation is characterized by dysfunction and tissue damage, usually manifested as a loss of function, fever and pain.9 Inflammation is ubiquitous in many chronic non-communicable diseases, such as T2D, cancer, and cardiovascular diseases.10,11 Therefore, we can conceive that attacking chronic low-grade inflammation will be conducive to treating these diseases, and these diseases account for almost 37% of global deaths.10
Polysaccharides from plants have been shown to have potential anti-diabetic effects. Hypolipidemic and hypoglycemic effects of polysaccharides from Rosa roxburghii fruit have been reported in type 2 diabetic mice.12 Mulberry polysaccharides have hypoglycemic and antioxidant effects on streptozotocin-induced diabetic mice.13 Ophiopogon polysaccharides can improve the impact of diabetes in mice by regulating the GLUT-4/PI3K/Akt signal pathway.14 The extraction of polysaccharides from guava leaves significantly lowered the level of blood glucose, and ameliorated liver and kidney injury in diabetic mice.15 Therefore, searching hypoglycemic polysaccharides from plants is important for identifying new therapeutic molecules.
Pueraria lobata (Willd.) Ohwi, the dry root of the leguminous plant Pueraria lobata, is commonly used in herbs and nutritional supplements.16 There are many reports that the extract of P. lobata has antidiabetic effects,17,18 immunomodulatory,19 hepatoprotective,18 nephropathy,20 and anti-tumor21 properties. The existing research of Pueraria lobata is mainly focused on the study of isoflavones.22 There are few studies on P. lobata polysaccharides and their use for the treatment of diabetes. The three polysaccharides extracted from P. lobata show inhibitory activity against reactive oxygen species and advanced glycation end products,23 but their structure and hypoglycemic mechanism are unclear. It has been shown that the polysaccharide PLP-1 extracted from P. lobata has a hypoglycemic effect in vitro.24 In our laboratory's early stages of research, the crude polysaccharide PL70-1 was extracted and separated from P. lobata by hot water extraction and ethanol precipitation method, and the polysaccharide PL70-1-1 was then purified by column chromatography, and proved that they have a hypoglycemic effect.25
The isolation and identification of polysaccharides from P. lobata and the explanation of its biological activity need to be further studied. Herein, two new polysaccharides (PLB-1-1 and PLB-1-2) were isolated from P. lobata via hot water extraction, anion exchange column, i.e., DEAE-cellulose 52 (DEAE-52), and a gel filtration (GF) column, i.e., Sephacryl S-100. The structural analysis was performed by GC-MS, NMR, monosaccharide component analysis, and FT-IR. In this study, the in vitro inhibitory potential of the underlined polysaccharides has also been evaluated against α-amylase, α-glucosidase and LPS-stimulated inflammation.
2. Materials and methods
2.1. Materials and chemicals
The dry root of the P. lobata (Willd.) Ohwi were acquired from Guangzhou Zhixin Chinese Herbal Pieces Co., Ltd., and it was authenticated by Professor Hongyan Ma, Professor of Guangdong Pharmaceutical University. DEAE-52 and Sephacryl S-100 were acquired from GE Healthcare Life Sciences. α-Glucosidase was procured from Sigma Chemical Co. (USA). Hydrated acarbose, alpha-amylase, and 4-nitrophenyl-α-D-glucopyranoside (PNPG) were procured from Aladdin Industries.2.2. Extraction of crude polysaccharide
For 12 h, P. lobata decoction pieces (30 kg) were submerged in deionized H2O (w/v 1![[thin space (1/6-em)]](https://www.rsc.org/images/entities/char_2009.gif) :
:![[thin space (1/6-em)]](https://www.rsc.org/images/entities/char_2009.gif) 10), as depicted in Fig. 1. Next, the extraction of the underlined pieces was carried out with deionized H2O (three times) for three h (at 85 °C), followed by filtration with gauze to collect the dregs and the filtrate. The separated filter residue was soaked and extracted with NaOH solution (0.3 M, w/v 1
10), as depicted in Fig. 1. Next, the extraction of the underlined pieces was carried out with deionized H2O (three times) for three h (at 85 °C), followed by filtration with gauze to collect the dregs and the filtrate. The separated filter residue was soaked and extracted with NaOH solution (0.3 M, w/v 1![[thin space (1/6-em)]](https://www.rsc.org/images/entities/char_2009.gif) :
:![[thin space (1/6-em)]](https://www.rsc.org/images/entities/char_2009.gif) 10) for 3 hours (for 3 times), followed by filtering with gauze, then the filtrates were combined, and dilute HCl (0.5 M) was added with stirring to neutralize until the filtrate was neutral. Under reduced pressure, the filtrate was concentrated. Centrifugation (1919×g) was carried out for 15 min to remove small impurities, followed by ethanol precipitation. After 24 h, the collection of precipitates was carried out, and then the crude alkali polysaccharide was extracted from P. lobata. An appropriate amount of alkali crude polysaccharide was dissolved in deionized H2O (2 L), and then added with Sevag reagent (400 mL, v/v 5
10) for 3 hours (for 3 times), followed by filtering with gauze, then the filtrates were combined, and dilute HCl (0.5 M) was added with stirring to neutralize until the filtrate was neutral. Under reduced pressure, the filtrate was concentrated. Centrifugation (1919×g) was carried out for 15 min to remove small impurities, followed by ethanol precipitation. After 24 h, the collection of precipitates was carried out, and then the crude alkali polysaccharide was extracted from P. lobata. An appropriate amount of alkali crude polysaccharide was dissolved in deionized H2O (2 L), and then added with Sevag reagent (400 mL, v/v 5![[thin space (1/6-em)]](https://www.rsc.org/images/entities/char_2009.gif) :
:![[thin space (1/6-em)]](https://www.rsc.org/images/entities/char_2009.gif) 1), and shaken vigorously. Next, centrifugation (1919×g) was performed for the removal of the protein layer. The underlined process was repeated six times. Under reduced pressure, the solution was concentrated, and then put into a bag of dialysis with a cut-off of the molecular weight of around 1000 Da and dialyzed in running tap water for 2 days. The solution of dialysis was concentrated under diminished pressure and lyophilized to achieve an alkali crude PLB.
1), and shaken vigorously. Next, centrifugation (1919×g) was performed for the removal of the protein layer. The underlined process was repeated six times. Under reduced pressure, the solution was concentrated, and then put into a bag of dialysis with a cut-off of the molecular weight of around 1000 Da and dialyzed in running tap water for 2 days. The solution of dialysis was concentrated under diminished pressure and lyophilized to achieve an alkali crude PLB.
 | ||
| Fig. 1 Flowchart for the extraction and fractionation of polysaccharides from the root of Pueraria lobata. | ||
2.3. Crude polysaccharide's isolation and purification
PLB was isolated and purified according to the previously published methods with slight variations.26 First, 25 mg PLB sample was dissolved in 10 mL deionized water. Centrifugation (10![[thin space (1/6-em)]](https://www.rsc.org/images/entities/char_2009.gif) 062×g) was then carried out after 12 min. The supernatant was loaded into a column DEAE-52 (ϕ 2.5 × 45 cm), eluted with NaCl (0.05 M), followed by collecting the eluent via automatic collector (the rate of flow of about 1.3 mL min−1). Then, the sulfuric acid–phenol approach was employed to examine the fraction comprising carbohydrate to obtain an elution curve.27 Based on the elution curve, the main components in the eluate were obtained and dialyzed to improve the purity. Next, the underlined components were freeze-dried to obtain two polysaccharides (PLB-1 and PLB-2). The collected PLB-1 was applied to Sephacryl S-100 (ϕ 1.5 × 100 cm) for further purification and eluted with deionized H2O. After collecting the eluate, it was lyophilized to achieve polysaccharides PLB-1-1 and PLB-1-2.
062×g) was then carried out after 12 min. The supernatant was loaded into a column DEAE-52 (ϕ 2.5 × 45 cm), eluted with NaCl (0.05 M), followed by collecting the eluent via automatic collector (the rate of flow of about 1.3 mL min−1). Then, the sulfuric acid–phenol approach was employed to examine the fraction comprising carbohydrate to obtain an elution curve.27 Based on the elution curve, the main components in the eluate were obtained and dialyzed to improve the purity. Next, the underlined components were freeze-dried to obtain two polysaccharides (PLB-1 and PLB-2). The collected PLB-1 was applied to Sephacryl S-100 (ϕ 1.5 × 100 cm) for further purification and eluted with deionized H2O. After collecting the eluate, it was lyophilized to achieve polysaccharides PLB-1-1 and PLB-1-2.
2.4. Evaluation of the molecular weight and homogeneity
AG-3000PWXL gel and HPGPC TSK-gel G-5000PWXL columns (Tosoh BioSep, Japan) were employed to evaluate the PLB-1-1 and PLB-1-2 homogeneity and its molecular weight. PLB-1-1 and PLB-1-2 were then subjected to a Waters 2414 detector of the refractive index (Massachusetts), and the utilized eluents were potassium dihydrogen phosphate solutions (0.02 M) with a rate of flow of about 0.5 mL min−1. The calibration of the column was accomplished with various molecular weight dextran T series standards (Dextran T1000, T500, T70, T40, T10, and T5). During the experiment, the constant temperature of the column was 35 °C. The molecular weights of PLB-1-1 and PLB-1-2 were estimated with reference to the obtained curve of calibration.2.5. Analysis of monosaccharide compositions
The monosaccharide compositions of PLB-1-1 and PLB-1-2 were evaluated through HPLC and PMP precolumn derivatization method analysis. PLB-1-1 and PLB-1-2 (4 mg) were added to 3 M trifluoroacetic acid (2 mL, TFA), respectively, hydrolyzed at 120 °C for 6 h, cooled to room temperature, dissolved with methanol, and concentrated under reduced pressure, for three cycles. A volume of 1 mL double-distilled water was added to dissolve the pellet, centrifuge the solution, and take 100 μL of the supernatant. After adding 100 μL NaOH solution (0.3 M) and 100 μL PMP (0.5 M) to react for 0.5 hours (at 70 °C), to neutralize the solution, the addition of 105 μL of HCl solution (0.3 M) was added to neutralize the solution.And then the solution was mixed with an equal volume of chloroform, centrifuged after shaking, and the chloroform was removed. The HPLC test sample was obtained after being repeated three times. Agilent ZORBAX Eclipse XDB-C18 column (5 μm, 4.6 mm × 250 mm), Agilent 1260 system, and UV absorption detector (250 nm) constitute the HPLC system. The mobile phase was acetonitrile (83![[thin space (1/6-em)]](https://www.rsc.org/images/entities/char_2009.gif) :
:![[thin space (1/6-em)]](https://www.rsc.org/images/entities/char_2009.gif) 17 v/v) and phosphate buffer (0.05 M, pH 6.8) with a rate of flow of about 1 mL min−1. The standard and sample were determined successively, and the injection volume was 10 μL.
17 v/v) and phosphate buffer (0.05 M, pH 6.8) with a rate of flow of about 1 mL min−1. The standard and sample were determined successively, and the injection volume was 10 μL.
2.6. FT-IR spectra analysis
PLB-1-1 and PLB-1-2 (2 mg) and KBr (200 mg) were uniformly blended, and the mixture was thoroughly grounded and mixed to prepare a sample. The prepared sample sheets were placed in a Fourier infrared spectrophotometer, and an absorption spectrum of 4000 cm−1 to 400 cm−1 was recorded on a PerkinElmer FT-IR spectrometer.282.7. Analysis of methylation
Methylation of PLB-1-1 and PLB-1-2 was performed according to the earlier reported protocol with some variations.26 Determination of complete methylation was executed by detecting the disappearance of the hydroxyl band (3200–3700 cm−1) in the methylation product by IR spectroscopy. The methylated sample was placed in a hydrolysis tube and reacted with 3 M trifluoroacetic acid at 120 °C for 6 h. After dissolving with methanol, the methylated sample was decompressed and concentrated to dry five times. The hydrolysate was reduced by 30 min with NaBH4 at 40 °C. The reaction was terminated by adding glacial acetic acid, dissolved with methanol, concentrated under reduced pressure and dried five times. The sample was acetylated with the same amount of pyridine and acetic anhydride at 95 °C for 2 h, dissolved with methanol, decompressed and concentrated to dry, and the process was repeated five times. Finally, 1 mL chloroform was added and washed with double-distilled water three times. Then, the chloroform layer was taken for GC-MS analysis. Partially methylated aldol acetate was evaluated via GC-MS-QP 2010 (Shimadzu, Japan).2.8. Analysis of NMR spectroscopy
The NMR spectral evaluation of PLB-1-1 and PLB-1-2 was carried out based on a previously reported protocol with some variations, followed by dissolving PLB-1-1 and PLB-1-2 (60 mg) in D2O (0.7 mL) and then transferred to a tube of NMR. The NMR spectrometer (Bruker A V-500, Germany) was employed to record the 13C and 1H NMR spectral outcomes of PLB-1-1 and PLB-1-2 at 125 and 500 MHz, accordingly. The spectra of HMBC and HSQC for PLB-1-1 and PLB-1-2 were recorded using a standard Bruker program.2.9. SEM analysis
A suitable double-sided tape was placed on the sample table of the SEM (Philips XL-30, The Netherlands), and 1 mg of refined polysaccharides were evenly distributed on the tape by toothpicks. It was then subjected to a gold stamping operation to make it electrically conductive. Finally, the sample was observed under high vacuum conditions at an acceleration potential (10.0 kV) with magnifications of 800 and 6000 times to attain an SEM image of PLB-1-1 and PLB-1-2.292.10. Analysis of Congo red
An equal volume of PLB-1-1 or PLB-1-2 solution (1 mg mL−1) was blended with Congo red solution (100 μM), followed by adding a number of gradient concentrations of NaOH solutions (0.00–0.50 M). Ultraviolet scanning was performed in the 200–600 nm wavelength range to determine the maximum absorption wavelength of each sample solution. Herein, Congo red was used as a standard.252.11. α-Glucosidase inhibitory performance
To measure the α-glucosidase inhibitory performance, the method reported in the literature was used and slightly modified.30 First, α-glucosidase (20 μL, 0.2 U mL−1) and the sample solution (40 μL) were added into a plate containing 96 wells, followed by incubation for 5 min (at 37 °C), then 50 μL (10 mM) pNPG solution (substrate) was added and incubation continued at 37 °C for 0.5 h, followed by terminating the reaction via Na2CO3 solution (90 μL). A microplate reader was employed to record the absorbance at 405 nm. Acarbose was used as a positive drug. The given calculations were used to determine the inhibitory potency of isolated compounds against α-glucosidase catalytic activity:| Percentage of inhibition (%) = [1 − (As − Ab)/A0] × 100% |
2.12. α-Amylase inhibitory performance
To evaluate the α-amylase inhibitory performance, the method reported in the literature was used and slightly modified.31 Briefly, α-amylase solution (25 μL, 0.2 mg mL−1) and a solution of the sample (25 μL) were added into a plate containing 96 wells, succeeded by incubation for 10 min (at 37 °C). Next, the solution of soluble starch (25 μL, 2 mg mL−1) was increased and then incubation was done for 10 min (at 37 °C), followed by adding 125 μL of DNS reagent (1% DNS dissolved in 1.6% of NaOH). The reaction mixture was heated in hot water (100 °C) for 5 min and 30% sodium potassium tartrate was increased, then cooled at 25 °C and the absorbance was evaluated at 540 nm. Acarbose was implemented as a positive drug. The given formula was used to determine the inhibitory potency of isolated compounds against α-amylase catalytic activity:| Percentage of inhibition (%) = [1 − (As − Ab)/A0] × 100% |
2.13. Cells and treatment
RAW264.7 and BV2 were obtained from the Cell Center of Basic Medicine, Union Medical University, Chinese Hospital. RAW264.7 were cultured and preserved in DMEM (Gibco), supplemented with 10% FBS and 1% penicillin streptomycin (Gibco) at 37 °C with 5% CO2. BV2 were cultured and preserved in DMEM/F12 (Gibco), with the other conditions remaining the same as RAW264.7. The control group, model group, indomethacin group, PLB-1-1 group, PLB-1-2 group, PL70-1-1 group, PL50-1-1 group, PL50-2-1 group, and PL50-2-2 group were established with 3 compound holes in each group. The culture medium of each group was replaced with lipopolysaccharide (LPS, Sigma) solution (1.0 μg mL−1) after 24 h of culture, and collected 50 μL cell supernatant. Nitric oxide content was measured by nitric oxide kit (Beyotime, China). The inhibition rate was calculated as follows:| Percentage of NO inhibition rate (%) = (A3 − A2)/(A3 − A1) × 100% |
3. Results and discussion
3.1. Extraction and purification of PLB-1-1 and PLB-1-2
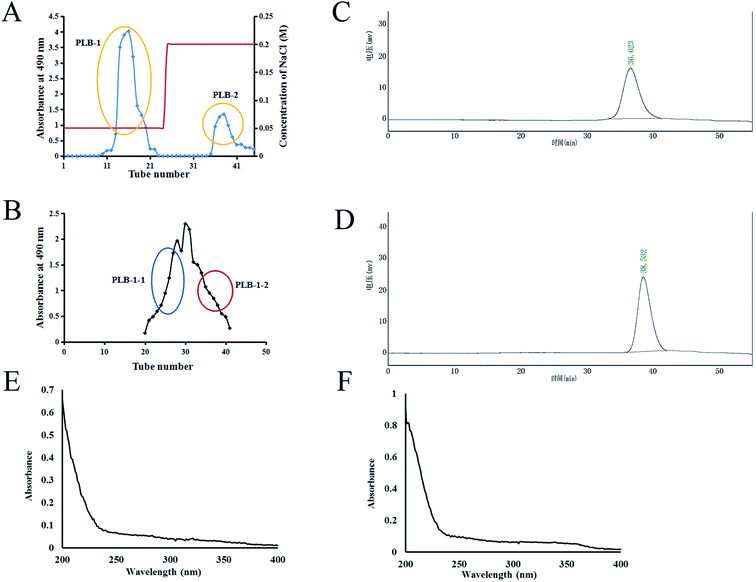
The hot water extraction strategy was used to obtain crude PLB from P. lobata, followed by precipitation using ethanol. The sugar content of crude polysaccharide PLB was 13.4% by the phenol–sulfuric acid method. The protein was removed, dialyzed, lyophilized, loaded into a DEAE-52 column, and then eluted by utilizing NaCl solution. As shown in Fig. 2A, two components, PLB-1 and PLB-2, were found. Further purification of PLB-1 was carried out on a column of Sephacryl S-100 to attain two polysaccharides (PLB-1-1 and PLB-1-2) (Fig. 2B). As shown in Fig. 2C and D, HPGPC was employed to identify the purity and molecular weight of PLB-1-1 and PLB-1-2. The obtained results showed a single symmetric, narrow peak, which suggested a single PLB-1-1 and PLB-1-2 as homogeneous polysaccharides. The PLB-1-1 average molecular weight was found to be 9.1 × 10³ Da, and the PLB-1-2 average molecular weight was found to be 3.8 × 10³ Da. Moreover, the UV scanning spectrum of PLB-1-1 and PLB-1-2 revealed no absorption peak at 280 and 260 nm, suggesting that the proteins and nucleic acids were eliminated from the PLB-1-1 and PLB-1-2 samples, as depicted in Fig. 2E and F.3.2. FT-IR spectrum analysis and the composition of monosaccharide for PLB-1-1 and PLB-1-2
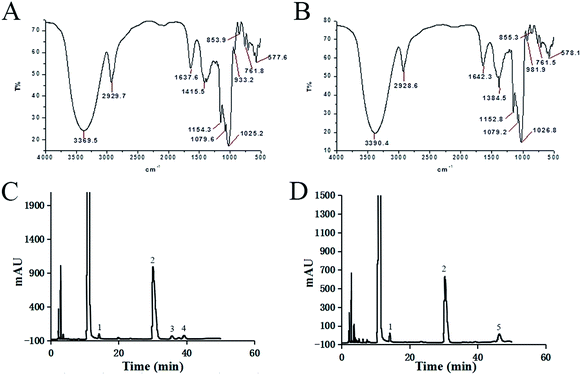
The spectrum of FT-IR for PLB-1-1 can be observed in Fig. 3A. The peak caused by the strong stretching vibration of O–H was observed at 3369.5 cm−1.32 The band at 2929.7 cm−1 was ascribed to the C–H stretching vibration. The peak at 1415.5 cm−1 is caused by the C–H stretching vibration.33,34 The signals at 1154.3, 1079.6, and 1025.2 cm−1 indicate that PLB-1-1 has a pyranose structure.35–37 Similarly, in Fig. 3B, it is observed that PLB-1-2 has a strong hydroxyl stretching vibration peak at 3390.4 cm−1, a methylene hydrocarbon stretching vibration peak at 2928.6 cm, a hydroxyl bending vibration absorption peak at 1642.3 cm−1, and a methylene hydrocarbon bending stretching vibration peak at 1384.5 cm−1, which are the representative peaks of a polysaccharide structure.33,34 In addition, the absorption peak at 1152.8 and 1079.2 at 1026.8 cm−1 indicates that the polysaccharide has a pyranose structure.35–37The monosaccharide content of PLB-1-1 was evaluated using 1-phenyl-3-methyl-5-pyrazolone (PMP) precolumn derivatization technique, along with HPLC, as depicted in Fig. 3C. The obtained results revealed that PLB-1-1 was found to have a considerable amount of glucose and a tiny amount of mannose, galactose, and arabinose, according to the findings. PLB-1-2 comprised a significant amount of glucose and a little amount of mannose and fucose, as indicated in Fig. 3D. PLB-1-1 and PLB-1-2 are hence known as hetero-polysaccharides.
3.3. Methylation analysis of PLB-1-1 and PLB-1-2
After complete methylation, acid hydrolysis, reduction, and acetylation of PLB-1-1, the GC-MS results were combined with the database to analyze the sugar residues types. The outcomes of GC-MS illustrated that PLB-1-1 consists of six acetylated sugar alcohols: 1,4,5-tri-O-acetyl-2,3,6-tri-O-methyl-D-glucitol, 1,5-di-O-acetyl-2,3,4,6-tetra-O-methyl-D-glucitol, 1,5,6-tri-O-acetyl-2,3,4-tri-O-methyl-D-galactitol, 1,3,4-tri-O-acetyl-2,5-di-O-methyl-L-arabinitol, 1,3,5,6-tetra-O-acetyl-2,4-di-O-methyl-D-mannitol, and 1,4,5,6-tetra-O-acetyl-2,3-di-O-methyl-D-mannitol, as depicted in Table 1. GC-MS data indicated that PLB-1-1 contained →4)-D-Glcp-(1→, D-Glcp-(1→, →6)-D-Galp-(1→, →3)-L-Araf-(1→, →3,6)-D-Manp-(1→ and →4,6)-D-Manp-(1→ composition.38,39| PMAA | Molar ratios | Mass fragments (m/z) | Linkage |
|---|---|---|---|
| 1,4,5-tri-O-acetyl-2,3,6-tri-O-methyl-D-glucitol | 26.8 | 69, 85, 87, 101, 113, 117, 129, 161, 203, 233 | →4)-D-Glcp-(1→ |
| 1,5-di-O-acetyl-2,3,4,6-tetra-O-methyl-D-glucitol | 10.7 | 71, 87, 101, 117, 129, 145, 161, 205 | D-Glcp-(1→ |
| 1,5,6-tri-O-acetyl-2,3,4-tri-O-methyl-D-galactitol | 3.4 | 71, 87, 99, 101, 117, 129, 143, 159, 189, 233 | →6)-D-Galp-(1→ |
| 1,3,4-tri-O-acetyl-2,5-di-O-methyl-L-arabinitol | 7.1 | 71, 87, 99, 117, 129, 145, 159, 202 | →3)-L-Araf-(1→ |
| 1,3,5,6-tetra-O-acetyl-2,4-di-O-methyl-D-mannitol | 2.3 | 71, 87, 101, 117, 129, 139, 159, 173, 189, 203, 233, 245 | →3,6)-D-Manp-(1→ |
| 1,4,5,6-tetra-O-acetyl-2,3-di-O-methyl-D-mannitol | 4.8 | 74, 87, 99, 101, 117, 127, 141, 159, 162, 188, 201, 261 | →4,6)-D-Manp-(1→ |
As the same, the GC-MS data indicated that PLB-1-2 comprised →4)-D-Glcp-(1→, D-Glcp-(1→, →4,6)-D-Glcp-(1→, →3,6)-D-Manp-(1→ and L-Fucp-(1→ composition, as shown in Table 2.38,39
| PMAA | Molar ratios | Mass fragments (m/z) | Linkage |
|---|---|---|---|
| 1,4,5-tri-O-acetyl-2,3,6-tri-O-methyl-D-glucitol | 12.3 | 69, 85, 87, 101, 113, 117, 129, 161, 203, 233 | →4)-D-Glcp-(1→ |
| 1,5-di-O-acetyl-2,3,4,6-tetra-O-methyl-D-glucitol | 4.5 | 71, 87, 101, 117, 129, 145, 161, 205 | D-Glcp-(1→ |
| 1,4,5,6-tetra-O-acetyl-2,3-di-O-methyl-D-glucitol | 2.8 | 71, 99, 101, 117, 129, 159, 201, 231, 261 | →4,6)-D-Glcp-(1→ |
| 1,3,5,6-tetra-O-acetyl-2,4-di-O-methyl-D-mannitol | 0.8 | 71, 87, 101, 117, 129, 139, 159, 173, 189, 203, 233, 245 | →3,6)-D-Manp-(1→ |
| 1,5-di-O-acetyl-6-deoxy-2,3,4-tri-O-methyl-L-galactitol | 2.5 | 71, 87, 101, 115, 117, 131, 143, 161, 175 | L-Fucp-(1→ |
3.4. Analysis of PLB-1-1 and PLB-1-2 by NMR
Furthermore, the structures of PLB-1-1 and PLB-1-2 were surveyed through NMR spectral data. Its 13C, 1H, HSQC, and HMBC spectral data have been indicated in Fig. 4. Six anomeric proton signals (5.31, 5.17, 4.95, 4.89, 4.45, and 4.40 ppm) appeared in the 1H spectrum (Fig. 4A). It identified six anomeric carbon signals (109.3, 103.2, 101.6, 100.1, 99.7 and 98.6 ppm) in the 13C spectrum (Fig. 4B) and HSQC spectrum (Fig. 4C) of PLB-1-1. The underlined signals correspond to six kinds of the residue of PLB-1-1 (A, B, D, E, F, and G), and demonstrated consistency with the results obtained from GC-MS. Five anomeric proton signals (5.32, 5.15, 4.95, 4.89, and 4.58 ppm) are shown in the 1H spectrum (Fig. 5A). It identified five anomeric carbon signals (99.7, 99.5, 98.6, 98.5, and 95.8 ppm) in the 13C spectrum (Fig. 5B) and HSQC spectrum (Fig. 5C) of PLB-1-2. The underlined signals corresponded to five types of PLB-1-2 residue (A, B, D, E, and F), which showed consistency with the data obtained from GC-MS.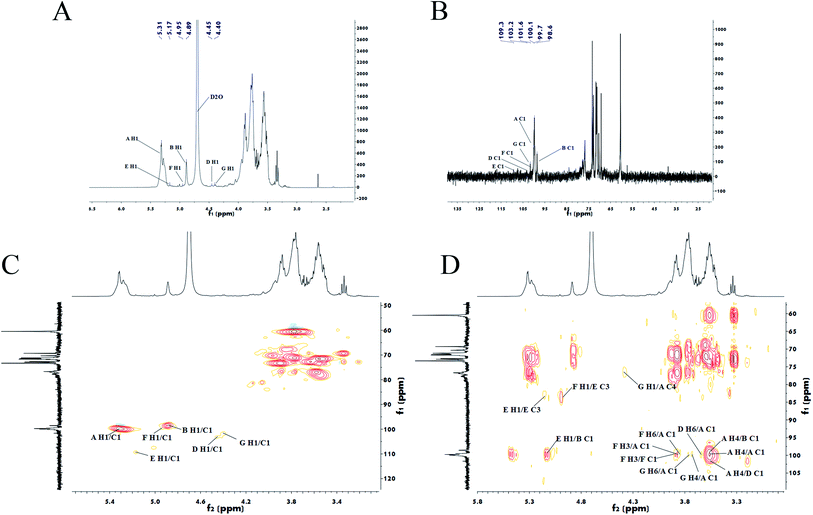 | ||
| Fig. 4 Nuclear magnetic spectrum analysis of PLB-1-1. 1H (A), 13C (B), HSQC (C) and HMBC (D) spectra of PLB-1-1. | ||
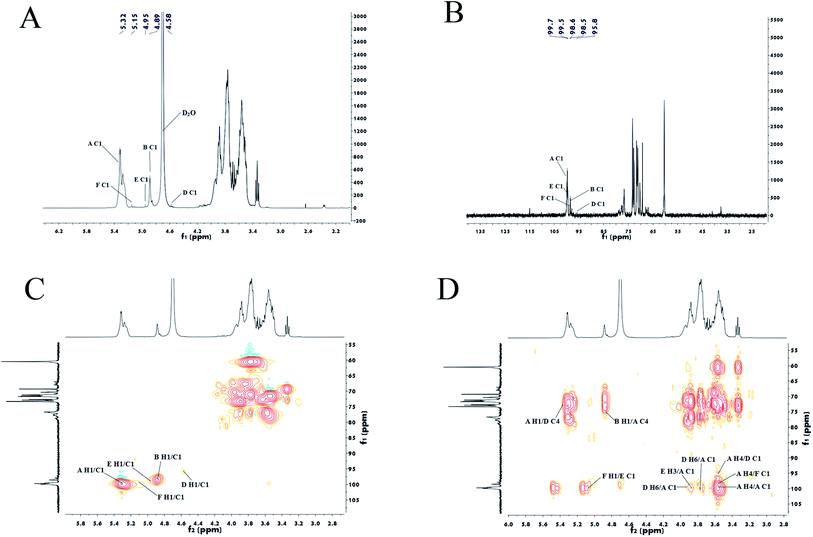 | ||
| Fig. 5 Nuclear magnetic spectrum analysis of PLB-1-2. 1H (A), 13C (B), HSQC (C) and HMBC (D) spectra of PLB-1-2. | ||
Grouping signals of proton and carbon for residues A, B, D, E, F, and G were performed by NMR spectral evaluation, GC-MS results for PLB-1-1, and a reported document.40,41 To determine the α/β configuration, it is necessary to look at the coupling constants and chemical shifts of the anomeric protons.42 Within the spectrum of HSQC, the anomeric signals at 99.7/5.31 ppm, 98.6/4.89 ppm, 103.2/4.45 ppm, 109.3/5.17 ppm, 100.1/4.95 ppm, and 101.6/4.40 ppm correspond to residues A, B, D, E, F, and G, accordingly. These residues belong to 1,4-linked α-D-Glcp, terminal β-D-Glcp, 1,6-linked β-D-Galp, 1,3-linked α-L-Araf, 1,3,6-linked β-D-Manp, and 1,4,6-linked β-D-Manp, accordingly. In addition, the adjacent hydrogen and carbon signal information for each residue was obtained from the HMBC spectrum, as depicted in Fig. 4D. The carbon and hydrogen data of PLB-1-1 are shown in Table 3.
| Residue | H1/C1 | H2/C2 | H3/C3 | H4/C4 | H5/C5 | H6/C6 |
|---|---|---|---|---|---|---|
| a Note: — means not determined. | ||||||
| →4)-α-D-Glcp-(1→ | 5.31 | 3.55 | 3.89 | 3.58 | 3.63 | 3.78 |
| A | 99.7 | 71.6 | 73.3 | 77.0 | 72.8 | 60.5 |
| α-D-Glcp-(1→ | 4.89 | 3.89 | 3.77 | 3.96 | 3.55 | 3.78 |
| B | 98.6 | 73.3 | 76.8 | 70.3 | 71.6 | 60.5 |
| →6)-β-D-Galp-(1→ | 4.45 | 3.58 | 3.77 | 3.96 | 3.67 | 3.65 |
| D | 103.2 | 73.5 | 71.2 | 70.3 | 80.1 | 69.3 |
| →3)-α-L-Araf-(1→ | 5.17 | 4.14 | 3.86 | 4.01 | 3.62 | |
| E | 109.3 | 81.4 | 83.6 | 84.0 | 62.8 | |
| →3,6)-β-D-Manp-(1→ | 4.94 | 4.10 | 3.89 | 3.77 | 3.53 | 3.84 |
| F | 100.1 | 69.4 | 76.6 | — | — | 68.9 |
| →4,6)-β-D-Manp-(1→ | 4.40 | 3.21 | 3.48 | 3.69 | 3.34 | 3.77 |
| G | 101.6 | 72.8 | 73.9 | 76.3 | 76.0 | 62.7 |
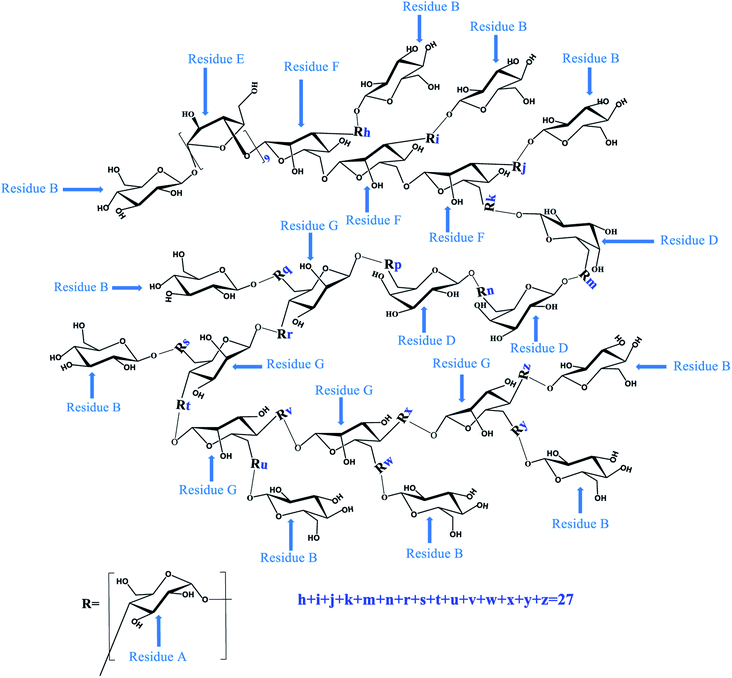
To determine the linkage site between residues, the spectrum of HMBC for PLB-1-1 was evaluated. In the HMBC spectrum (Fig. 4D), the correlation peak of 3.58/99.7 ppm (A H4/A C1) showed the linkage between O-4 and C-1 of the residue A, and also revealed a duplicate 1,4-linked α-D-Glcp unit in PLB-1-1. The signal at 3.89/99.7 ppm (F H3/A C1) suggested a link between O-3 (residue F) and C-1 (residue A). The signal at 3.69/99.7 ppm (G H4/A C1) indicated that O-4 (residue G) was connected to C-1 (residue A). The signal at 3.77/99.7 ppm (G H6/A C1) revealed a linkage between O-6 (residue G) and C-1 (residue A). The signal at 3.65/99.7 ppm (D H6/A C1) exhibited the linkage of O-6 (residue D) with C-1 (residue A). The signal at 3.84/99.7 ppm (F H6/A C1) suggested a linkage between O-6 (residue F) and C-1 (residue A). The correlation peak 4.40/77.0 ppm (G H1/A C4) indicated that O-1 of the residue G was linked to C-1 of residue A. The correlation peak 3.58/98.6 ppm (A H4/B C1) showed a link between O-4 (residue A) and C-1 (residue B). The correlation peak 5.17/98.6 ppm (E H1/B C1) suggested a link between O-1 (residue E) and C-1 (residue B). The correlation peak 3.58/103.2 ppm (A H4/D C1) indicated a link between O-4 (residue A) and C-1 (residue D). The correlation peak 4.94/83.6 ppm (F H1/E C3) showed a link between O-1 (residue F) and C-3 (residue E). The relation peak of 5.17/83.6 ppm (E H1/E C3) proposed a linkage between O-1 and C-3 of the residue E, and indicated a duplicate 1,3-linked α-L-Araf unit. The correlation peak 3.89/100.1 ppm (F H3/F C1) revealed the linkage between O-3 and C-1 of residue F, representing the existence of repeating 1,3,6-linked β-D-Manp structure in PLB-1-1. The possible structure of PLB-1-1 is shown in Fig. 6.
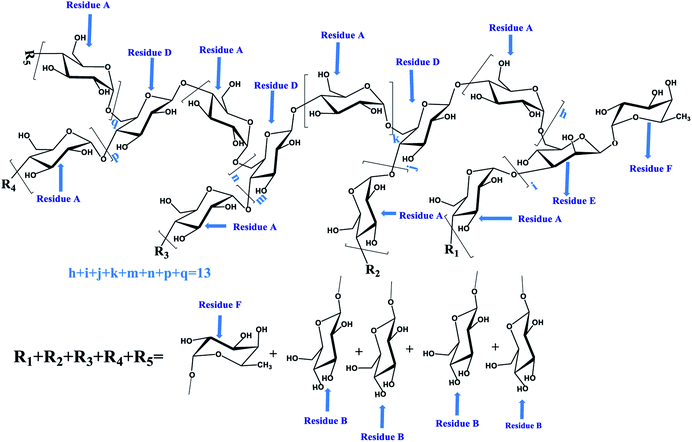
Similarly, according to the HMBC spectrum of PLB-1-2 (Fig. 5D), combined with the above method, the hydrocarbon attribution of PLB-1-2 was deduced, as shown in Table 4. The possible structure of PLB-1-2 is shown in Fig. 7. One of the five terminal residues (R1, R2, R3, R4, R5) is residue F, and the rest are residue B.
| Residue | H1/C1 | H2/C2 | H3/C3 | H4/C4 | H5/C5 | H6/C6 |
|---|---|---|---|---|---|---|
| a Note: — means not determined. | ||||||
| →4)-α-D-Glcp-(1→ | 5.32 | 3.54 | 3.90 | 3.58 | 3.63 | 3.77 |
| A | 99.7 | 71.6 | 73.3 | 77.0 | 72.7 | 60.5 |
| β-D-Glcp-(1→ | 4.89 | 3.90 | 3.77 | 3.96 | 3.77 | 3.77 |
| B | 98.5 | 73.3 | 76.8 | 70.3 | 71.1 | 60.5 |
| →4,6)-β-D-Glcp-(1→ | 4.58 | 3.20 | 3.65 | 3.98 | 3.33 | 3.77 |
| D | 95.8 | 73.7 | 76.5 | 73.3 | 72.6 | 63.3 |
| →3,6)-β-D-Manp-(1→ | 4.95 | 3.97 | 3.89 | 3.77 | 3.52 | 3.94 |
| E | 99.5 | — | 76.5 | 73.7 | 73.5 | 67.2 |
| α-L-Fucp-(1→ | 5.15 | 4.10 | 3.77 | 3.89 | 4.05 | 1.22 |
| F | 98.6 | — | 71.1 | — | 69.4 | 16.9 |
3.5. Analysis of PLB-1-1 and PLB-1-2 by Congo red and SEM assay
The morphology of PLB-1-1 and PLB-1-2 under different multiples was observed by scanning electron microscope. As shown in Fig. 8A–D, PLB-1-1 was in the shape of large fragments, and the surface of the fragments was rough. PLB-1-2 was in the shape of small fragments, and the surface of the fragments was smooth. As shown in Fig. 8E, the assessment of congo red found that PLB-1-1 and PLB-1-2 did not have a redshift, indicating that they did not have a triple helix structure.43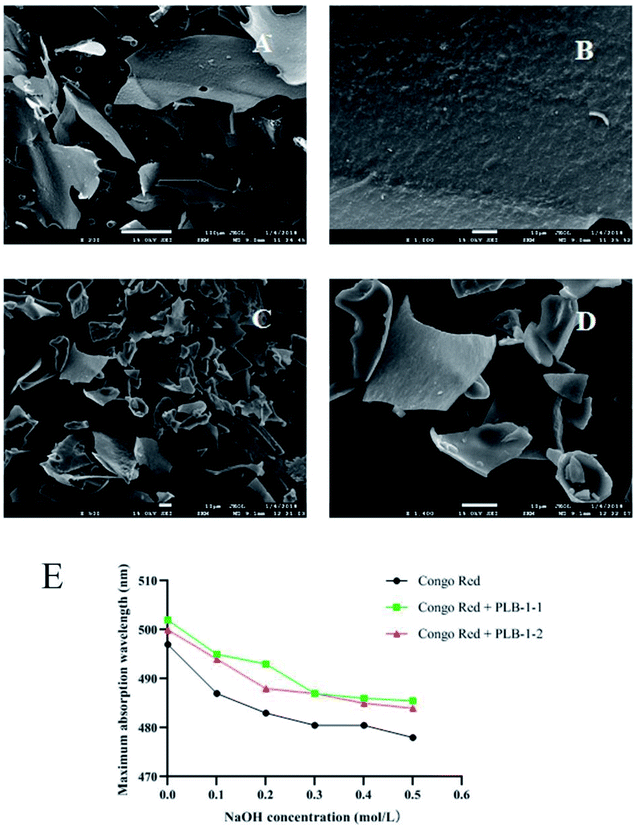 | ||
| Fig. 8 Result of SEM images and congo red of PLB-1-1 and PLB-1-2. SEM images of PLB-1-1 (A: 200×, B: 1000×) and PLB-1-2 (C: 500×, D: 1400×). E: Congo red assay of PLB-1-1 and PLB-1-2. | ||
3.6. The potential hypoglycemic effects of PLB, PLB-1-1 and PLB-1-2
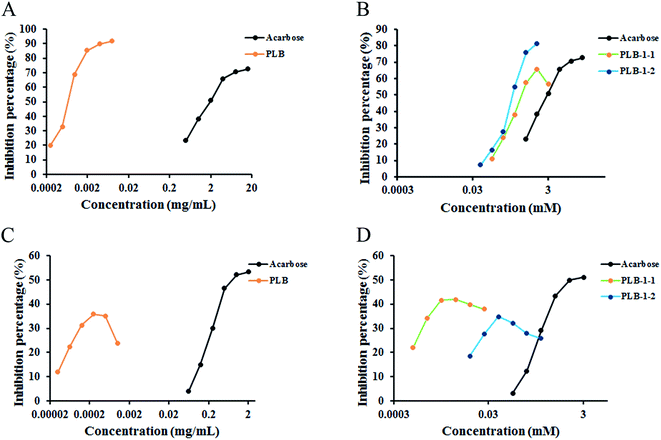
Diabetes is a chronic disease with an elevated blood glucose level,44,45 and α-glucosidase and α-amylase considerably contribute to regulating the blood glucose level in the human body. These are vital enzymes contributing to the treatment of diabetes and inhibit postprandial hyperglycemia by inhibiting carbohydrolases.46 To further study the hypoglycemic effect of PLB, PLB-1-1, and PLB-1-2, we acted on α-glucosidase with PLB, PLB-1-1, and PLB-1-2. The experimental results are indicated in Fig. 9A and B. The IC50 value of the crude polysaccharide PLB was 0.683 μg mL−1. The IC50 of acarbose was 2.204 mg mL−1 (3.414 mM). For refined polysaccharides, the IC50 values of PLB-1-1 and PLB-1-2 were 0.671 mM and 0.399 mM, accordingly. It showed that PLB, PLB-1-1, and PLB-1-2 all had good α-glucosidase inhibitory activity. PLB crude polysaccharides had a strong effect of inhibition on α-glucosidase, and the inhibitory effect of PLB-1-2 on α-glucosidase was more potent than that of PLB-1-1, indicating that PLB-1-2 crude polysaccharides may be the main component of PLB crude polysaccharides inhibiting α-glucosidase. Further study on the hypoglycemic effect of PLB-1-2 would be valuable.In addition, PLB, PLB-1-1, and PLB-1-2 acted on α-amylase (Fig. 9C and D), and the maximum inhibition rate was 35.81% when the concentration of crude polysaccharide PLB was 0.244 μg mL−1. The IC50 of acarbose was 1.061 mg mL−1 (1.643 mM). For seminal polysaccharides, the maximum inhibition rate was 41.95% when the concentration of PLB-1-1 was 0.0061 mM, and the maximum inhibition rate was 34.77% when the concentration of PLB-1-2 was 0.048 mM. The inhibitory effect of PLB crude polysaccharides on α-glycosidase was lower than that of acarbose. The inhibitory effect of PLB-1-1 on α-glycosidase was stronger than that of PLB-1-2, but not as strong as that of acarbose.
3.7. Inhibition of polysaccharides on NO production by LPS-stimulated RAW264.7 and BV2
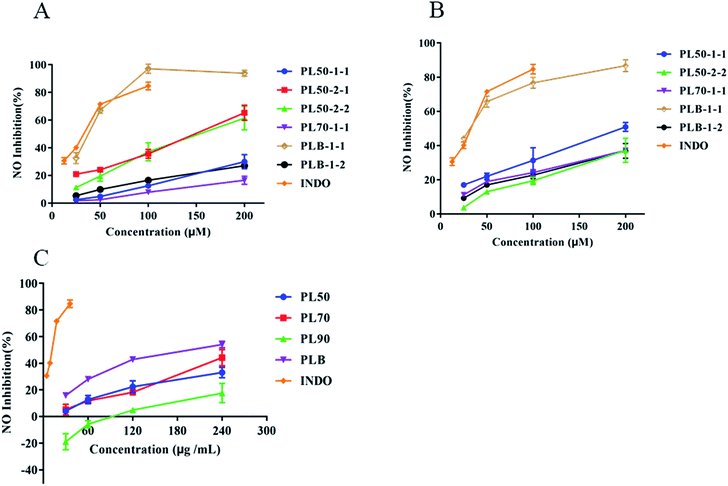
Lipopolysaccharide (LPS) stimulates RAW264.7 cells and BV2 cells to induce an inflammation model, which is extensively used to evaluate the anti-inflammatory effect of drugs.47–49 In the process of inflammation, bacterial products and proinflammatory cytokines induce the production of large amounts of nitric oxide (NO) through inducible nitric oxide synthase (iNOS), and compounds that inhibit NO production can be used as inflammatory regulators.50 Here, we compared the anti-inflammatory effects of polysaccharides isolated from P. lobate. In RAW264.7 (Fig. 10A) and BV2 (Fig. 10B) inflammatory models, the anti-inflammatory effect of PLB-1-1 was the strongest, with IC50 values of 34.47 μM and 29.50 μM, respectively. The IC50 of indomethacin with RAW264.7 and BV2 were 27.23 μM and 54.45 μM, respectively. PL70-1-1 was previously reported,25 and PL50-1-1, PL50-2-1 and PL50-2-2 were unpublished. Compared with crude polysaccharide (Fig. 10C), PLB crude polysaccharide had a stronger anti-inflammatory effect, and PLB-1-1 may be the main hypoglycemic component in the PLB crude polysaccharide. It can be seen that PLB-1-1 has excellent anti-inflammatory effect and can act on chronic low-grade inflammation. In addition, BV2 cells have good anti-inflammatory effects. The inflammation of BV2 cells is closely related to neurodegenerative diseases,51,52 and some complications of diabetic encephalopathy53 and peripheral neuropathy.54 It can be perceived that PLB-1-1 may become a leading compound for the treatment of diabetes and diabetic complications. It also provides a scientific explanation for P. lobate as a medicinal and edible natural plant for diabetes treatment.4. Conclusion
Herein, new polysaccharides PLB-1-1 and PLB-1-2 were isolated and purified from P. lobate. According to the obtained results, PLB-1-1 is a heteropolysaccharide containing a large amount of glucose and a small amount of mannose, galactose, and arabinose, while PLB-1-2 consists of a large amount of glucose and a small amount of mannose and fucose. In addition, the SEM images indicated that PLB-1-1 was massive and the surface of the fragments was rough, while PLB-1-2 was in the shape of small fragments, and the surface of the fragments was smooth. The Congo Red experimental results showed that both PLB-1-1 and PLB-1-2 had no triple helix structure. Moreover, PLB, PLB-1-1, and PLB-1-2 selectively inhibited α-amylase and α-glucosidase. PLB, PLB-1-1, and PLB-1-2 had an excellent inhibitory impact on α-glucosidase inhibitory activity, and had a different inhibitory effect on α-amylase. It can be seen that the polysaccharide PLB-1-2 isolated from P. lobate can be used as an inhibitor of α-glucosidase for treating T2D. More interestingly, PLB-1-1 showed superior anti-inflammatory effect in the LPS-induced inflammatory model, which could be applied to diabetic encephalopathy and peripheral neuropathy. In the existing studies, polysaccharides isolated from P. lobate with anti-inflammatory and hypoglycemic activities are very rare. Next, the anti-inflammatory and hypoglycemic effects of PLB-1-1 and hypoglycemic effects of PLB-1-2 should be further tested in vivo and in vitro to make it a first-line functional food or therapeutic drug for diabetes.Funding
This research is supported by the Projects of the National Natural Science Foundation of China (grant numbers 81773884, 81473413, 81274060, 82004086), the National Major Scientific and Technological Special Project for “Significant New Drugs Development” during the Thirteenth Five-year Plan Period (grant number 2017ZX09301077), and the Science and Technology Plan Project of Guangzhou (grant number 201803010115).Conflicts of interest
The authors declare no conflict of interest.Acknowledgements
This work was supported by Technology Funds obtained from the Key Unit of Chinese Medicine Digitalization Quality Evaluation of State Administration of Traditional Chinese Medicine.References
- N. H. Cho, J. E. Shaw, S. Karuranga, Y. Huang, J. D. da Rocha Fernandes, A. W. Ohlrogge and B. Malanda, Diabetes Res. Clin. Pract., 2018, 138, 271–281 CrossRef CAS PubMed.
- L. Chen, D. J. Magliano and P. Z. Zimmet, Nat. Rev. Endocrinol., 2011, 8, 228–236 CrossRef PubMed.
- J. B. Cole and J. C. Florez, Nat. Rev. Endocrinol., 2020, 16, 377–390 Search PubMed.
- J. Wu, S. Shi, H. Wang and S. Wang, Carbohydr. Polym., 2016, 144, 474–494 CrossRef CAS PubMed.
- Z. Gong, Y. Peng, J. Qiu, A. Cao, G. Wang and Z. Peng, Molecules, 2017, 22(9), 1555 CrossRef PubMed.
- Q. Ban, J. Cheng, X. Sun, Y. Jiang and M. Guo, Food Funct., 2020, 11, 7696–7706 RSC.
- P. Carter, L. J. Gray, J. Troughton, K. Khunti and M. J. Davies, BMJ, 2010, 341, c4229 CrossRef PubMed.
- E. Misawa, M. Tanaka, K. Nomaguchi, K. Nabeshima, M. Yamada, T. Toida and K. Iwatsuki, J. Agric. Food Chem., 2012, 60, 2799–2806 CrossRef CAS PubMed.
- M. C. Nwadiugwu, Front. Public Health, 2020, 8, 600427 CrossRef PubMed.
- R. Dapueto, J. Rodriguez-Duarte, G. Galliussi, A. Kamaid, M. Bresque, C. Batthyány, G. V. López and C. Escande, Redox Biol., 2021, 39, 101833 CrossRef CAS PubMed.
- C. M. Phillips, L. W. Chen, B. Heude, J. Y. Bernard, N. C. Harvey, L. Duijts, S. M. Mensink-Bout, K. Polanska, G. Mancano, M. Suderman, N. Shivappa and J. R. Hébert, Nutrients, 2019, 8(11), 1873 CrossRef PubMed.
- L. Wang, C. Li, Q. Huang and X. Fu, J. Agric. Food Chem., 2020, 68, 147–159 CrossRef CAS PubMed.
- C. Chen, Q. Huang, C. Li and X. Fu, Food Funct., 2017, 8, 2523–2535 RSC.
- L. Y. Wang, Y. Wang, D. S. Xu, K. F. Ruan, Y. Feng and S. Wang, J. Ethnopharmacol., 2012, 143, 347–354 CrossRef CAS PubMed.
- Y. Luo, B. Peng, W. Wei, X. Tian and Z. Wu, Molecules, 2019, 24(7), 1343 CrossRef PubMed.
- J. Prasain, K. Jones, M. Kirk, L. Wilson, M. Smith-Johnson, C. Weaver and S. Barnes, J. Agric. Food Chem., 2003, 51, 4213–4218 CrossRef CAS PubMed.
- S. Srivastava, H. Pandey, S. K. Singh and Y. B. Tripathi, BioSci. Trends, 2019, 13, 382–393 CrossRef CAS PubMed.
- H. Pandey, S. Srivastava and Y. B. Tripathi, bioRxiv, 2019, 671594, DOI:10.1101/671594.
- R. Bharti, B. Chopra, S. Raut and N. Khatri, Front. Pharmacol., 2020, 11, 582506 CrossRef CAS PubMed.
- Y. B. Tripathi, R. Shukla, N. Pandey, V. Pandey and M. Kumar, J. Diabetes, 2017, 9, 123–132 CrossRef CAS PubMed.
- A. A. Adedapo, O. A. Fagbohun, C. Dawurung, A. A. Oyagbemi, T. O. Omobowale and M. A. Yakubu, J. Complementary Integr. Med., 2017, 16(4) DOI:10.1515/jcim-2016-0119.
- S. Wang, S. Zhang, S. Wang, P. Gao and L. Dai, Biomed. Pharmacother., 2020, 131, 110734 CrossRef CAS PubMed.
- Z. B. Wang, B.-B. Chen, L. Luo and J.-K. Yan, J. Taiwan Inst. Chem. Eng., 2016, 67, 54–60 CrossRef CAS.
- K. Qian, T. Tan, H. Ouyang, S. L. Yang, W. F. Zhu, R. H. Liu, Q. Wen and Y. L. Feng, Food Funct., 2020, 11, 7104–7114 RSC.
- C. Xu, N. Qin, C. Yan and S. Wang, Food Funct., 2018, 9, 2644–2652 RSC.
- X. Wang, M. Zhang, D. Zhang, S. Wang and C. Yan, Carbohydr. Polym., 2017, 174, 48–56 CrossRef CAS PubMed.
- Y. Liu, C. Wang, J. Li, Y. Mei and Y. Liang, Nutrients, 2019, 11(2), 296 CrossRef CAS PubMed.
- X. D. Shi, S.-P. Nie, J.-Y. Yin, Z.-Q. Que, L.-J. Zhang and X.-J. Huang, Food Hydrocolloids, 2017, 73, 176–183 CrossRef CAS.
- X. Wang, M. Zhang, D. Zhang, S. Wang and C. Yan, Carbohydr. Polym., 2017, 174, 48–56 CrossRef CAS PubMed.
- U. Cakar, N. Grozdanic, A. Petrovic, B. Pejin, B. Nastasijevic, B. Markovic and B. Dordevic, Curr. Pharm. Biotechnol., 2017, 18, 1264–1272 CAS.
- S. Wu, M. Lai, J. Luo, J. Pan, L. M. Zhang and L. Yang, Int. J. Biol. Macromol., 2017, 94, 669–678 CrossRef CAS PubMed.
- J. Li, X. Ge, C. Cui, Y. Zhang, Y. Wang, X. Wang and Q. Sun, Int. J. Mol. Sci., 2018, 19(10), 3202 CrossRef PubMed.
- C. Chen, B. Zhang, Q. Huang, X. Fu and R. H. Liu, Ind. Crops Prod., 2017, 100, 1–11 CrossRef CAS.
- Q. Xiong, Y. Jiao, X. Zhao, X. Chen, Q. Zhang and C. Jiang, Carbohydr. Polym., 2013, 98(1), 217–223 CrossRef CAS PubMed.
- J. K. Yan, Y.-Y. Wang, H.-L. Ma, Z.-B. Wang and J.-J. Pei, J. Taiwan Inst. Chem. Eng., 2016, 65, 110–117 CrossRef CAS.
- P. Yi, N. Li, J.-B. Wan, D. Zhang, M. Li and C. Yan, Carbohydr. Polym., 2015, 121, 183–189 CrossRef CAS PubMed.
- L. Zhao, T. Chen, D. Feng, T. Xiao, Z. Dang, S. Feng and Y. Xia, J. Asian Nat. Prod. Res., 2014, 16, 677–684 CrossRef CAS PubMed.
- L. G. Zhao, T. Q. Chen, D. M. Feng, T. G. Xiao, Z. L. Dang, S. L. Feng and Y. Y. Xia, J. Asian Nat. Prod. Res., 2014, 16, 677–684 CrossRef CAS PubMed.
- I. B. Jeff, S. Li, X. Peng, R. M. Kassim, B. Liu and Y. Zhou, Fitoterapia, 2013, 84, 338–346 CrossRef CAS PubMed.
- T. Zhao, G. Mao, W. Feng, R. Mao, X. Gu, T. Li, Q. Li, Y. Bao, L. Yang and X. Wu, Carbohydr. Polym., 2014, 105, 26–33 CrossRef CAS PubMed.
- X. Zhang, L. Liu and C. Lin, Int. J. Biol. Macromol., 2013, 59, 184–191 CrossRef CAS PubMed.
- C. Wei, P. He, L. He, X. Ye, J. Cheng, Y. Wang, W. Li and Y. Liu, Int. J. Biol. Macromol., 2018, 109, 65–75 CrossRef CAS PubMed.
- Z. Tinga, F. Yinab, M. Guanghuac, F. Weiweic and Z. Yanmind, Iran. J. Pharm. Res., 2017, 16, 347–356 Search PubMed.
- Z. Zhang, F. Kong, H. Ni, Z. Mo, J. B. Wan, D. Hua and C. Yan, Carbohydr. Polym., 2016, 144, 106–114 CrossRef CAS PubMed.
- C. L. Bandet, S. Tan-Chen, O. Bourron, H. Le Stunff and E. Hajduch, Int. J. Mol. Sci., 2019, 20, 479 CrossRef CAS PubMed.
- Z. Wang, X. Gao, W. Li, S. Tan and Q. Zheng, Food Sci. Biotechnol., 2020, 29, 683–692 CrossRef CAS PubMed.
- L. Ding, X. Yuan, J. Yan, Y. Huang, M. Xu, Z. Yang, N. Yang, M. Wang, C. Zhang and L. Zhang, Int. Immunopharmacol., 2019, 71, 198–204 CrossRef CAS PubMed.
- Y. Li, Y. Wu, X. Yao, F. Hao, C. Yu, Y. Bao, Y. Wu, Z. Song, Y. Sun, L. Zheng, G. Wang, Y. Huang, L. Sun and Y. Li, Int. J. Mol. Sci., 2017, 18(4), 794 CrossRef PubMed.
- T. Zhang, H. Ouyang, X. Mei, B. Lu, Z. Yu, K. Chen, Z. Wang and L. Ji, FASEB J., 2019, 33, 11776–11790 CrossRef CAS PubMed.
- G. T. Ho, H. Wangensteen and H. Barsett, Int. J. Mol. Sci., 2017, 18(3), 584 CrossRef PubMed.
- P. C. Kuo, I. C. Yu, B. A. Scofield, D. A. Brown, E. T. Curfman, H. C. Paraiso, F. L. Chang and J. H. Yen, Brain, Behav., Immun., 2017, 62, 180–192 CrossRef CAS PubMed.
- S. Liao, J. Wu, R. Liu, S. Wang, J. Luo, Y. Yang, Y. Qin, T. Li, X. Zheng, J. Song, X. Zhao, C. Xiao, Y. Zhang, L. Bian, P. Jia, Y. Bai and X. Zheng, Redox Biol., 2020, 36, 101644 CrossRef CAS PubMed.
- J. Zhang, Y. Liu, Y. Zheng, Y. Luo, Y. Du, Y. Zhao, J. Guan, X. Zhang and J. Fu, J. Neuroinflammation, 2020, 17, 2 CrossRef CAS PubMed.
- S. Y. Kim, C. Y. Jin, C. H. Kim, Y. H. Yoo, S. H. Choi, G. Y. Kim, H. M. Yoon, H. T. Park and Y. H. Choi, Int. J. Mol. Med., 2019, 43, 682–692 CAS.
Footnote |
| † These authors contributed equally to this work. |
| This journal is © The Royal Society of Chemistry 2021 |

