 Open Access Article
Rapid green-synthesis of TiO2 nanoparticles for therapeutic applications
Shilpy Bhullar a,
Navdeep Goyala and
Shikha Gupta
 *b
*b
aDepartment of Physics, Centre of Advanced Study in Physics, Panjab University, Chandigarh-160014, India
bDepartment of Physics, Goswami Ganesh Dutta Sanatan Dharma College, Sector-32C, Chandigarh-160032, India. E-mail: shikha.gupta@ggdsd.ac.in
First published on 13th September 2021
Abstract
Nanoparticles (NPs) with sizes ranging from 2 nm to 1 μm find various applications in the field of theranostics. Moreover, if eco-friendly methods are opted for the synthesis of biocompatible and less toxic NPs, then that's a huge success. Titanium dioxide nanoparticles (TiO2 NPs) have been vigorously studied for their use in medical implants, photodynamic therapy, drug delivery, biosensing and as antimicrobial agents. The present study reports the green-synthesis of TiO2 NPs for the first-time using extracts of black pepper (Piper nigrum), coriander (Coriandrum sativum) and clove (Syzygium aromaticum). All three samples of TiO2 NPs were synthesized via a modified sol–gel method under similar environmental conditions. Similar treatments were given to the samples. The procedure adopted for the synthesis ensures the use of non-toxic materials, no production of toxic by-products and rapid synthesis of the TiO2 NPs. The NPs were characterized by X-ray diffraction, high resolution-transmission electron microscopy, energy dispersive spectroscopy, field emission scanning electron microscopy and selected area electron diffraction which confirmed the formation, morphology, crystallinity and size of the TiO2 NPs. These characterizations displayed the similarity index of all three samples. However, photoluminescence and vibrating sample magnetometer studies highlighted the differences among the three samples. All three samples of NPs obtained had a size range of 5–20 nm. Further, the findings showed that different plant extracts result in TiO2 NPs with moderately different characteristics. Furthermore, the samples were analysed for their drug-encapsulation efficiency using UV-visible spectrophotometry. Among all three samples, the NPs synthesised using black pepper exhibited the maximum encapsulation efficiency. The study concludes that the plant's bio-profile is responsible for bringing about changes in the traits of the resulting nanoparticles. Thus, the extracts from different plants have the ability to manipulate the properties of the synthesized NPs. These findings can help to understand the role and importance of the plants in synthesizing NPs for biomedical applications. A further detailed study in this field can help researchers to understand the influence of the plant's biochemistry in shaping the NPs.
1 Introduction
Today the world is moving towards adopting eco-friendly measures for sustainable development. Nanoparticles (NPs) are now slowly capturing the global market because of their versatility. But as everything comes with a flaw, these NPs also result in biohazards. During their synthesis, chemicals are used which often lead to many toxic by-products. As a remedy to this bizarre scenario, the green synthesis approach is fascinating to researchers these days. The green synthesis technique involves the maximum use of biomass to retrieve the NPs. However, the term ‘green’ is not restricted to plants alone. Various fungi-mediated and bacteria-mediated synthesis also come under the green synthesis procedure. Thus, biomass, in general, is being extensively utilised for environment-friendly synthesis techniques. When using plants, the extracts of their roots, leaves, stems, seeds, flowers or fruits, can be used. Organic polymers are the building blocks of the plants and these include starch, chitin, cellulose, hemicellulose, lignin and various resins. Whenever plant extracts are used, the organic polymers and the biomolecules present in them, are responsible for their characteristic behaviour. Cellulose is the most abundant organic polymer and is a polysaccharide present in the primary cell wall of plants and many forms of algae. Lignocellulose biopolymers nourish the cell wall of the plants and they consist of cellulose, hemicellulose and lignin. Lignin constitutes around 30 percent of the lignocellulose biomass and contains a large number of phenylpropanoids. It has the potential to replace petroleum and its depolymerization offers remarkable possibilities for producing high-quality chemicals.1,2,3 This is a step towards modern day eco-friendly synthesis procedures. Plant extracts and plant-based biopolymers are preferred for making most of the metal and metal oxide NPs because of their ability to reduce and stabilize the NPs.4 Lignin matrices have been used in the green-synthesis of gold NPs (Au NPs) and copper oxide NPs (CuO NPs).5,6 The optimum concentration of lignin resulted in uniformly dispersive Au NPs. Titanium dioxide NPs are being chosen by scientists to be used for various applications all over the globe because of their versatility. Their global production is going to increase over a couple of years as these NPs are quite promising candidates in health and agricultural industries. They have been manufactured chemically for more than a decade. But now, due to environmental concerns, researchers are trying to make their synthesis cleaner and greener. Many scientists have succeeded in processing plant based TiO2 NPs. Recently, Ahmad et al.7 reported green-synthesized TiO2 NPs using leaf extract of Mentha arvensis (Mint) and they showed impressive antifungal and antibacterial activities against chosen microorganisms. Amanulla et al.8 also synthesized TiO2 NPs using orange peel extract and the resulting NPs displayed effective antibacterial properties. Not only plant extracts, in fact, NPs are being generated via many fungi and bacterial strains as well. For instance, Clarence et al.9 manufactured gold NPs using a fungi strain and they demonstrated various biomedical applications. The green synthesized NPs are not only eco-friendly, but they have many utilities also. Sethy et al.10 synthesized TiO2 NPs from Syzygium cumini (Java Plum) extract and they proved to be efficient photocatalysts in degrading the toxic lead from water with 75.5% removal of COD (Chemical Oxygen Demand). These NPs manufactured by a green process result in quite impressive photocatalysts.11,12,13 They owe this behaviour to the generation of ROS (Reactive Oxygen Species) upon UV irradiation.14 ROS are highly reactive and killer radicals which induce the degradation of whatever it comes in contact with. Due to the wider band gap, TiO2 NPs absorb UV radiation mostly and produce ROS. However, efforts are being made to tune the band gap so that they can absorb visible light and do the same. For the same, different dopings are being performed. Shen et al.15 devised Ce-doped TiO2 NPs with improved photocatalysis than the bare NPs. A suitable mixing or doping can remarkably enhance the ROS generation among the NPs.16Till date, many researchers have synthesized the TiO2 NPs using different plant extracts. However, still there are many plants which have not been utilized for this purpose. Also, not much data is available on the green-synthesis of below 10 nm sized NPs. Our research work revolves around the use of three different green-extracts in the synthesis of TiO2 NPs and the majority of the NPs in all the three samples were below 10 nm in size. According to a study by Ohta et al.,17 the optimal size of NPs for the drug delivery into the brain via penetrating Blood–Brain–Barrier (BBB) is 5–6 nm. Sub-5 nm NPs show significant advantages in penetrating tumor tissues and minimal Reticulo-Endothelial System (RES) uptake, especially in the liver and spleen.18 The smaller the NPs, the more penetrating power they possess. Fadeel et al.19 synthesised anatase TiO2 NPs having sizes in the range 13–18 nm using aloe vera leaf extract. They were loaded with doxorubicin (DOX) exhibiting high encapsulation efficiency. Their studies concluded that TiO2 NPs were as efficient as liposomes in the drug-delivery system of DOX. Thus, in order to synthesize NPs with potential theranostic applications, we chose Coriander (Coriandrum sativum), Black pepper (Piper nigrum) and Clove (Syzygium aromaticum) for the present study. All three are known to have significant health benefits. Coriander is a herb in the family Apiaceae and belongs to the parsley family. All its parts are edible but its fresh leaves and seeds are particularly used in cooking. It is good for digestion and lowers blood sugar. Black pepper belongs to the family Piperaceae and is mostly used as a spice for seasoning. It has anti-inflammatory and antioxidant properties. Clove is the aromatic spice of the family Myrtaceae. It possesses anti-carcinogenic, antiviral and anti-histamine properties. Linalool is the main component of coriander along with camphor, limonene and geraniol. Piperine is the active ingredient of black pepper. Eugenol, eugenyl acetate and caryophyllene are the major components of the clove. The present study discusses the impact of extracts of different plants on the resulting NPs, however, consideration of different biomass materials for the same is beyond the scope of the study. The reason behind this study is to develop less-toxic NPs which can be used for drug delivery applications with the focus primarily on BBB penetration. In order to use the NPs for various biomedical applications, it is necessary for them to be biocompatible and non-toxic. Moreover, the size of the NPs is quite important in the therapeutic role they are going to play. The non-toxicity of the NPs can be assured if they are synthesised following green methods. Furthermore, there are limitless techniques by which green synthesis of the NPs can be realised. Researchers around the globe employ different plants, modes of synthesis, solvents, precursors, catalysts, reducing agents and extraction techniques to fabricate NPs. However, the significance of a particular plant on the resulting NPs can be understood only when different plants are used to synthesise the same kind of NPs by keeping all other factors fixed. Thus, the major goal of the study was to realise speedy green-synthesis of smaller-sized TiO2 NPs below 10 nm using three different plant extracts and to analyse them on different grounds. To achieve this, similar experimental conditions were provided during the synthesis of all the three samples. The only variable was the plant extract itself, which was added during preparation, the rest all the factors were kept constant. Normally, calcination at higher temperatures evaporates all the volatile compounds present in the samples. The prior assumption was that upon calcination at 400 °C, almost the entire moisture content, which could be majorly attributed to the plant extract present in the samples, would be lost and exact replicas of TiO2 NPs would be obtained in all the three samples. In contrast, the findings revealed that all the three samples belonged to TiO2 NPs which were quite similar in structural and morphological properties but exhibited observable differences in optical and magnetic properties.
2 Experimental
2.1 Materials
The materials used are titanium tetraisopropoxide (TTIP), ethanol and deionized (DI) water. These were purchased from Sigma Aldrich Pvt. Ltd, Bangalore, India and all the chemicals were used as such without any further purification. IKA-RCT basic IKAMAG safety control magnetic stirrer by Merck, India was used for the stirring and heating applications. A muffle furnace by Insif, India was used for the calcination of the samples. The extracts of black pepper, coriander and clove were chosen for our green synthesis. All three are well known spices and are easily available. The packets of the whole black pepper and the whole clove purchased belonged to the Indian brands Organic Tattva and Pro Nature, respectively. Coriander was purchased from the spice and vegetable market, Sector-26, Chandigarh, India. After the purchase they were properly washed with DI water and naturally air-dried at room temperature to remove dust or any other contaminants. In addition, Imatinib manufactured by Cipla, India was also purchased for the encapsulation of the NPs. More details about the three plants chosen are given in Table 1.2.2 Green synthesis of TiO2 NPs
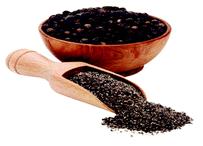
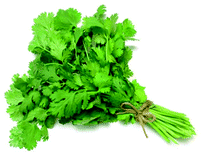
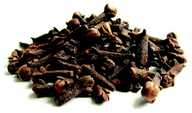
The three plant extracts were prepared by adding 20 grams each of the black pepper, coriander and clove, separately in 100 ml of DI water. The solution was then heated for 30 minutes at low flame. After that, the solution was filtered out using Whatman filter paper which resulted in the final extract. Later, 10 ml of the plant extract was used for the synthesis. Sol–gel method was the preferred approach for the synthesis of NPs.20 But instead of using the standard procedure, we accelerated the sol–gel process by refluxing the entire solution right from the start. Reflux assists in controlling the particle size. The stoichiometric amount of the precursor (TTIP) was used along with the plant extract and the mixture was stirred magnetically for 3 hours under reflux. The quantity of the titanium precursor i.e. TTIP was adjusted to 0.1 molarity. No more than 2 ml of ethanol was added, not only to bring homogeneity in the solution but also to speed up the process. All three NPs were prepared following the same procedure. The very presence of the respective plant's extract resulted in solutions displaying different characteristic colours. The colours of the final solution of black pepper, coriander and clove were dirty black, green and rusty brown respectively. The three solutions were calcined at 400 °C for two hours, which is supposed to provide better crystallinity.21 Subsequently, all the three samples turned brilliant white showing the characteristic white colour of TiO2 NPs. Finally, the samples were named as T1 (coriander), T2 (black pepper) and T3 (clove) (Fig. 1).2.3 Drug-encapsulation efficiency
The encapsulation of T1, T2 and T3 was realised by following the procedure mentioned elsewhere19 with minor modifications. Three sets of drug-NPs solutions were prepared. A fixed quantity of the drug was added to 30 ml DI water in a beaker followed by the addition of 500 mg of the respective NPs. The beakers were tightly sealed and stirred for two days at 37 °C. Then the solutions were centrifuged and the supernatants of all the three solutions were collected and later measured for their absorbances, recorded at 254 nm using UV-visible double beam spectrophotometer. The concentration of Imatinib was calculated from the previously built standard calibration curve of the same in DI water. The encapsulation efficiency (%) was calculated from the following equation:| Encapsulation efficiency (%) = (initial amount of drug − amount of drug present in the supernatant/initial amount of drug) × 100 |
2.4 Characterization
The NPs were characterized for their physical, morphological and magnetic properties. X-ray diffraction (XRD) was performed by Panalytical X'Pert Pro which is equipped with x'Celerator solid-state detector manufactured by Panalytical, Netherlands. For XRD, the powdered sample was firmly spread onto the glass slide which was carefully placed onto the sample stage. Field Enhanced Scanning Electron Microscopy (FESEM) was performed by FEG Scanning Electron Microscope Hitachi SU8010 series by Hitachi High-Technologies Corporation, Japan. The sample preparation for FESEM involves adding the sample onto the carbon tape followed by sputter coating with gold and then using it for imaging purposes. Both characterizations were done at the Sophisticated Analytical Instrumentation Facility (SAIF), Panjab University, Chandigarh, India. High Resolution Transmission Electron Microscopy (HR-TEM), Selected Area Electron Diffraction (SAED) and Energy Dispersive Spectroscopy (EDS) were carried out using Jeol 2100 Plus, Japan. Here, the sample was dispersed in ethanol and ultrasonicated for an hour. A single drop of the NPs solution was then carefully placed onto the copper mesh. The grid was air-dried at room temperature and after 30 minutes, was used for imaging. These characterizations were performed at CIL, Panjab University, Chandigarh, India. Photoluminescence was carried out at INST, Mohali, Punjab, India using the FS5 Spectrofluorometer manufactured by Edinburgh Instruments, United Kingdom by firmly placing the powdered sample onto the sample holder in the apparatus. The Vibrating Sample Magnetometer (VSM) instrument used in the study was designed by MicroSense, United States of America. The samples were analysed at room temperature (300 K). They were firmly placed and gently tapped to form a thin layer on the sample holder. The apparatus was provided by the Department of Physics, Himachal Pradesh University, India. The Centrikon T-42 K by Kontron Instruments, United Kingdom was used for centrifugation at 10![[thin space (1/6-em)]](https://www.rsc.org/images/entities/char_2009.gif) 000 rpm. UV-VIS-NIR Spectrophotometer - Lambda 750 from Perkin Elmer, United States of America was used to measure the UV-visible absorption spectra.
000 rpm. UV-VIS-NIR Spectrophotometer - Lambda 750 from Perkin Elmer, United States of America was used to measure the UV-visible absorption spectra.
3 Results and discussion
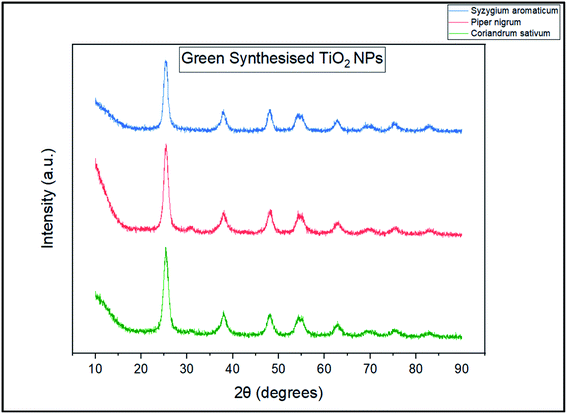
The XRD data in Fig. 2 indicates that we have successfully synthesized anatase TiO2 NPs with the characteristic peak at 25.45° corresponding to the plane (101). The peaks at 38.19°, 48.15°, 54.3°, 54.96° and 62.76° correspond to (004), (200), (105), (211) and (204) respectively. The obtained XRD plots for all the three types of NPs match exactly with the JCPDS no.: 21–1272. Lal et al.22 synthesized TiO2 NPs calcined at different calcination temperatures. Their XRD plot obtained for TiO2 NPs calcined at 400 °C is exactly similar to ours. Moreover, since the nanoparticles were calcined at 400 °C (which is considered to be lower in comparison to high calcination temperatures like 1100 °C to 1500 °C) and lower temperature favours anatase phase, this totally justifies our observation. Jalawkhan et al.23 also produced anatase-phase TiO2 NPs after the one-hour heat treatment at 400 °C. Pushpamalini et al.24 also synthesized anatase-phase TiO2 NPs and their XRD pattern is quite similar to what we have obtained. With this, we conclude that all the three varieties of TiO2 NPs synthesized using different plant extracts are exactly similar in their crystallinity and phase. Furthermore, their sizes calculated by Debye–Scherrer's formula are also quite similar.25 The sizes of T1, T2 and T3 are 5.72 nm, 5.57 nm and 6.59 nm respectively. With this, we also conclude that anatase phase and lower calcination temperature result in small crystallite sizes as reported in our previous study.26Photoluminescence (PL) (emission/excitation) spectrums were obtained for all the three samples. The emission spectra were obtained after excitation at particular wavelengths. For the emission spectrum, the range of wavelengths was 400–800 nm. In the case of sample T1 as shown in Fig. 3(a), for λex = 400 nm, the emission spectrum was obtained having peak at λem,max = 559.50 nm and for λex = 384 nm, the emission peak was obtained at λem,max = 546.57 nm. For the excitation spectra, corresponding to λem,max = 550 nm, the maximum intensity was observed at λ = 437.85 nm. The excitation peak corresponding to λem,max = 460 nm, the maximum intensity was achieved at λ∼400 nm. Corresponding to λem,max = 410 nm, the highest peak in the excitation spectrum was obtained at λ = 384.03 nm. In the case of sample T2 as shown in Fig. 3(b), for λex = 400 nm, the emission spectrum was obtained at λem,max = 441.12 nm and for λex = 384 nm, the emission peak was obtained at λem,max = 441.12 nm. Keeping the λem,max = 550 nm fixed, the excitation spectrum showed the highest peak at λ = 402.67 nm and for λem,max = 460 nm, the maximum intensity was observed at λ = 461.45 nm. In the case of sample T3 as shown in Fig. 3(c), for λex = 400 nm, the emission spectrum was observed showing peak at λem,max = 539.8 nm whereas, for λex = 384 nm, the emission peak was at λem,max = 440.39 nm. Corresponding to λem,max = 460 nm, the excitation spectrum showed the maximum intensity at λ = 400 nm and owing to λem,max = 550 nm, the highest peak in the excitation spectrum was observed at λ = 461.95 nm. Thus, in order to summarize, for λex = 400 nm, the relation between the λem,max of all the three samples is: T1 > T3 > T2 and for λex = 384 nm, the relation is: T1 > T2 > T3 (however, the difference in the values for T2 and T3 is quite small). Similarly, some observable differences can be seen in the excitation spectra as well. Fig. 4 shows the chromaticity coordinates plotted on the CIE 1931 diagram of the PL emission spectrum for the three samples owing to the excitation at 400 nm. The chromaticity index of T1, T2 and T3 are (0.36,0.43), (0.20,0.20) and (0.33,0.38) respectively. For T1 and T3, the colour zones are quite near in the yellowish zone whereas for sample T2, the colour coordinates are found in the bluish zone. Jagannath Panda et al.27 synthesized TiO2 NPs hydrothermally and heated them at 500 °C. Since the whole procedure of synthesis was different, a different PL emission spectrum was obtained for the excitation at 479 nm. Joshi et al.28 synthesized anatase TiO2 NPs which were annealed at 500 °C. The size of the NPs was ∼10 nm, which clearly depicts that smaller sized crystallites were produced. In their report, the colour coordinates of the annealed NPs were found in the orange colour zone. Here, the PL and the chromaticity diagram displayed different nature of all the three samples whereas according to the XRD data, all three were seemingly alike.
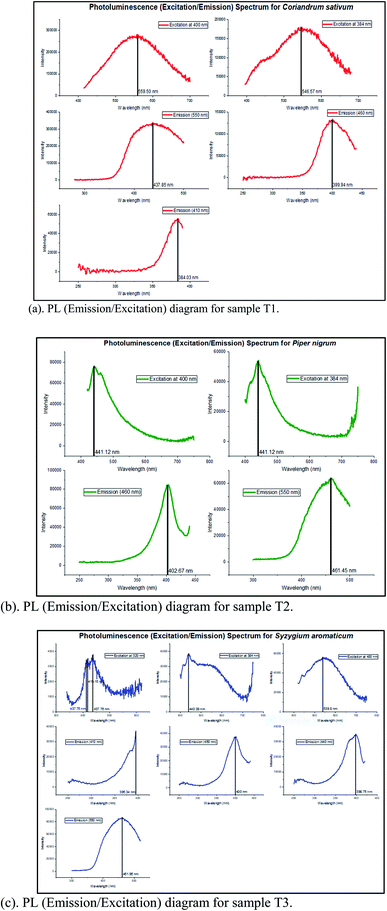 | ||
| Fig. 3 (a) PL (emission/excitation) diagram for sample T1. (b) PL (emission/excitation) diagram for sample T2. (c) PL (emission/excitation) diagram for sample T3. | ||
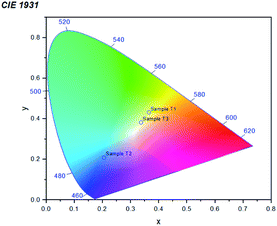 | ||
| Fig. 4 A combined chromaticity diagram (CIE 1931) for all the three samples T1, T2 and T3 upon the excitation at 400 nm. | ||
Fig. 5 demonstrates the FESEM images of all the NPs obtained from the three samples to be nearly spherical in size. As smaller nanoparticles are more prone to agglomeration, thus, the agglomerates can be easily seen. The images clearly depict the small particle sizes. These results confirmed the anatase phase of the TiO2 NPs obtained, indicating smaller crystalline size at 400 °C.
In Fig. 6, the HR-TEM images showed the lattice fringes which confirm the presence of poly-crystalline structure. Furthermore, agglomeration was found in all the samples. Interplanar-spacing (d) has been calculated to be approximately equal to 0.36 nm, 0.38 nm and 0.35 nm for T1, T2 and T3 respectively. The histograms in Fig. 7(a)–(c) depict the average particle size distribution in the three samples respectively. In nutshell, the size varies from roughly 5 nm to 20 nm for all the synthesized NPs. Moreover, the SAED images also confirmed the anatase phase of the resulting NPs. For T1 as shown in Fig. 8(a), a ring pattern was obtained. A perfect dotted pattern was observed for T2 as depicted in Fig. 8(b) whereas the rings were quite blurred and diffusive in case of T3 (Fig. 8(c)).
 | ||
| Fig. 7 Histograms showing the average particle size distribution in the sample (a) T1 (b) T2 (c) T3. | ||
Fig. 9 (a)–(c) reveal EDX studies which clearly confirmed the presence of Ti and O in all the three samples. The presence of Zr and C peaks is due to the experimental setup. However, a very little presence of Al in case of black pepper could be due to the fact that black pepper is usually adulterated with aluminium.
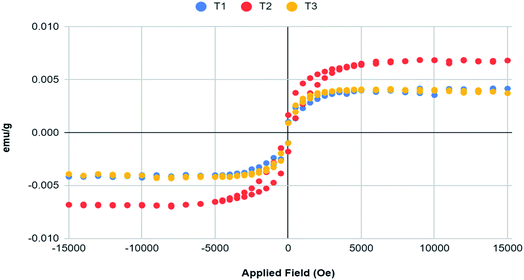
Fig. 10(a)–(c) show the raw VSM plots of the three samples. Zhao et al.29 manufactured TiO2 NPs using tetra-n-butyl titanate as precursor and annealed them at different temperatures. For annealing at 450 °C, they obtained anatase phase of the NPs. The M–H curve plotted by them for the same at room temperature displayed the diamagnetic nature of TiO2 NPs. However, their study indicated that heat treatments given at different temperatures and even the VSM study conducted at different temperatures can significantly alter the magnetic properties of the NPs. The raw M–H curves obtained clearly depicted strong diamagnetic behaviour with very weak ferromagnetism at lower fields of the resulting nanoparticles. The hysteresis loop obtained in the central portion is purely due to the sample itself as the contribution of the sample holder without any sample has already been considered. We don't suspect these results to be produced erroneously because proper care was taken to protect the sample from contamination. Moreover, the magnetometer itself was not found to be contaminated with any ferromagnetic debris. As all the three samples resulted in TiO2 NPs, there was no change in the general magnetic behaviour displayed by them. However, sample T2 showed slightly more profound ferromagnetic behaviour than the other two samples. This behaviour can be further enhanced by modifying the synthesised NPs with a magnetic material. Tables 2–4 show the Hysteresis loop parameters of T1, T2 and T3 respectively. Fig. 11 has been obtained by plotting the VSM data after subtracting the diamagnetic contribution thereby resulting solely in ferromagnetic contribution.30 We can see from the plot that the weak ferromagnetic behaviour of T1 and T3 are almost similar and overlapping whereas T2 shows slightly more ferromagnetic character. In order to use the NPs for targeted drug delivery, their ferromagnetic character can be of great help. The future of these NPs relies on coating them with a magnetic material so as to achieve magnetically-guided drug delivery to the target. With the encapsulation of these TiO2 NPs with a magnetic material, their ferromagnetic behaviour would be significantly improved. This would further enhance the response of these NPs to the applied magnetic field which would be beneficial to achieve targeted drug delivery via NPs.
 | ||
| Fig. 10 The raw VSM plots (emu vs. Oe) obtained at room temperature (300 K) for the sample (a) T1 (b) T2 (c) T3. | ||
| Hysteresis loop | Upward part | Downward part | Average | Parameter ‘definition’ |
|---|---|---|---|---|
| Hysteresis parameters | ||||
| Hc Oe | −14994.000 | −14993.000 | −0.500 | Coercive field: field at which M//H changes sign |
| Mr emu | −53.331 × 10⁻⁶ | 54.548 × 10⁻⁶ | 53.940 × 10⁻⁶ | Remanent magnetization: M at H = 0 |
| S | 0.058 | 0.060 | 0.059 | Squareness: Mr/Ms |
| S* | 1.046 | 1.044 | 1.045 | 1-(Mr/Hc) (1/slope at Hc) |
| Ms emu | 914.080 × 10⁻⁶ | −913.721 × 10⁻⁶ | 913.900 × 10⁻⁶ | Saturation magnetization: maximum M measured |
| Hysteresis loop | Upward part | Downward part | Average | Parameter ‘definition’ |
|---|---|---|---|---|
| Hysteresis parameters | ||||
| Hc Oe | −14994.000 | −14994.000 | 0.000 | Coercive field: field at which M//H changes sign |
| Mr emu | −135.937 × 10⁻⁶ | 123.787 × 10⁻⁶ | 129.862 × 10⁻⁶ | Remanent magnetization: M at H = 0 |
| S | 0.153 | 0.139 | 0.146 | Squareness: Mr/Ms |
| S* | 1.089 | 1.095 | 1.092 | 1 − (Mr/Hc) (1/slope at Hc) |
| Ms emu | 887.521 × 10⁻⁶ | −892.409 × 10⁻⁶ | 889.965 × 10⁻⁶ | Saturation magnetization: maximum M measured |
| Hysteresis loop | Upward part | Downward part | Average | Parameter ‘definition’ |
|---|---|---|---|---|
| Hysteresis parameters | ||||
| Hc Oe | −14994.000 | −14994.000 | 0.000 | Coercive field: field at which M//H changes sign |
| Mr emu | −61.505 × 10⁻⁶ | 54.439 × 10⁻⁶ | 57.972 × 10⁻⁶ | Remanent magnetization: M at H = 0 |
| S | 0.055 | 0.049 | 0.052 | Squareness: Mr/Ms |
| S* | 1.038 | 1.043 | 1.041 | 1 − (Mr/Hc) (1/slope at Hc) |
| Ms emu | 1.109 × 10⁻³ | −1.115 × 10⁻³ | 1.112 × 10⁻³ | Saturation magnetization: maximum M measured |
In the present study we have also estimated the encapsulation efficiency of T1, T2 and T3 using the method and formula already mentioned above in Section 2.3. The encapsulation efficiency (%) of T1, T2 and T3 was calculated to be 40.3%, 45% and 42.7% respectively. However, this can be significantly improved by several modifications such as addition of capping or surface agents or by further enhancing the porosity of the nanoparticles. One can also consider studying different plants containing different biomolecules with respect to the drug to be loaded. Moreover, further characterizations and analysis on the same are beyond the scope of this study.
With this, we can infer that as all these three samples differ only in the aspect of the plant extract, the plant's bio-profile can be effectively responsible for this peculiar observation. This further can be associated with the property of the biomolecules present in the plant's protein or DNA.31 In fact, among all the three samples, it was the sample T2 prepared from black pepper which outshone the other two in the results of PL, EDX, SAED and VSM. In a similar study, TiO2 NPs synthesised using four different plant extracts were analysed. The different physical and morphological features were justified on the basis of the usage of different plant extracts. The NPs were calcined at 400 °C and thus all the four samples were of anatase phase with their sizes ranging between 6.7 to 8.3 nm. This observation clearly matches ours. Moreover, the samples were characterised for FTIR but no significant difference was observed in the FTIR spectra obtained. One of the samples fabricated using Moringa oleifera exhibited the maximum photocatalytic efficiency. The results were concluded by stating that Moringa oleifera had a greater influence on the NPs so obtained. However, no further explanation regarding this behaviour was provided.24 Jain et al.32 synthesised silver NPs (AgNPs) using tulsi leaf extract and quercetin as the separate reducing agents. Quercetin is the primary biomolecule present in tulsi and thus the findings revealed that almost similar observations were made in the NPs synthesised using tulsi extract and quercetin separately. This indicates that the quercetin present in tulsi is majorly responsible for the synthesis of AgNPs. Moreover, increasing the concentration of plant extract in the silver nitrate solution increased the particle size. When compared to our work, the same quantity of all the three plant extracts were used and therefore, TiO2 NPs of almost similar size were obtained. Ogunyemi et al.33 synthesised zinc oxide NPs (ZnO NPs) using similar concentration of extracts of chamomile flower, olive leaf and red tomato fruit respectively. All the three were detected with the presence of different chemical compounds and as a consequence, different antibacterial activities. However, it is not only the extracts of different plants, but the extracts from different parts of the plant also lead to different properties of the resulting NPs. For example, Nguyen et al.34 biogenically synthesised magnesium oxide NPs (MgO NPs) by using the flower, bark and leaf extracts of Tecoma stans (L.) one by one in order to make three samples. The results unveiled the supremacy of chemical compounds and functional groups on the surface of NPs. The MgO NPs synthesised using the flower extract outperformed the other two samples in an effective uptake capacity of different dyes. This was attributed to the presence of antioxidant-rich compounds especially present in the flowers. Thus, there is a lot of evidence available which strengthens the dependence of the properties of green-synthesised NPs on their respective plant extracts.
4 Conclusion
We have successfully synthesized eco-friendly TiO2 NPs from plant extracts of black pepper, coriander and clove. The maximum percentage of the synthesized NPs was below 10 nm in size. Although the experimental conditions for the synthesis of all the three samples were the same, yet different plant extracts brought out different results. Among all the three samples, TiO2 NPs synthesized using plant extract of Piper nigrum (black pepper) showed strikingly different characteristics than the other two. The samples synthesized by the extract of Coriandrum sativum (coriander) and Syzygium aromaticum (clove) exhibited only minor differences in their studied parameters. With this, we conclude that even though all the three extracts are resulting in TiO2 NPs, yet they are bringing about observable changes in the properties of the resulting NPs. The reason behind this can be associated with the different biomolecules associated with each of these chosen plants. This is a very generalized finding and can be applied to other metal and metal oxide NPs too. Moreover, all the three samples showed significant drug-encapsulation efficiency which can be further improved with certain modifications. Thus, these tiny green NPs can be significantly utilized as nanomedicine and in other drug-delivery applications. The scope of this study involves further research on the very aspect of the plant's molecular chemistry and their impact on the features of the synthesised NPs. This can create a new dimension for the budding researchers to chalk out their ideas for research. Fourier Transform Infrared Spectroscopy (FTIR) studies and other detailed elemental analysis can be conducted to gauge the impact of plants in shaping the NPs.Conflicts of interest
This statement is to certify that all authors have seen and approved the manuscript being submitted. We warrant that the article is the authors' original work. We warrant that the article has not received prior publication and is not under consideration for publication elsewhere. Authors have no conflicts of interest to disclose.Author contributions
The authors confirm their contribution to the paper as follows: 1. Conceptualization – S. Bhullar, S. Gupta. 2. Data curation – S. Bhullar. 3. Formal analysis – S. Bhullar, N. Goyal, S. Gupta. 4. Funding acquisition – S. Bhullar, S. Gupta. 5. Investigation – S. Bhullar. 6. Methodology – S. Bhullar, S. Gupta. 7. Project administration – S. Bhullar, S. Gupta. 8. Resources – S. Bhullar, N. Goyal, S. Gupta. 9. Software – S. Bhullar, N. Goyal 10. Supervision – N. Goyal, S. Gupta. 11. Validation – S. Bhullar, N. Goyal, S. Gupta. 12. Visualization – S. Bhullar. 13. Writing – original draft – S. Bhullar. 14. Writing – review & editing – S. Bhullar, N. Goyal, S. Gupta. All authors reviewed the results and approved the final version of the manuscript.Acknowledgements
We are grateful to Sophisticated Analytical Instrumentation Facility (SAIF) and CIL, Panjab University, Chandigarh for timely characterizations. Also, we are grateful to the Department of Physics, Himachal Pradesh University, Shimla for VSM characterization.References
- C. Chen, D. Wu, P. Liu, J. Li, H. Xia, M. Zhou and J. Jiang, Green Chem., 2021, 23(8), 3090–3103, 10.1039/d1gc00510c.
- C. Chen, D. Wu, P. Liu, H. Xia, M. Zhou, X. Hou and J. Jiang, React. Chem. Eng., 2021, 6, 559–571, 10.1039/d0re00379d.
- C. Chen, M. Zhou, P. Liu, B. K. Sharma and J. Jiang, New J. Chem., 2020, 44, 18906–18916, 10.1039/d0nj02929g.
- A. M. E. Shafey, Green Process. Synth., 2020, 9, 304–339, DOI:10.1515/gps-2020-0031.
- Y. Yu, S. S. Naik, Y. Oh, J. Theerthagiri, S. J. Lee and M. Y. Choi, J. Hazard. Mater., 2021, 420, 126585, DOI:10.1016/j.jhazmat.2021.126585.
- M. K. Haider, A. Ullah, M. N. Sarwar, Y. Saito, L. Sun, S. Park and I. S. Kim, Int. J. Biol. Macromol., 2021, 173, 315–326, DOI:10.1016/j.ijbiomac.2021.01.050.
- W. Ahmad, K. K. Jaiswal and S. Soni, Inorg. Nano-Met. Chem., 2020, 50, 1032–1038, DOI:10.1080/24701556.2020.1732419.
- A. Mobeen Amanulla and R. Sundaram, Mater. Today, 2019, 8, 323–331, DOI:10.1016/J.MATPR.2019.02.118.
- P. Clarance, B. Luvankar, J. Sales, A. Khusro, P. Agastian, J.-C. Tack, M. M. Al Khulaifi, H. A. Al-Shwaiman, A. M. Elgorban, A. Syed and H.-J. Kim, Saudi J. Biol. Sci., 2020, 27, 706–712, DOI:10.1016/j.sjbs.2019.12.026.
- N. K. Sethy, Z. Arif, P. K. Mishra and P. Kumar, Green Process. Synth., 2020, 9, 171–181, DOI:10.1515/gps-2020-0018.
- H. Kaur, S. Kaur, J. Singh, M. Rawat and S. Kumar, Mater. Res. Express, 2019, 6, 095034, DOI:10.1088/2053-1591/ab2ec5.
- S. P. Goutam, G. Saxena, V. Singh, A. K. Yadav, R. N. Bharagava and K. B. Thapa, Chem. Eng. J., 2018, 336, 386–396, DOI:10.1016/j.cej.2017.12.029.
- G. Nabi, Q. U. Ain, M. B. Tahir, K. Nadeem Riaz, T. Iqbal, M. Rafique, S. Hussain, W. Raza, I. Aslam and M. Rizwan, Int. J. Environ. Anal. Chem., 2020, 1–9, DOI:10.1080/03067319.2020.1722816.
- L. Fu, M. Hamzeh, S. Dodard, Y. H. Zhao and G. I. Sunahara, Environ. Toxicol. Pharmacol., 2015, 39, 1074–1080, DOI:10.1016/j.etap.2015.03.015.
- C. Shen, K. Pang, L. Du and G. Luo, Particuology, 2017, 34, 103–109, DOI:10.1016/j.partic.2017.01.007.
- D. Hariharan, P. Thangamuniyandi, A. Jegatha Christy, R. Vasantharaja, P. Selvakumar, S. Sagadevan, A. Pugazhendhi and L. C. Nehru, J. Photochem. Photobiol., B, 2020, 202, 111636, DOI:10.1016/j.jphotobiol.2019.111636.
- S. Ohta, E. Kikuchi, A. Ishijima, T. Azuma, I. Sakuma and T. Ito, Sci. Rep., 2020, 10, 18220, DOI:10.1038/s41598-020-75253-9.
- M. Xie, Y. Xu, J. Huang, Y. Li, L. Wang, L. Yang and H. Mao, Wiley Interdiscip. Rev.: Nanomed. Nanobiotechnol., 2020, 12, e1644, DOI:10.1002/wnan.1644.
- D. A. Abdel Fadeel, M. S. Hanafy, N. A. Kelany and M. A. Elywa, Heliyon, 2021, 7, e07370, DOI:10.1016/j.heliyon.2021.e07370.
- M. Parashar, V. K. Shukla and R. Singh, J. Mater. Sci.: Mater. Electron., 2020, 31, 3729–3749, DOI:10.1007/s10854-020-02994-8.
- M. Kusuma and G. T. Chandrappa, J. Sci.: Adv. Mater. Devices, 2019, 4, 150–157, DOI:10.1016/j.jsamd.2019.02.003.
- M. Lal, P. Sharma and C. Ram, Optik, 2021, 241, 166934, DOI:10.1016/j.ijleo.2021.166934.
- R. S. Jalawkhan, A. A. Ouda, A. M. Abdul-lettif and F. K. Mohamad Alosfur, IOP Conf. Ser.: Mater. Sci. Eng., 2020, 928, 072159, DOI:10.1088/1757-899x/928/7/072159.
- T. Pushpamalini, M. Keerthana, R. Sangavi, A. Nagaraj and P. Kamaraj, Mater. Today, 2021, 40, S180–S184, DOI:10.1016/j.matpr.2020.08.438.
- S. K. Sen, U. C. Barman, M. S. Manir, P. Mondal, S. Dutta, M. Paul, M. A. M. Chowdhury and M. A. Hakim, Adv. Nat. Sci.: Nanosci. Nanotechnol., 2020, 11, 025004, DOI:10.1088/2043-6254/ab8732.
- S. Bhullar, S. Gupta and N. Goyal, in 3RD International Conference On Condensed Matter And Applied Physics (ICC-2019), AIP Publishing, 2020. DOI: DOI:10.1063/5.0001662.
- J. Panda, U. P. Singh and R. Sahu, IOP Conf. Ser.: Mater. Sci. Eng., 2018, 410, 012008, DOI:10.1088/1757-899X/410/1/012008.
- P. Joshi, H. Bhoi, S. Tiwari, K. Punia, G. Lal and S. Kumar, in 3RD International Conference On Condensed Matter And Applied Physics (ICC-2019), AIP Publishing, 2020. DOI: DOI:10.1063/5.0001738.
- J. Zhao, A. Zhao, W. Zhang, M. Yang and Z. Liu, Optoelectron. Adv. Mater., Rapid Commun., 2013, 7, 393–396 CAS.
- R. Bhardwaj, A. Bharti, J. P. Singh, K. H. Chae and N. Goyal, Nanoscale Adv., 2020, 2(10), 4450–4463, 10.1039/d0na00499e.
- I. Ćosić, E. Pirogova, V. Vojisavljević and Q. Fang, FME Trans., 2006, 34, 71–80 Search PubMed.
- S. Jain and M. S. Mehata, Sci. Rep., 2017, 7, 15867, DOI:10.1038/s41598-017-15724-8.
- S. O. Ogunyemi, Y. Abdallah, M. Zhang, H. Fouad, X. Hong, E. Ibrahim, M. M. I. Masum, A. Hossain, J. Mo and B. Li, Artif. Cells, Nanomed., Biotechnol., 2019, 47, 341–352, DOI:10.1080/21691401.2018.1557671.
- D. T. C. Nguyen, H. H. Dang, D.-V. N. Vo, L. G. Bach, T. D. Nguyen and T. Van Tran, J. Hazard. Mater., 2021, 404, 124146, DOI:10.1016/j.jhazmat.2020.124146.
| This journal is © The Royal Society of Chemistry 2021 |

