 Open Access Article
Hydrogen-etched CoS2 to produce a Co9S8@CoS2 heterostructure electrocatalyst for highly efficient oxygen evolution reaction†
Yucan Dong,
Jiaqi Ran,
Qun Liu,
Guoqiang Zhang,
Xingdong Jiang* and
Daqiang Gao
Key Laboratory for Magnetism and Magnetic Materials of MOE, Key Laboratory of Special Function Materials and Structure Design of MOE, Lanzhou University, Lanzhou 730000, People's Republic of China. E-mail: gaodqxz@sina.com
First published on 13th September 2021
Abstract
There is a pressing requirement for developing high-efficiency non-noble metal electrocatalysts in oxygen evolution reactions (OER), where transition metal sulfides are considered to be promising electrocatalysts for the OER in alkaline medium. Herein, we report the outstanding OER performance of Co9S8@CoS2 heterojunctions synthesized by hydrogen etched CoS2, where the optimized heterojunction shows a low η50 of 396 mV and a small Tafel slope of 181.61 mV dec−1. The excellent electrocatalytic performance of this heterostructure is attributed to the interface electronic effect. Importantly, the post-stage characterization results indicate that the Co9S8@CoS2 heterostructure exhibits a dynamic reconfiguration during the OER with the formation of CoOOH in situ, and thus exhibits a superior electrocatalytic performance.
Introduction
Increasing energy demand and environmental pollution caused by fossil fuel consumption urgently requires a renewable, sustainable, high-energy-density energy source.1 The development of the hydrogen industry is supposed to be among the effective ways to resolve this problem.2 And water electrolysis is an important way to produce hydrogen.3 Although pure hydrogen is the target product of water electrolysis, the slow oxygen evolution reaction (OER) that occurs at the counter electrode largely determines the Faraday efficiency of the process.4 Presently, noble metal-based (e.g. IrO2/RuO2) materials are used as the most active OER catalysts, but their commercial application is very low due to their scarcity and high cost.5–7 Therefore, it is very urgent to find cost-effective, high efficiency alternatives on the planet.Recently, oxides,8,9 hydroxides,9–11 phosphides,12–14 carbides,15–17 nitrides,18–21 sulfides22–24 and selenides25 of first-row transition metals have aroused the attention of the world. In particular, cobalt-based materials as a low-cost and high-efficiency OER catalyst have been widely discussed, such as CoS2 (ref. 26), CoSe2 (ref. 27) and Co9S8.28 The main reason is that it has special electronic structure and abundant active sites, where they have risen to the forefront of electrocatalysts. Among the three-dimensional transition metal sulfides, the durability and conductivity of CoS2 have aroused great interest. However, its electrocatalytic performance is still far from that of precious metal-based materials. So far, a large number of strategies have been adopted to continue to improve its OER performance, including increasing percentage of active sites by doping,29 enhancing conductivity30 by promoting charge and carrier transport, and adjusting surface electronic structure or synergistic interaction by forming heterostructures31 with others transition metal halides, etc. Among these strategies, forming of heterostructure is a simple and effective way to enhance the intrinsic electrocatalytic performance toward OER. Therefore, reasonable selection of active ingredients with heterostructures, and their ideal degree of combination can control the overall electrocatalytic performance to a large extent. The coupling of CoS2 or Co9S8 with additional excellent electrocatalytic materials such as CoP,32 Co3O4,33 MoS2,34 CoSe2,31 V3S4,35 and so on has been reported to have a positive effect on water splitting.
Herein, Co9S8@CoS2 heterostructures were synthesized via etching CoS2 by hydrogen. And the optimized sample shows excellent OER activities including a low η50 (396 mV) and Tafel slope (181.61 mV dec−1). The characterizations of the samples after OER test reveal that the accompanying formation of substance CoOOH is the key issue to improve its electrocatalytic performance. Further, the synergistic effect between CoS2 and Co9S8 also greatly improves the electrocatalytic performance of OER, which has great potential in future oxygen evolution research.
Results and discussion
As displayed in Fig. 1a, the diffraction peaks of H-0 and H-5 correspond to the typical diffraction peaks of CoS2 (ref. 36) (JCPDS-no. 41-1471) and Co9S8 (ref. 31) (JCPDS-no. 02-1459), respectively. Noting that there are two phases of CoS2 and Co9S8 coexisting in the sample of H-3 and H-4, revealing that post hydrogen-etched CoS2 can produce Co9S8@CoS2 heterostructure, and then to the pure phase Co9S8 as the etching time increase. Fig. 1b displays the Raman spectra of all the samples, where the peaks marked by black dots can be assigned to CoS2 and the peaks marked by green rectangle can be assigned to Co9S8. It can be found that H-0 samples and H-5 samples are the standard vibration peaks of CoS2 and Co9S8, respectively. But samples of H-4 and H-3 show the vibration modes of both CoS2 and Co9S8, further confirm the existence of the two phases.36,37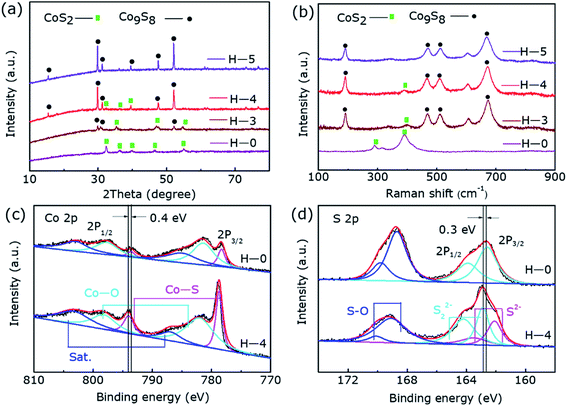 | ||
| Fig. 1 (a) The XRD patterns and (b) Raman spectra of the H-0, H-3, H-4 and H-5 sample, the abscissa is the logarithm of intensity. The XPS spectra of H-0 and H-4: the (c) Co 2p, (d) S 2p. | ||
Fig. 1c and d reveal the XPS results of the two typical samples H-0 and H-4, corresponding to the Co 2p and S 2p regions, respectively. As shown in Fig. 2c, in the high-resolution Co 2p spectrum of H-0, the spectrum shows Co 2p3/2 (778.3 eV) and Co 2p1/2 (793.6 eV) of Co2+. In addition, due to storage and other reasons, the samples are exposed to the air to produce Co–O bonds, which correspond to 781.4 eV and 797.7 eV. Furthermore, Co 2p3/2 and Co 2p1/2 binding energy of the H-4 has a slight positive shift about 0.4 eV compared to the H-0. The strong electronic interaction between CoS2 and Co9S8 in the heterostructure may be the cause of the shift, where charge transfer occurs at the interface. Fig. 1d shows S 2p spectrum of the sample H-0. As can be seen that S 2p3/2 and S 2p1/2 of S22− correspond to the two peaks of 162.6 eV and 163.9 eV. Besides, the S–O bonds located at 168.7 eV and 169.8 eV resulting from surface air exposure. In H-4 sample, S 2p3/2 and S 2p1/2 of S22+ correspond to the two peaks of 162.9 eV and 164.2 eV. Moreover, S 2p3/2 and S 2p1/2 of S2− correspond to the two peaks of 162.1 eV and 163.5 eV,31,36,38 which proves once again the generation of Co9S8@CoS2 heterojunction structure. The peaks of S22+ show 0.3 eV positive shift, which may be affected by the appearance of S2−. Thus, the transformation of Co9S8@CoS2 binding energy effectively supports the chemical coupling and electronic interaction between Co9S8 and CoS2. This electronic interaction can adjust the chemical adsorption energy of oxygen-containing intermediates, thereby exhibiting better OER catalytic performance.39
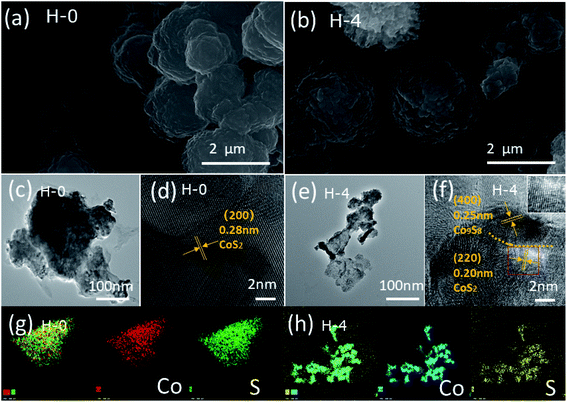 | ||
| Fig. 2 SEM images of H-0 (a) and H-4 (b). TEM images of H-0 (c) and H-4 (e). (d) HRTEM images of H-0 and (f) H-4. (g) EDX element mapping images of H-0 and (h) H-4. | ||
The surface structure and morphology of the samples were observed by SEM, TEM and HRTEM. SEM results obtained for samples H-0 and H-4 are shown in Fig. 2a and b, where both samples exhibit the morphology of irregular spherical shapes aggregated by some nanoparticles.36 The TEM images (Fig. 2c and e) of H-0 and H-4 clearly show that both are composed of stacked nanoparticles, corresponding to the SEM results. The HRTEM images are also employed. A fringe spacing of 0.28 nm corresponding to panels (200) of CoS2 is observed clearly in Fig. 2d. Comparatively, the fringes along different directions are observed in Fig. 2f and clear lattice fringes are measured as 0.25 nm and 0.20 nm, revealing the panels (400) of Co9S8 and (220) of CoS2, respectively. Fig. 3g and h provide the EDX element mapping images of H-0 and H-4, and all the elemental mappings results emerge that Co and S are uniformly distributed in the whole samples. Therefore, the Co9S8@CoS2 heterojunction is assumed to be Janus heterostructure.
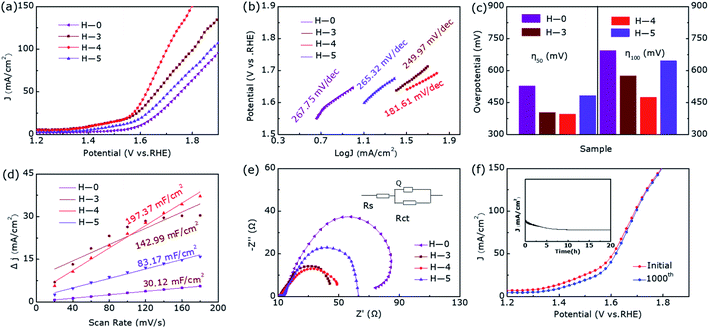
The linear sweep voltammetry shown in Fig. 3a emerge the OER catalytic performance of H-0, H-3, H-4 and H-5. It can be seen that the OER activity of the samples show clear difference as the annealing temperature increases, where the sample H-4 and H-3 with the Co9S8@CoS2 heterojunction show better OER catalytic performance than other samples. But the H-4 sample reveals the best OER performance. Fig. 3b demonstrates the Tafel plots of the estimated OER activity calculated from Fig. 3a. It can be found that the H-4 exhibits the smallest Tafel slopes (181.61 mV dec−1), indicating the highest kinetic activity among all samples. The η50 and η100 extracted from Fig. 3a are summarized in the Fig. 3c. The best-developed H-4 illustrates a 396 mV (η50) and 474 mV (η100). Besides, the cyclic voltammetry (CV) curve (Fig. S1, ESI†) illustrates that Cdl (Fig. 3d) of H-4 is about 197.37 mF cm−2, greater than that of H-0 (30.12 mF cm−2), H-3 (142.99 mF cm−2) and H-5 (83.17 mF cm−2). Generally, electrochemical surface area (ECSA) has a great influence on catalytic performance and the electrochemically active specific surface area (ECSA) is proportional to the electric double layer capacitance (Cdl). So it is calculated that the ESCA of H-4 sample is (350.3 cm2) far more than H-0 (53.5 cm2), H-3 (253.8 cm2) and H-5 (147.6 cm2).
Furthermore, we can also obtain the charge transfer resistance through electrochemical impedance spectroscopy (EIS) in Fig. 3e. Among them, the arch expresses the charge transfer resistance of the redox reaction, and the resistance value therein is in inverse proportional to the rate of the electrocatalytic reaction. The smallest charge transfer resistance of H-4 shown in Fig. 3e means that it has the fastest OER rate and the best charge transfer capability. The LSV curves in Fig. 3f compares the OER performance after 1000 cycles and before, where the η50 has only increased by 11 mV during this process. Moreover, as we can see from the inset of Fig. 3f, the activity of the heterostructure is slightly weakened for the first 5 hours of continuous electrolysis, but the activity remains almost unchanged in the subsequent 15 hours. In short, the heterostructure H-4 has a relatively superior stability in the OER catalytic process. Compared with the pure phase samples, the abundant active sites of Co9S8@CoS2 can enhance the contact area with the electrolyte and the electronic effect of the heterogeneous interface, which makes the heterojunction exhibiting lower overpotential, smaller Tafel slope and superior stability.
For the sake of further eliminate the influence of annealing temperature on enhanced electrocatalytic performance, we degraded CoS2 under pure argon. Fig. S2† shows the XRD pattern of samples A-0, A-3, A-4, and A-5, where they all show pure phase CoS2 (JCPDS-no. 41-1471) structure without impurity diffraction peaks. Fig. 4 presents the OER catalytic performance of them. Interestingly, their OER performance has not improved or even decreased during the annealing process of pure argon at different temperatures, further proving hydrogen etching has made a decisive contribution to produce Co9S8@CoS2 heterostructure and thus increased electrocatalytic activity.
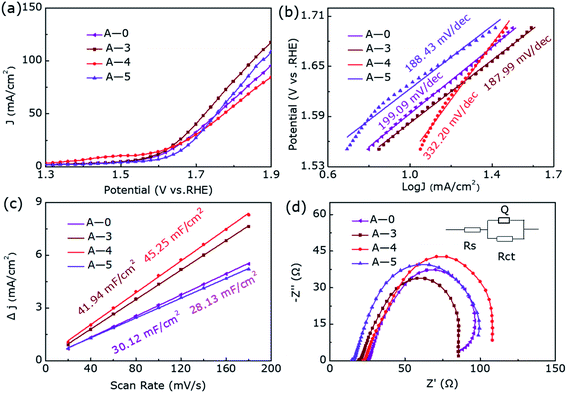 | ||
| Fig. 4 (a) The LSV curves, (b) Tafel plots, (c) the Cdl and (d) EIS Nyquist plots of A-0, A-3, A-4 and A-5 for OER. | ||
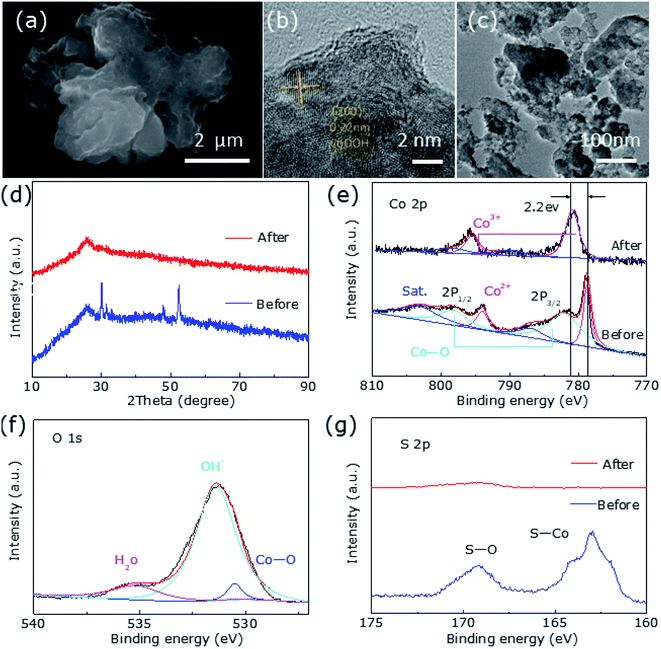
Fig. 5a shows the significant changes in surface morphology of the sample after a long-term OER durability test. It can be clearly found that its morphology is irregular spherical and has a lot of holes, possibly because of the leaching of ‘S’ element during the OER progress. The HRTEM image discloses the phase transformation of Co9S8@CoS2 to CoOOH (Fig. 5b) and a fringe spacing is measured as 0.22 nm, indicating the (200) plane of CoOOH. The underlying cyclically induced Co9S8@CoS2 heterostructural transformation to CoOOH and the leaching of ‘S’ is responsible for the morphological changes.
Characteristic peaks for CoOOH were not detected in the post-OER XRD profile (Fig. 5d), which may be due to the low content of CoOOH. However, XPS results confirm the presence of CoOOH. The intensity of S 2p is significantly reduced and almost negligible after the OER durability test (Fig. 5g). Fig. 5e shows that the Co 2p spectrum are deconvoluted into two unequal trait peaks of Co 2p3/2 (780.9 eV) and Co 2p1/2 (795.5 eV), respectively, which shift to high binding energy because of the formation of Co3+ in CoOOH. As shown in Fig. 5f, two peaks corresponded to Co–O (530.5 eV) and OH− (531.4 eV), respectively.31 Fig. 6a provides EDX element mapping images of chemical composition of the in situ derived CoOOH. It can be found that various elements are evenly distributed but the oxygen content has increased significantly and the signature of ‘S’ has almost disappeared and cannot be detected, where this result can also be confirmed in Fig. 6b. The electrochemical conversion of transition metal chalcogenides in the OER process at alkaline pH has been fully demonstrated in the literature.31 It is known that transition metal chalcogenides undergo chemical conversion to their corresponding metal oxyhydroxides during OER.41 The transition metal chalcogenides only are pre-catalyst and the oxyhydroxide catalyst produced in situ is said to be the actual catalyst.40,42 In this article, the Co9S8@CoS2 heterostructure has undergone the conversion to CoOOH, and the oxyhydroxide generated in situ catalyzes OER.
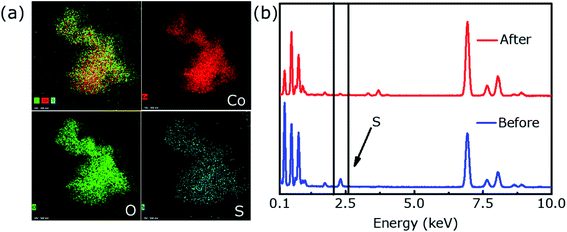 | ||
| Fig. 6 (a) The energy dispersive X-ray (EDX) mappings of H-4 after the OER durability test and (b) EDS spectral profiles show elemental composition of the hybrid before and after OER. | ||
Experimental
Synthesis
We compounded pristine CoS2 by hydrothermal method, in which (Co(NO3)2·6H2O) was the precursor of Co, and (Na2S2O·5H2O) was the precursor of S. First of all, (2.5 mmol) Co(NO3)2·6H2O and (2.5 mmol) Na2S2O·5H2O were added to 60 mL of distilled water and agitated about 1 h. Next, transferring the solution to a 100 mL Teflon-lined stainless autoclaves, putting it into a drying oven, setting the temperature at 170 °C for 12 h. When the reaction is over and the temperature is below 25 °C, taking it out, washing it with absolute ethanol and distilled water for several times, finally it was dried in the oven at 60 °C for about 12 h. Then, the as-prepared CoS2 (100 mg) samples were annealed in a tube furnace under H2/Ar mixture gas (5 vol% in H2) at 300, 400 and 500 °C for 2 h, respectively. In the end, we acquired four black powder samples that were labeled as H-0, H-3, H-4 and H-5 according to different annealing temperature. Besides, the samples annealed under pure Ar were prepared in the same way, which were labeled as A-0, A-3, A-4 and A-5, respectively.Materials characterizations
The X-ray diffraction (X'pert pro) and Raman spectrometer (LabRAM HR Evolution) in the wavenumber of 100–900 cm−1 whose wavelength of the excited laser is 532 nm were used to study the phase and crystal structure of samples. The valence state of the elements in the samples were obtained by X-ray photoelectron spectroscopy (Kratos AXIS Ultra DLD) systems. Besides, the surface morphology and atomic structure of the samples were analyzed by scanning electron microscopy (Apreo S) and transmission electron microscopy (Tecnai F30). Through the EDX attached to the TEM, we obtained the samples' elemental mappings.Electrochemical measurements
The electrochemical performance was tested using an electrochemical workstation (CHI 660E) and a typical three-electrode with 1 M KOH electrolyte. The glassy carbon electrode loaded with the sample is the working electrode (0.071 cm2), platinum foil is used as a counter electrode and Ag/AgCl (or Hg/HgO) is used as the contrast electrode. For the preparation of working electrode, carbon (20 mg) and samples (20 mg) were mixed into petroleum ether, then sonicated for about 3 hours and dried in a 60 °C thermostat. After completely drying, 6 mg of the mixture with 30 μL Nafion and 1470 μL DMF to form well-proportioned slurry. Finally, we loaded the slurry onto glassy carbon electrode with 9 μL, and then left to dry completely. On the basis of the Nernst equation {ERHE = EAg/AgCl + 0.197 + 0.059 × pH}, the measured potentials were all revised by RHE. All OER tests were performed in 1 M KOH solution at routine temperature.Calculated electrochemical active surface area (ECSA)
Here, Cs is specific electrochemical double-layer capacitance and its value in alkaline media is 0.040 mF cm−2, and the Sgeo represents the geometric surface area of the working electrode (0.071 cm2).
Conclusions
In summary, we prepared Co9S8@CoS2 heterojunction by hydrogen etching CoS2, which has excellent OER electrocatalytic performance. Compared with a single component, the heterojunction enhances the electrocatalytic activity of OER. The well-dispersed nano-spherical morphology, rough surface, electronic interaction between chemically coupled CoS2 and Co9S8 are the reasons for the enhanced electrocatalytic activity. The optimized Co9S8@CoS2 heterojunction shows a low η50 (396 mV) and a smaller Tafel slope (181.61 mV dec−1) and excellent long-term stability. This discovery provides a reasonable strategy to boost the electrocatalytic performance of CoS2, and this method provides a new way to enhance the OER performance of similar transition metal halides.Conflicts of interest
There are no conflicts to declare.Acknowledgements
This work was financially supported by the Natural Science Foundation of Gansu Province, China (Grant No. 20JR5RA303 and No. 20JR10RA648), National Natural Science Foundation of China (Grant No. 12004146) and Fundamental Research Funds for the Central Universities (Grant No. LZUMMM2020007 and lzujbky-2020-pd07).Notes and references
- H.-F. Wang and Q. Xu, Matter, 2019, 1, 565–595 CrossRef CAS.
- S. Niu, W. J. Jiang, Z. Wei, T. Tang, J. Ma, J. S. Hu and L. J. Wan, J. Am. Chem. Soc., 2019, 141, 7005–7013 CrossRef CAS PubMed.
- P. Chen, K. Xu, S. Tao, T. Zhou, Y. Tong, H. Ding, L. Zhang, W. Chu, C. Wu and Y. Xie, Adv. Mater., 2016, 28, 7527–7532 CrossRef CAS PubMed.
- C. L. Hu, L. Zhang and J. L. Gong, Energy Environ. Sci., 2019, 12, 2620–2645 RSC.
- N. Kornienko, J. Resasco, N. Becknell, C. M. Jiang, Y. S. Liu, K. Nie, X. Sun, J. Guo, S. R. Leone and P. Yang, J. Am. Chem. Soc., 2015, 137, 7448–7455 CrossRef CAS PubMed.
- L. Liu, D. Li, H. Zhao, A. Dimitrova, L. Li, Y. Fang, S. Krischok, W. Shi and Y. Lei, Appl. Catal., B, 2019, 244, 87–95 CrossRef CAS.
- H. Jin, C. Guo, X. Liu, J. Liu, A. Vasileff, Y. Jiao, Y. Zheng and S. Z. Qiao, Chem. Rev., 2018, 118, 6337–6408 CrossRef CAS PubMed.
- Q. Zhang, W. J. Han, Z. X. Xu, Y. L. Li, L. Chen, Z. Y. Bai, L. Yang and X. L. Wang, RSC Adv., 2020, 10, 27788–27793 RSC.
- J. Jana, K. C. Bhamu, Y.-L. T. Ngo, S. G. Kang, J. S. Chung and S. H. Hur, Appl. Surf. Sci., 2021, 562, 150253 CrossRef CAS.
- H. Xu, H. Shang, J. Di and Y. Du, Inorg. Chem., 2019, 58, 15433–15442 CrossRef CAS PubMed.
- S. Hao, L. Chen, C. Yu, B. Yang, Z. Li, Y. Hou, L. Lei and X. Zhang, ACS Energy Lett., 2019, 4, 952–959 CrossRef CAS.
- A. Dutta, A. K. Samantara, S. K. Dutta, B. K. Jena and N. Pradhan, ACS Energy Lett., 2016, 1(1), 169–174 CrossRef CAS.
- H. H. Zeng, X. Y. Liu, F. B. Chen, Z. G. Chen, X. L. Fan and W. Lau, ACS Appl. Mater. Interfaces, 2020, 12(47), 52549–52559 CrossRef CAS PubMed.
- L. S. Peng, S. S. A. Shah and Z. D. Wei, Chin. J. Catal., 2018, 39, 1575–1593 CrossRef CAS.
- D. C. Chen, Z. W. Chen, Z. L. Lu, X. X. Zhang, J. Tang and C. V. Singh, Nanoscale, 2020, 12, 18721–18732 RSC.
- Y. Y. Guo, Q. Huang, J. Y. Ding, L. Zhong, T.-T. Li, J. Q. Pan, Y. Hu, J. J. Qian and S. S. Huang, Int. J. Hydrogen Energy, 2021, 46, 22268–22276 CrossRef CAS.
- J. P. Chen, B. W. Ren, H. Cui and C. X. Wang, Small, 2020, 16, 1907556 CrossRef CAS PubMed.
- A. Mishra, A. Mehta, S. Basu, N. P. Shetti, K. R. Reddy and T. M. Aminabhavi, Carbon, 2019, 149, 693–721 CrossRef CAS.
- H. W. Zhang, Y. X. Lu, B. Li, G. F. Huang, F. Zeng, Y. Y. Li, A. L. Pan, Y. F. Chai and W. Q. Huang, J. Mater. Sci. Technol., 2021, 86, 210–218 CrossRef.
- L. Q. Wu, D. D. Shi, S. M. Yan, W. Qiao, W. Zhong and Y. W. Du, Int. J. Hydrogen Energy, 2021, 46, 2086–2094 CrossRef CAS.
- Y. N. Guan, G. H. Liu, J. D. Li, Y. J. Wang and Z. S. Zhang, Nanotechnology, 2019, 30, 495406 CrossRef CAS PubMed.
- Y. Zhao, C. K. Mavrokefalos, P. Zhang, R. Erni, J. Li, C. A. Triana and G. R. Patzke, Chem. Mater., 2020, 32, 1371–1383 CrossRef CAS.
- J. Nai, Y. Lu and X.-Y. Yu, J. Mater. Chem. A, 2018, 6, 21891–21895 RSC.
- R. Guo, S. Q. Zhang, H. Wen, Z. Y. Ni, Y. He, T. Yu and J. H. You, New J. Chem., 2021, 45, 1887–1892 RSC.
- Y. F. Feng, S. J. Wang, H. Y. Wang, Y. J. Zhong and Y. Hu, J. Mater. Sci., 2020, 55, 13927–13937 CrossRef CAS.
- Y. Zhan, S. Z. Yu, S. H. Luo, J. Feng and Q. Wang, ACS Appl. Mater. Interfaces, 2021, 13(15), 17658–17667 CrossRef CAS PubMed.
- Y. X. Zhang, C. Zhang, Y. M. Guo, D. L. Liu, Y. F. Yu and B. Zhang, J. Mater. Chem. A, 2019, 7, 2536–2540 RSC.
- Y. P. Tang, F. Jing, Z. X. Xu, F. Zhang, Y. Y. Mai and D. Q. Wu, ACS Appl. Mater. Interfaces, 2017, 9(14), 12340–12347 CrossRef CAS PubMed.
- X. C. Cao, X. J. Zheng, J. H. Tian, C. Jin, K. Ke and R. Z. Yang, Electrochim. Acta, 2016, 191, 776–783 CrossRef CAS.
- J. X. Zhang, L. H. Zhang, L. Du, H. L. L. Xin, J. B. Goodenough and Z. M. Cui, Angew. Chem., Int. Ed., 2020, 59, 17488–17493 CrossRef CAS PubMed.
- S. Chakrabartty, S. Karmakar and C. R. Raj, ACS Appl. Nano Mater., 2020, 3, 11326–11334 CrossRef CAS.
- Y. Pan, Y. N. Fang, H. N. Jin, M. Zhang, L. N. Wang, S. J. Ma, H. Zhu and M. L. Du, Electrocatalysis, 2019, 10, 253–261 CrossRef CAS.
- S. J. Deng, S. G. Shen, Y. Zhong, K. L. Zhang, J. B. Wu, X. L. Wang, X. H. Xia and J. P. Tu, J. Energy Chem., 2017, 26, 1203–1209 CrossRef.
- G. Y. Zhou, X. M. Wu, Mi. M. Zhao, H. Pang, L. Xu, J. Yang and Y. W. Tang, ChemSusChem, 2021, 4, 699–708 CrossRef PubMed.
- X. Dong, Y. Q. Jiao, G. C. Yang, H. J. Yan, A. P. Wu, D. Z. Guo, Y. Wang, C. G. Tian and H. G. Fu, Sci. China Mater., 2021, 64, 1396–1407 CrossRef CAS.
- J. Y. Zhang, B. R. Xiao, X. L. Liu, P. T. Liu, P. X. Xi, W. Xiao, J. Ding, D. Q. Gao and D. S. Xue, J. Mater. Chem. A, 2017, 5, 17601 RSC.
- N. Huang, S. F. Yan, L. Yang, M. Y. Zhang, P. P. Sun, X. W. Lv and X. H. Sun, J. Solid State Chem., 2020, 285, 121185 CrossRef CAS.
- F. Liu, W. J. He, Y. Li, F. Q. Wang, J. Y. Zhang, X. W. Xu, Y. M. Xue, C. C. Tang, H. Liu and J. Zhang, Appl. Surf. Sci., 2021, 546, 149101 CrossRef CAS.
- J. Zhang, T. Wang, D. Pohl, B. Rellinghaus, R. H. Dong, S. H. Liu, X. D. Zhuang and X. L. Feng, Angew. Chem., 2016, 128, 6814–6819 CrossRef.
- W. Chen, Y. Y. Liu, Y. Z. Li, J. Sun, Y. C. Qiu, C. Liu, G. M. Zhou and Y. Cui, Nano Lett., 2016, 16, 7588–7596 CrossRef CAS PubMed.
- K. Fan, H. Y. Zou, Y. Lu, H. Chen, F. S. Li, J. X. Liu, L. C. Sun, L. P. Tong, M. F. Toney, M. L. Sui and J. G. Yu, ACS Nano, 2018, 12, 12369–12379 CrossRef CAS PubMed.
- W. Li, D. H. Xiong, X. F. Gao and L. F. Liu, Chem. Commun., 2019, 55, 8744–8763 RSC.
Footnote |
| † Electronic supplementary information (ESI) available. See DOI: 10.1039/d1ra05677h |
| This journal is © The Royal Society of Chemistry 2021 |

