 Open Access Article
Highly sensitive optical temperature sensing based on pump-power-dependent upconversion luminescence in LiZnPO4:Yb3+–Er3+/Ho3+ phosphors†
Kamel Saidi *a,
Wajdi Chaabanib and
Mohamed Dammak
 a
a
aLaboratoire de Physique Appliquée, Groupe des Matériaux Luminescents, Faculté des Sciences de Sfax, Département de Physique, Université de Sfax, Sfax, BP 1171, Tunisia. E-mail: saidikamel494@gmail.com
bLaboratoire de Physique des Solides, CNRS, Université Paris-Saclay, Orsay 91405, France
First published on 17th September 2021
Abstract
In this work, various LiZnPO4:0.5 mol% Ln3+ (Ln = Ho, Er) phosphors with different Yb3+ ion doping concentrations were synthesized by a sol–gel/Pechini method. X-ray diffraction (XRD) and scanning electron microscope (SEM) techniques were used to evaluate the phase and morphology of the samples. The UC process was mentioned as the typical emission peaks of Er3+ and Ho3+. For Er3+ and Ho3+, different optical temperature sensing methods are included. The Boltzmann distribution was accompanied by the fluorescence intensity ratio (FIR) for the two green Er3+ emissions originating from thermally-coupled levels. The effect of pump power on sensor sensitivities was extensively studied. The temperature uncertainty is also evaluated. The red and green emissions generated from non-thermally-coupled levels were used for temperature sensing in the Ho3+-activated LiZnPO4. High sensitivities were obtained in the phosphors, and the LiZnPO4:Yb3+/Ho3+ showed the largest absolute sensitivities. LiZnPO4:Yb3+–Er3+/Ho3+ phosphors may be useful in the development of new luminescent materials for optical temperature sensing.
Introduction
Temperature sensors account for 80% of the global sensor market, owing to their significance in a range of science and industrial applications.1 Compared to traditional contact temperature measures like electrical resistance and thermocouples, which are constrained by reaction time and spatial resolution, non-contact thermometry approaches including Raman spectroscopy and luminescence are gaining traction.2,3 The luminescence-based thermometry, in fact, has a number of benefits, including rapid response, high resolution and precision, and a wide temperature range.4,5 Now, thermometry reliant on emission line intensity, bandwidth, spectral line direction, increase or decay life of the exciting polarization stage is used.6–9 The most widely used technique is temperature-induced variations in luminescence intensity ratio (FIR) between two thermally coupled energy levels.4,10 In particular, the lanthanide (Ln) particles doped upconversion (UC) phosphors are famously utilized for the FIR strategy. As it is well known, lanthanide ions have a unique electronic structure and are excellent discovery materials due to the advantages of their large Stokes decalage, their net emission profiles, and their long fluorescence lifetime.11,12 The traditional activator ions for UC Luminescence (UCL) are Er3+, Ho3+, Tb3+ and Tm3+.6,13–15 Because of its large absorption portion about 980 nm, the Yb3+ ion is commonly used as a sensitizer to increase anti-stocks emissions.16,17 On the basis of the rare-earth doped UCL materials, two strategies established to realize the FIR technique, containing thermally coupled levels (TCLs) and non-thermally-coupled levels (NTCLs). On the one side, two (TCLs) of activator ions are used, the populations of which obey the Boltzmann distribution, and their energy gaps are habitually in the range of 200–2000 cm−1, such as Er3+, Eu3+, Dy3+, Nd3+, Mn4+ and so on.18–24 However, since the energy gap between two TCLs is restricted, growing the relative sensitivity of an activator is hard. The second approach, which uses NTCLs of single or couple activators to overcome this problem, is being studied. Various luminescent ions of this class have been acquired, such Ho3+, Pr3+, and Tm3+.25–28On the basis of the above points, new luminescent materials with high-temperature sensor sensitivity need to be explored urgently. To develop new inorganic phosphor materials of more excellent temperature-sensing characteristics, continuous researches are still highly solicited. Apart from quantum dots and fluoride-based luminescent materials for optical temperature sensing.29 In the previous reports, the properties of LiZnPO4 phosphors doped rare-earth ions have been studied by some researchers.30–32 To the best of our knowledge, the UC luminescence properties and optical temperature characteristics of Er3+/Yb3+ and Ho3+/Yb3+ in this host lattice have not been discussed so far, there has been no study into the Er3+ and Ho3+ activated LiZnPO4 phosphors used for optical thermometry.
In this work, the LiZnPO4 was chosen as the matrix due to its simple preparation, great physical stability, and environmental friendliness. The Er3+ and Ho3+ ions were used as the activators, and Yb3+ was employed as a sensitizer. The UC photoluminescence emission spectra excited by 980 nm NIR radiation and the sensitivities for temperature sensing were studied.
Experimental
Materials
To synthesize the LiZnPO4 phosphors, we have used: lithium carbonate (Li2CO3, 99.5%, Rankem Reagent), zinc oxide (ZnO, 99.0%, Rankem Reagent), ammonium dihydrogen phosphate (NH4)2H2PO4, 98.5%, E-Merck), erbium oxide (Er2O3, GR 99.99%), europium oxide (Ho2O3, 99.99%), ytterbium oxide (Yb2O3, 99.99%, nitric acid HNO3 (69%).Synthesis procedure
LiZnPO4 nanosized phosphors were prepared by sol–gel method. The balanced method of the chemical composition and reaction used to prepare the host LiZnPO4 from the starting material is as follows:| Li2CO3 + ZnO + (NH4)2H2PO4 → 2LiZnPO4 + 2NH3↑ + CO2↑ + 3H2O |
Firstly, the nitrates of all the oxides were obtained by dissolution in nitric acid. All solutions were added one by one in a glass beaker and kept for stirring at a constant rate. 0.1 M solution of polyethylene glycol (PEG) and citric acid solution were added to the above solution. The entire solution was kept for stirring and heating at 80 °C until the solution hydrolyzed into a sol and later on into a gel. The gel was kept for drying in an oven at 120 °C and the gel transformed into a dry dark brownish precursor. This procedure was followed for the preparation of all the phosphor samples in the series. The dark brownish precursors were transferred into porcelain crucibles and then heated in a muffle furnace at 600 °C for 1 h. Finally, it was put into alumina crucibles and burned in an electric furnace at the required temperatures for 3 h at 800 °C.
Characterization
The phosphors were measured in the 2θ range of 10–70° on an X-ray diffractometer (Bruker D8, Germany) with Cu Kα radiation (1.5405 Å), working at 40 kV and 30 mA for phase detection. The FT-IR spectrum for the titled compound was recorded at room temperature using a PerkinElmer Spectrum 1000 FT-IR spectrometer in the 400–4000 cm−1 range. A UV-vis-NIR spectrometer (PerkinElmer Lambda 950) was used to measure UV-vis-NIR absorption. The samples morphologies were studied using the Zeiss Supra 55VP SEM-FEG scanning electron microscope (SEM) with an accelerating voltage of 2–8 kV, equipped with a Bruker XFlash 5030 to study the elemental composition via energy dispersive X-ray spectroscopy (EDS). A JOBIN YVON HR 320 spectrometer with a temperature controller and a 980 nm laser excitation source was used to investigate temperature-dependent UC emissions. The sample temperature was controlled to be in the 300–440 K range by using a helium closed-cycle cryostat and a Lake Shore 321 temperature controller. The decay times were recorded on fluorescence spectrometer (Edinburgh FLS 980) equipped with a 980 nm laser source.Results and discussion
XRD analysis
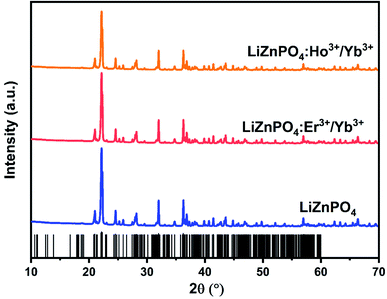
Fig. 1 exhibits the XRD patterns of the typical LiZnPO4, LiZnPO4:0.05% Er3+/5% Yb3+, LiZnPO4:0.05% Ho3+/3% Yb3+. The standard XRD data of LiZnPO4 were built with ICSD. The XRD pattern showed no additional peaks, suggesting that the prepared phosphors were produced in a single phase. These reflections show that the samples are well indexed to LiZnPO4 and belong to a monoclinic process with the C1c1 space group.33 The plane corresponds to the most extreme diffraction peak (004). Other important diffractions peaks are assigned at (311), (−223), (402), (204), (−225), (−330), (−516). The effective ionic radii of the Li+, Zn2+, P5+, Er3+, Ho3+ and Yb3+ ions are 102 pm, 74 pm, 38 pm, 89 pm, 94.7 pm and 86.8 pm respectively.34,35 The dopant ions such as Er3+, Ho3+ and Yb3+ are supposed to occupy the LiZnPO4 lattice to substitute Zn2+ ions. There were no detectable impurities due to the low doping concentration.Morphological analysis
Fig. 2a displays the morphology of a LiZnPO4 powder sample. The slightly aggregated particles have irregular shapes and a small size range of 0.5–1 μm, which is favorable for enhancing its PL properties, which is also similar to the results obtained for the sample LiZnPO4:0.5% Er3+/5% Yb3+ and LiZnPO4:0.5% Ho3+/3% Yb3+ in Fig. S1a and S2a† respectively. In addition, the elemental composition of a selected area shown in Fig. 2b is identified by the EDS elemental mapping and the results are represented in Fig. 2c. As can be seen, Zn, P, and O elements are uniformly distributed throughout the selected area. The light element Li was not detected in the all phosphors. To confirm the presence and relatively uniform distribution of Er3+, Ho3+, and Yb3+ element in the phosphors. The results of EDS spectrum and elemental mapping measurement of Er3+, Ho3+, and Yb3+ element in the phosphors is shown in Fig. S1 and S2,† which further confirms that the LiZnPO4:0.5% Er3+/5% Yb3+ and 0.5% Ho3+/3% Yb3+ were successfully prepared and lanthanide ions have doped the host matrix uniformly.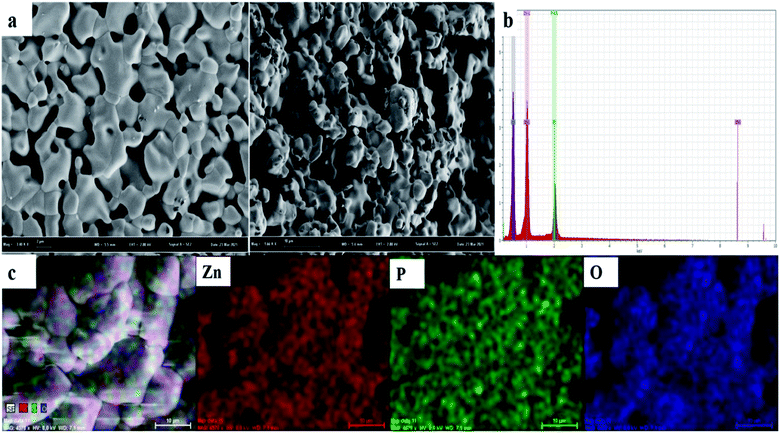 | ||
| Fig. 2 LiZnPO4 (a) SEM microscopic morphology image, (b) EDX spectrum, and (c) elemental mapping graphs. | ||
FTIR
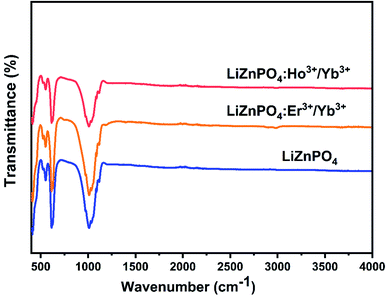
The FTIR spectra for the phosphors in the 400–4000 cm−1 spectral range are seen in Fig. 3. The non-doped and co doped 0.5% Er3+/5% Yb3+, LiZnPO4:0.5% Ho3+/3% Yb3+ nanophosphors have extreme bands peaking at 1100–960 cm−1, which are assigned to the asymmetrical and symmetrical stretching modes of the P–O bond, respectively. The spectrum displayed a weak absorption band in the range 520–630 cm−1 which arises due to the P–O vibration mode.36–38 The dopant of RE ions had little impact on the main structure of the matrix, according to the non-doped/co-doped FTIR spectra of several doped ions, which was compatible with the XRD data.Optical characterization
| (F(R) × hν)n = C(hν − Eg) | (1) |
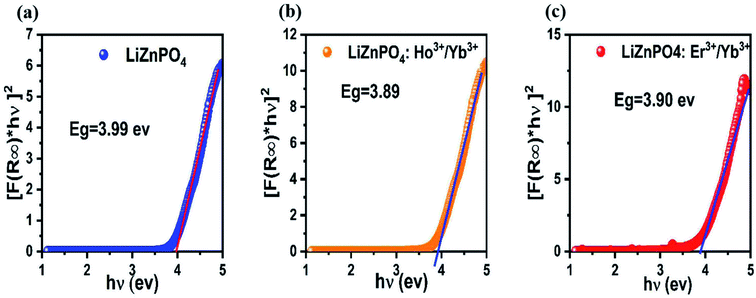 | ||
| Fig. 4 Plot of [F(R) × hν]2 versus hν for the band gap energy of LiZnPO4, LiZnPO4:Ho3+/Yb3+ and LiZnPO4:Er3+/Yb3+. | ||
The different crystalline morphology and size of the material based on different lanthanide ions could explain the differences in energy band gap values found for the doped and undoped phosphors.42,43 This may also be explained by the presence of the Ho3+, Er3+ and Yb3+ ions, which cause many defects in LiZnPO4, inducing additional energy levels in the material band gap, so as to reduce the energy gap.
Concentration dependence of UCL
| τ = (I1 × τ12 + I2 × τ22)/(I1 × τ1 + I2 × τ2) | (2) |
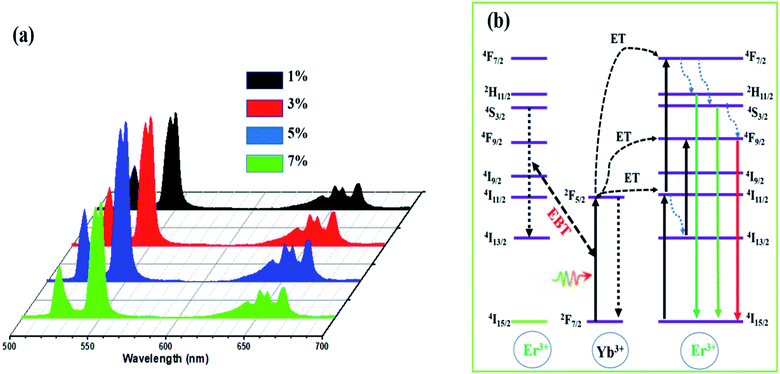
On the basis of the fitting results, the average decay time for the LiZnPO4:Er3+/x Yb3+ crystals was revealed to be 190.34, 153.96, 125.56, and 83.18 μs, when the Yb3+ ion concentration was 1, 3, 5, and 7 mol%, respectively. The decreased in decay time value demonstrated the existence of EBT from Er3+ to Yb3+.
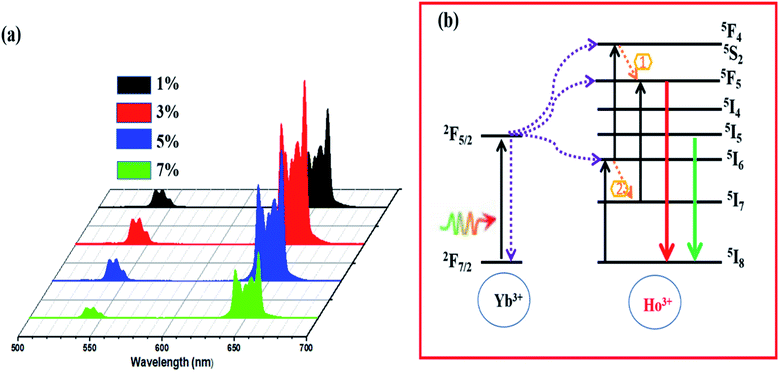
Fig. 6a demonstrates the UC emission spectra of the LiZnPO4 0.5% Ho3+/y% Yb3+ (1% ≤ y ≤ 7%) phosphors upon 980 nm excitation. All Ho3+/Yb3+ codoped LiZnPO4 phosphors released heavy red UC emissions. The emission bands at approximately 520–560 nm and 645–675 nm was assigned to (5F4, 5S2) → 5I8, and 5F5 → 5I8, respectively. Both emission bands were in excellent accordance with previous researches on many other Ho3+ doped compounds.40,49,50 The 5F5 → 5I8 transition had the highest red emission of the two emission bands, resulting in a heavy red emission in Ho3+/Yb3+ codoped LiZnPO4 phosphors. The UC emission rate rose gradually with a Yb3+ rising concentration, reaching a height when the concentration of Yb3+ (x = 3 mol%) was 6 times than that of Ho3+. The emission rate minimized when the Yb3+ concentration passed this critical value (x = 3 mol%). The UCL intensity diminishes owing to either the concentration quenching effect or the energy back transfer (EBT) mechanism from Yb3+ to Ho3+.51–54 Fig. 6b shows the energy level diagram of Yb3+–Ho3+ in the LiZnPO4 host. The detailed UCL process has been discussed in the recent work.52 To have a better understanding of the mechanism of the UC emission process in Ho3+/Yb3+ co-doped LiZnPO4 phosphor, the normalized decay curves were presented in Fig. S5.† Using (eqn (2)), the average lifetime of LiZnPO4:0.5% Ho3+/y% Yb3+ (y = 1, 3, 5, and 7) from decay curves are estimed to be 81.35, 48.86, 33.44, and 19.42, respectively. This decrease is caused by the possibility of energy back-transfer (EBT) from Ho3+ to Yb3+, which significantly improves the depopulation of the 5F4, 5S2 level and shortens the lifetime.
Power dependence of UCL and luminescence mechanisms
To gain a better understanding of UCL processes and mechanisms, we investigate the relationship between up-conversion luminescence intensity (IUC) and excitation power (P). The emission spectra of the LiZnPO4:0.5% Er3+/5% Yb3+ and LiZnPO4:0.5% Ho3+/3% Yb3+ sample as a function of excitation power are shown in Fig. 7a and b. With increased pump power, both green and red emissions for Er3+ and Ho3+ improve noticeably. The relationship between the UCL intensity (IUC) and the pump power (P) is widely agreed to be as follows:55| IUC ∝ Pn | (3) |
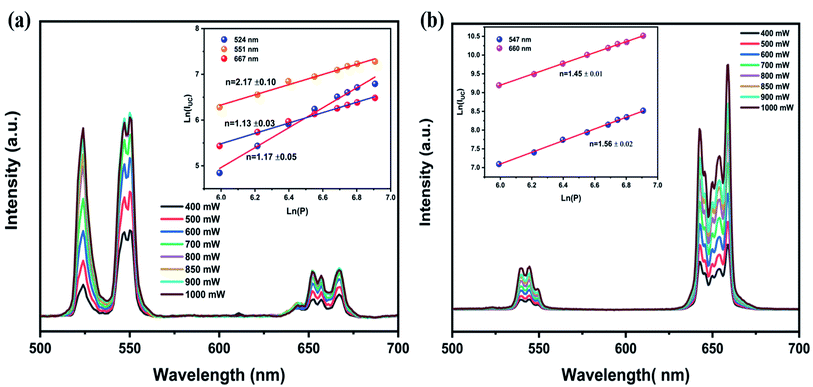 | ||
| Fig. 7 Represents the variation UC emission at different pump powers, inset shows the dependences of ln(IUC) on ln(P): (a) for LiZnPO4:Er3+, Yb3+. (b) For LiZnPO4:Ho3+/Yb3+. | ||
Temperature sensing properties
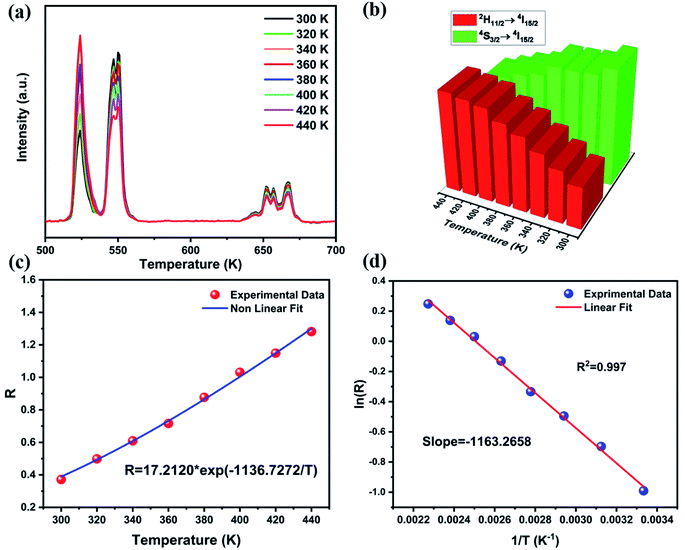
The UC emission spectra were reported at different temperatures from 300 to 440 K upon 980 nm excitation at 450 mW to investigate the optical thermal sensing behavior of LiZnPO4:Yb3+/Er3+ and exposed as Fig. 8a. The emission spectra change in lockstep with temperature, with the emission intensity of the 4S3/2 → 4I15/2 transition decreasing while the emission intensity of the 2H11/2 → 4I15/2 transition increasing as show in Fig. 8b. The 2H11/2 and 2S3/2 are the two thermally coupled levels.As temperature of the phosphor sample increases, the overall emission intensity of the 521 and 554 nm emission bands decreases due to thermal quenching related to the increase of the ions lattice vibrations and thus non-radiative transitions. At 440 K, the relative intensity of the two emission bands changes accordingly and the emission intensity of the 521 nm band is larger compared to that of 554 nm band. The emission intensity variation is due to transfer of the excited ions from the lower to the upper thermally coupled levels via the lattice vibrations.56,57
Fig. 8c shows the FIR values of green emissions corresponding to the (2H11/2, 4S3/2) thermally coupled levels to the ground state 4I15/2 transitions, determined from the temperature-dependent PL emission spectra. The fluorescence intensity ratio of the thermally coupled levels emissions displays a remarkable increase with temperature increasing. According to the literature, one knows that the relative population of the thermally coupled levels follow the Boltzmann distribution with R parameter formulated as;58
 | (4) |
Fig. 8d exhibits a monolog plot of the R parameter of LiZnPO4:Er3+/Yb3+ from the 2H11/2 and 4S3/2 levels as a function of inverse absolute temperature in the 300–440 K range as representatives. The slope (−ΔE/k) is a very critical parameter to find the optical temperature sensing ability of the luminescent material. The fitting of the experimental data creates the ΔE value of 808.46 cm −1. This parameter can be affected by several variables, such as particle size, luminescent host lattice, doping concentration, excitation pump energy.59–61 In order to study the influence of pump power on the sensor sensitivity, we looked at how the pump power affected the spectrum properties as a function of temperature. Fig. S6a and d† display UC emission spectra of LiZnPO4 at 850 mW and 1000 mW at different temperatures. The FIR values change dramatically as the temperature rises, as seen in Fig. S6b–e.† Moreover, one notices at a constant temperature, the FIR values increase with the rise of pump power. This finding can be interpreted by the local heat induced by 980 nm laser excitation. This high-powered laser will produce heat in the vicinity of the irradiation light spot in the sample, resulting in a temperature differential between the light spot and other regions. Fig. S6c and f† exhibit the ΔE values of 579.20 and 505.02 cm−1 for 850 and 1000 mW, respectively. Due to the presence of the local heat effect induced by the laser, we obtain a large difference value of ΔE compared to 808 cm−1. According to the above study, the UC spectra excited at 450 mW causes the littlest heat effect, so it can be used for use in precise temperature sensing.
The sensor sensitivity of a temperature-sensing luminescent material is a critical factor in determining its application potential. According to ref. 62, absolute sensitivity (SA) and relative sensitivity (SR) can be determined using the following equation:
| SA(T) = R × dR/dT | (5) |
| SR(T) = 100 × dR/dT | (6) |
According to the fitting results in Fig. 8b and S6† the absolute and relative sensitivities of LiZnPO4:5% Yb3+, 0.5% Er3+ for various pump powers were measured. Fig. 9a represents the absolute sensitivity as a function of temperature under pump powers of 450, 850, and 1000 mW. Based on the above results, it can be assumed that the energy difference ΔE and the constant D have a significant influence on the temperature detection range of the sensor.
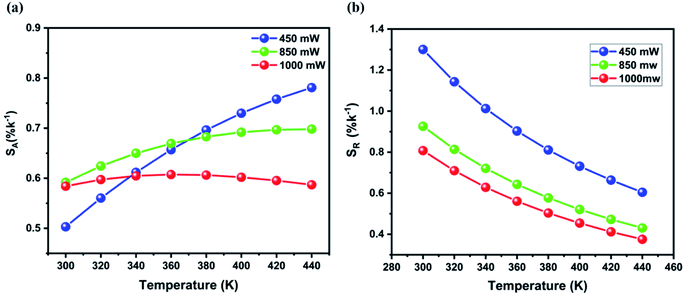 | ||
| Fig. 9 (a) Absolute and (b) relative sensitivities of LiZnPO4:Er3+/Yb3+ as a function of temperature under different pump powers. | ||
The highest values of SA are obtained to be about 0.614 (440 K), 0.658 (400 K), 0.620 (360 K) for 450, 850, and 1000 mW, respectively. Furthermore, the temperature value (Tmax) with the highest sensitivity can be derived from eqn (3) by setting dSA/dT to zero, as following formula:
| Tmax = ΔE/2KB | (7) |
The high sensitivity maximum value SAmax and the high temperature value Tmax at various pump power are summarized in Table 1. Owing to the small range of temperature variation in the current study up to 440 K, the maximum has not been traced absolutely at 450 mW, but the maximum is predicted to occur at a much higher temperature. Furthermore, it's important to note that as pump power increases, the temperature at which the highest SA value is found to decreases. The local heat effect also contributes to these phenomena.
| Pump power | SAmax (% K−1) | Tmax (K) |
|---|---|---|
| 450 mW | 0.801 | 581 |
| 850 mW | 0.691 | 416 |
| 1000 mW | 0.594 | 363 |
Fig. 9b displays the relative sensitivities of the LiZnPO4:5% Yb3+, 0.05% Er3+ as a function of temperature under different pump powers. It can be noted that the relative sensitivity decreases with increasing temperatures for all pump powers, which is beneficial to the performance of temperature sensing applications. The best relative sensitivity is obtained upon 450 mW pump power. On the basis of the above study, it can be concluded that lower pump power is more advantageous to achieving higher overall sensitivity. The Er3+/Yb3+ co-doped LiZnPO4 sample exhibits a high relative sensitivity to a few reported temperature-sensing luminescent materials. Table 2 illustrated the optical temperature-sensing of Er3+/Yb3+ co-doped other luminescent materials. In comparison with various phosphate matrices, a favorite result was achieved in the LiZnPO4 co-doped Er3+/Yb3+. Furthermore, the sensitivity of the resultant was higher than the previously developed thermometer.
| Ln-ion | Matrix | Transitions | SA (K−1) | SR (% K−1) | Ref. |
|---|---|---|---|---|---|
| Er3+ | K3Y(PO4)2 | 2H11/2/4S3/2 | 0.0034 | 1.2 | 63 |
| Er3+ | Sr3(PO4)2 | 2H11/2/4S3/2 | 0.0060 | 0.88 | 64 |
| Er3+ | NaZnPO4 | 2H11/2/4S3/2 | 0.0047 | 0.39 | 65 |
| Er3+ | Ba4BiF17 | 2H11/2/4S3/2 | 0.0035 | 1.22 | 66 |
| Ho3+ | K3Y(PO4)2 | 5F5/(5F4, 5S2) | 0.078 | 0.20 | 63 |
| Ho3+ | Sr3Y(PO4)3 | 5F5/(5F4, 5S2) | 0.019 | 0.16 | 67 |
| Ho3+ | La9.67Si6O26.5 | 5F5/(5F4, 5S2) | 0.0226 | 0.21 | 68 |
| Er3+ | LiZnPO4 | 2H11/2/4S3/2 | 0.008 | 1.29 | This work |
| Ho3+ | LiZnPO4 | 5F5/(5F4, 5S2) | 0.0229 | 0.278 |
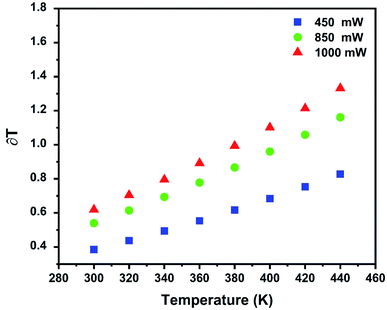
In addition, the equations below can be used to calculate the temperature resolution (T):47
| δT = 1/SR × ΔR/R | (8) |
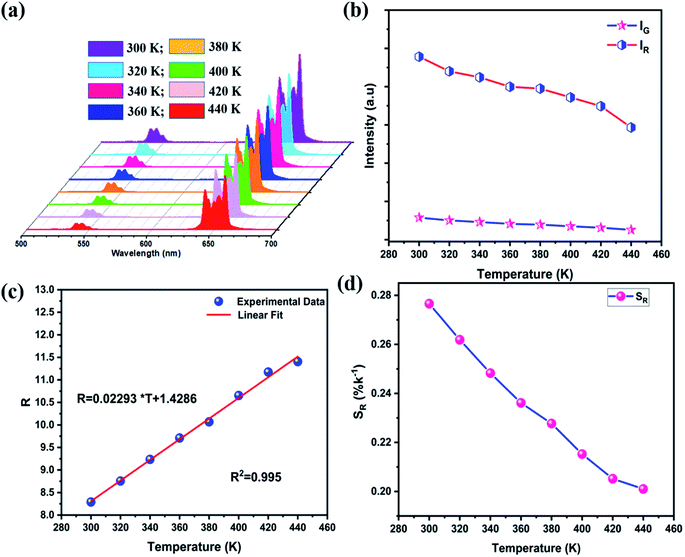
Fig. 11a shows the emission spectra of the standard LiZnPO4:3% Yb3+/0.5% Ho3+ phosphor under 980 nm excitation with 450 mW at different temperatures. By rising temperatures, both green and red emissions are gradually weakened, as can be shown in Fig. 11b, which shows the relative intensity of the 545 and 657 nm emissions as function of temperature. The red emission intensity decreases at a slower rate than the green emission intensity. This may be due to the different population processes on the excitation states for the two emissions, as shown in Fig. 6b, which also show that the non-radiative relaxation (1) from the 5I6 to the 5I7 levels is very significant in the red UC emission phase. The R values dependence on absolute temperature is exhibited in Fig. 11c. The R value increases steadily as the temperature rises from 300 to 440 K, and the fitting of these experimental data yields a linear relationship:
| R = 0.229 × T + 1.429 | (9) |
On the basis of eqn (3), the absolute sensitivity in the whole temperature range around 300 to 440 K is 0.02293 K−1, which is considerably higher than that of many other Er3+/Ho3+ doped luminescent compounds (see Table 2). The relative sensitivity determined by applying eqn (4) at different temperatures is presented in Fig. 11d. When the temperature rises from 300 to 440 K, the SR decreases from 0.278% to 0.201% K−1, respectively. It can be noticed that the SR value is lower than those for Er3+ and higher for Ho3+ in unusual other luminescent materials as displayed in Table 2. Thus, further enhancement of SR is still needed in the Ho3+-activated LiZnPO4 phosphor. Based on the above discussion, the Yb3+–Er3+ co-doped LiZnPO4 phosphor using TCLs exhibits the highest relative sensitivities in this study.
CIE coordinate and lifetime analysis
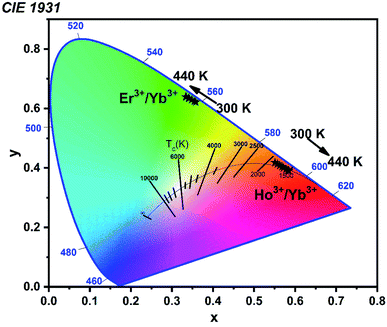
Fig. 12 display the Commission Internationale de l'Eclairclage (CIE) 1931 chromaticity coordinates from the UC emission spectra of Er3+/Yb3+, Ho3+/Yb3+ codoped LiZnPO4 phosphor samples at different temperature (300–440 K). As seen from the CIE diagram, at room temperature (300 K), the yellow color perception with coordinates of (0.36, 0.62) was acquired, and after raising the temperature to 440 K, the color coordinates changed into the green region (0.31, 0.64) for Er3+ doped sample. For Ho3+ doped LiZnPO4 phosphor, chromaticity coordinates shift from orange (0.54, 0.42) to reddish-orange (0.58, 0.38) region with increasing the temperature from 300 to 440 K.Conclusions
In summary, the LiZnPO4:Yb3+–Er3+/Ho3+ samples were prepared by sol–gel/Pechini method, and their luminescence characteristics for optical temperature sensing were investigated. As the RE ions are incorporated into the host lattice, the XRD study shows that the as-prepared samples are all single-phase. The pump-power-dependent UC spectra show that the Er3+/Ho3+ emission peaks in the 500–700 nm range are a two-photon excitation process. Three primary emission peaks for Yb3+–Er3+ doped LiZnPO4 samples appeared in the visible region when excited at 980 nm, and the optimum Yb3+ doping concentration was found to be x = 5%. For the Yb3+–Ho3+ codoped LiZnPO4 samples, two emission peaks of Ho3+ were found, and the optimum Yb3+ doping concentration was found to be x = 3%. The Boltzmann distribution for FIR as a function of absolute temperature was obtained by thermally coupled levels of Er3+ in LiZnPO4:Yb3+/Er3+ phosphor. In comparison with various phosphate matrices, a favorite result was achieved in the LiZnPO4 co-doped Er3+/Yb3+ with SA = 0.008 (K−1) and SR = 1.29 (% K−1). On the other hand, FIR for the red and green emissions of Ho3+ were used to describe the temperature-sensing properties of Yb3+–Ho3+ doped LiZnPO4. The absolute sensitivity in the 300 to 440 K temperature range is 0.02293 K−1, which is considerably higher than that of many other Er3+/Ho3+ doped luminescent compounds. The relative sensitivity SR decreases from 0.278% to 0.201% K−1, by varying the temperature from 300 to 440 K respectively. These results demonstrate that LiZnPO4 doped with Yb3+/Er3+ and Yb3+/Er3+ nanocrystals can be potential candidates for optical temperature sensing applications.Conflicts of interest
There are no conflicts to declare.References
- P. M. Gschwend, F. H. L. Starsich, R. C. Keitel and S. E. Pratsinis, Chem. Commun., 2019, 55, 7147–7150 RSC.
- C. Abram, B. Fond and F. Beyrau, Prog. Energy Combust. Sci., 2018, 64, 93–156 CrossRef.
- I. E. Kolesnikov, M. A. Kurochkin, E. V. Golyeva, D. V. Mamonova, A. A. Kalinichev, E. Yu. Kolesnikov and E. Lähderanta, Phys. Chem. Chem. Phys., 2020, 22, 28183–28190 RSC.
- M. Runowski, P. Woźny, S. Lis, V. Lavín and I. R. Martín, Adv. Mater. Technol., 2020, 5, 1901091 CrossRef CAS.
- X. Li, Y. Yu, J. Hong, Z. Feng, X. Guan, D. Chen and Z. Zheng, J. Lumin., 2020, 219, 116897 CrossRef CAS.
- J. Drabik and L. Marciniak, ACS Appl. Nano Mater., 2020, 3, 3798–3806 CrossRef CAS.
- A. M. Kaczmarek, M. Suta, H. Rijckaert, A. Abalymov, I. Van Driessche, A. G. Skirtach, A. Meijerink and P. Van Der Voort, Adv. Funct. Mater., 2020, 30, 2003101 CrossRef CAS.
- K. Trejgis, K. Maciejewska, A. Bednarkiewicz and L. Marciniak, ACS Appl. Nano Mater., 2020, 3, 4818–4825 CrossRef CAS.
- Y. Jiang, Y. Tong, S. Chen, W. Zhang, F. Hu, R. Wei and H. Guo, Chem. Eng. J., 2020, 127470 Search PubMed.
- A. Shandilya, R. S. Yadav, A. K. Gupta and K. Sreenivas, J. Mater. Sci., 2021, 56, 12716–12731 CrossRef CAS.
- K. Binnemans, Chem. Rev., 2009, 109, 4283–4374 CrossRef CAS PubMed.
- K. Trejgis, A. Bednarkiewicz and L. Marciniak, Nanoscale, 2020, 12, 4667–4675 RSC.
- H. Huang, H. Zhou, J. Zhou, T. Wang, D. Huang, Y. Wu, L. Sun, G. Zhou, J. Zhan and J. Hu, RSC Adv., 2017, 7, 16777–16786 RSC.
- A. Shandilya, R. S. Yadav, A. K. Gupta and K. Sreenivas, Mater. Chem. Phys., 2021, 264, 124441 CrossRef CAS.
- Monika, R. S. Yadav, A. Rai and S. B. Rai, Sci. Rep., 2021, 11, 4148 CrossRef CAS PubMed.
- A. Ishii and T. Miyasaka, Adv. Sci., 2020, 7, 1903142 CrossRef CAS PubMed.
- P. Singh, R. S. Yadav, P. Singh and S. B. Rai, J. Alloys Compd., 2021, 855, 157452 CrossRef CAS.
- K. Panigrahi, S. Saha, S. Sain, R. Chatterjee, A. Das, U. K. Ghorai, N. Sankar Das and K. K. Chattopadhyay, Dalton Trans., 2018, 47, 12228–12242 RSC.
- A. S. Laia, D. A. Hora, M. V. d. S. Rezende, Y. Xing, J. J. Rodrigues, G. S. Maciel and M. A. R. C. Alencar, Chem. Eng. J., 2020, 399, 125742 CrossRef CAS.
- S. Liang, G. Li, P. Dang, Y. Wei, H. Lian and J. Lin, Adv. Opt. Mater., 2019, 7, 1900093 CrossRef.
- J. Xue, M. Song, H. M. Noh, S. H. Park, B. C. Choi, J. H. Kim, J. H. Jeong and P. Du, J. Alloys Compd., 2020, 843, 155858 CrossRef CAS.
- J. Drabik and L. Marciniak, J. Lumin., 2019, 208, 213–217 CrossRef CAS.
- D. He, C. Guo, S. Jiang, N. Zhang, C. Duan, M. Yin and T. Li, RSC Adv., 2015, 5, 1385–1390 RSC.
- I. E. Kolesnikov, A. A. Kalinichev, M. A. Kurochkin, E. Y. Kolesnikov and E. Lähderanta, Mater. Des., 2019, 184, 108188 CrossRef CAS.
- Y. Gao, F. Huang, H. Lin, J. Xu and Y. Wang, Sens. Actuators, B, 2017, 243, 137–143 CrossRef CAS.
- W. Liu, X. Wang, Q. Zhu and J.-G. Li, J. Alloys Compd., 2020, 829, 154563 CrossRef CAS.
- J. Zhang, X. Jiang and Z. Hua, Ind. Eng. Chem. Res., 2018, 57, 7507–7515 CrossRef CAS.
- H. Zhang, Y. Liang, H. Yang, S. Liu, H. Li, Y. Gong, Y. Chen and G. Li, Inorg. Chem., 2020, 59, 14337–14346 CrossRef CAS PubMed.
- H. Dong, L.-D. Sun and C.-H. Yan, Chem. Soc. Rev., 2015, 44, 1608–1634 RSC.
- C. Ouyang, S. Ma, Y. Rao, X. Zhou, X. Zhou and Y. Li, J. Rare Earths, 2012, 30, 637–640 CrossRef CAS.
- X. Xiong, Z. Qiu and P. Li, Mater. Today: Proc., 2020, 22, 2544–2549 CAS.
- S. A. Bhat, S. A. Ul Islam, M. Faizan and M. Ikram, Optik, 2019, 181, 836–841 CrossRef CAS.
- L. Elammari and B. Elouadi, Acta Crystallogr., Sect. C: Cryst. Struct. Commun., 1989, 45, 1864–1867 CrossRef.
- R. Shannon, Acta Crystallogr., Sect. A: Cryst. Phys., Diffr., Theor. Gen. Crystallogr., 1976, 32, 751–767 CrossRef.
- A. A. Kaminskii, S. E. Sarkisov, T. I. Butaeva, G. A. Denisenko, B. Hermoneit, J. Bohm, W. Grosskreutz and D. Schultze, Phys. Status Solidi A, 1979, 56, 725–736 CrossRef CAS.
- D. A. Hakeem and K. Park, J. Nanosci. Nanotechnol., 2015, 15, 5074–5077 CrossRef CAS PubMed.
- Z. Yahiaoui, M. A. Hassairi and M. Dammak, J. Electron. Mater., 2017, 46, 4765–4773 CrossRef CAS.
- K. Saidi and M. Dammak, RSC Adv., 2020, 10, 21867–21875 RSC.
- A. K. Choudhary, A. Dwivedi, A. Bahadur and S. B. Rai, J. Lumin., 2019, 210, 135–141 CrossRef CAS.
- Monika, R. S. Yadav, A. Bahadur and S. B. Rai, J. Phys. Chem. C, 2020, 124, 10117–10128 CrossRef CAS.
- K. Saidi and M. Dammak, J. Solid State Chem., 2021, 300, 122214 CrossRef CAS.
- A. Balakrishna and O. M. Ntwaeaborwa, Sens. Actuators, B, 2017, 242, 305–317 CrossRef CAS.
- J. Massoudi, M. Smari, K. Nouri, E. Dhahri, K. Khirouni, S. Bertaina, L. Bessais and E. K. Hlil, RSC Adv., 2020, 10, 34556–34580 RSC.
- P. Du, X. Huang and J. S. Yu, Inorg. Chem. Front., 2017, 4, 1987–1995 RSC.
- J. Liao, Q. Wang, L. Kong, Z. Ming, Y. Wang, Y. Li and L. Che, Opt. Mater., 2018, 75, 841–849 CrossRef CAS.
- S. W. Yung, H. J. Lin, Y. Y. Lin, R. K. Brow, Y. S. Lai, J. S. Horng and T. Zhang, Mater. Chem. Phys., 2009, 117, 29–34 CrossRef CAS.
- N. M. Bhiri, M. Dammak, M. Aguiló, F. Díaz, J. J. Carvajal and M. C. Pujol, J. Alloys Compd., 2020, 814, 152197 CrossRef CAS.
- P. Du, L. Luo, X. Huang and J. S. Yu, J. Colloid Interface Sci., 2018, 514, 172–181 CrossRef CAS PubMed.
- X. Wang, X. Li, S. Xu, L. Cheng, J. Sun, J. Zhang and B. Chen, J. Alloys Compd., 2018, 754, 222–226 CrossRef CAS.
- S. Mondal, J. Sarkar, S. Panja, I. Dey, A. Sarkar, B. Ghosh, M. Kayal and U. K. Ghorai, J. Phys. Chem. Solids, 2019, 129, 442–447 CrossRef CAS.
- T. Pang and Z. Huang, Mater. Res. Express, 2018, 5, 066204 CrossRef.
- A. Ali, H. Suo, Y. Wu, J. Xiang, X. Zhao and C. Guo, Ceram. Int., 2019, 45, 8428–8432 CrossRef CAS.
- P. Singh, R. S. Yadav and S. B. Rai, J. Phys. Chem. Solids, 2021, 151, 109916 CrossRef CAS.
- R. S. Yadav and S. B. Rai, J. Alloys Compd., 2017, 700, 228–237 CrossRef CAS.
- R. Krishnan, S. G. Menon, D. Poelman, R. E. Kroon and H. C. Swart, Dalton Trans., 2021, 50, 229–239 RSC.
- R. S. Yadav, D. Kumar, A. K. Singh, E. Rai and S. B. Rai, RSC Adv., 2018, 8, 34699–34711 RSC.
- R. S. Yadav, S. J. Dhoble and S. B. Rai, Sens. Actuators, B, 2018, 273, 1425–1434 CrossRef CAS.
- H. Zhang, S. Zhao, X. Wang, X. Ren, J. Ye, L. Huang and S. Xu, J. Mater. Chem. C, 2019, 7, 15007–15013 RSC.
- Y. Tian, Y. Tian, P. Huang, L. Wang, Q. Shi and C. Cui, Chem. Eng. J., 2016, 297, 26–34 CrossRef CAS.
- L. Peng, Q. Meng and W. Sun, RSC Adv., 2019, 9, 2581–2590 RSC.
- M. Jia, Z. Sun, M. Zhang, H. Xu and Z. Fu, Nanoscale, 2020, 12, 20776–20785 RSC.
- J. Zhang and F. Qian, Dalton Trans., 2020, 49, 10949–10957 RSC.
- J. Zhang, Y. Zhang and X. Jiang, J. Alloys Compd., 2018, 748, 438–445 CrossRef CAS.
- T. Zheng, L. Zhou, X. Qiu, D. Yang, M. Runowski, S. Lis, P. Du and L. Luo, J. Lumin., 2020, 227, 117517 CrossRef CAS.
- L. Mukhopadhyay and V. K. Rai, New J. Chem., 2017, 41, 7650–7661 RSC.
- P. Liu, J. Liu, Y. Zhang, Z. Xia and Y. Xu, J. Alloys Compd., 2020, 844, 156116 CrossRef CAS.
- W. Liu, X. Wang, Q. Zhu, X. Li, X. Sun and J.-G. Li, Sci. Technol. Adv. Mater., 2019, 20, 949–963 CrossRef CAS PubMed.
- J. Zhang, J. Chen and Y. Zhang, Inorg. Chem. Front., 2020, 7, 4892–4901 RSC.
- M. Back, E. Casagrande, C. A. Brondin, E. Ambrosi, D. Cristofori, J. Ueda, S. Tanabe, E. Trave and P. Riello, ACS Appl. Nano Mater., 2020, 3, 2594–2604 CrossRef CAS.
- M. Rodrigues, R. Piñol, G. Antorrena, C. D. S. Brites, N. J. O. Silva, J. L. Murillo, R. Cases, I. Díez, F. Palacio, N. Torras, J. A. Plaza, L. Pérez-García, L. D. Carlos and A. Millán, Adv. Funct. Mater., 2016, 26, 200–209 CrossRef CAS.
Footnote |
| † Electronic supplementary information (ESI) available. See DOI: 10.1039/d1ra06049j |
| This journal is © The Royal Society of Chemistry 2021 |

