 Open Access Article
Scaling law for the kinetics of water imbibition in polydisperse foams
Kanoko Tsuritania and
Susumu Inasawa *abc
*abc
aGraduate School of Bio-Applications and Systems Engineering, Tokyo University of Agriculture and Technology, 2-24-16 Nakacho, Koganei, Tokyo 184-8588, Japan. E-mail: inasawa@cc.tuat.ac.jp
bDepartment of Applied Physics and Chemical Engineering, School of Engineering, Tokyo University of Agriculture and Technology, 2-24-16 Nakacho, Koganei, Tokyo 184-8588, Japan
cDepartment of Chemical Engineering, School of Engineering, Tokyo University of Agriculture and Technology, 2-24-16 Nakacho, Koganei, Tokyo 184-8588, Japan
First published on 8th October 2021
Abstract
We investigated the kinetics of water imbibition in polydisperse foams. We used a Hele-Shaw cell, and horizontal imbibition was observed for a timescale of up to 103 s in which the gravity effect was negligible. While several papers have reported kinetics for imbibition in foams, imbibition kinetics in polydisperse foams and its variations in longer timescales are not well understood. The tip position of imbibition was proportional to the square root of time in the initial stage of imbibition, but it showed plateauing in the late stage of imbibition. We evaluated the proportional constant A in the initial stage of imbibition as a kinetic constant for the time-dependent increase in the tip position, which showed a clear dependency on the initial and final water volume fractions in the foams. Conversely, the mean initial radius of the curvature and the channel length in the Plateau borders did not show any clear correlations with A, although both valuables are frequently used in modeling for liquid imbibition in foams. On the basis of the t1/2 dependence, the correlation of A with the water volume fraction and the increase in the water volume fraction during imbibition, we proposed a simple equation to describe the tip position over the entire period of imbibition. We used them to scale all of the experimental data, which showed good agreement with the theoretical line. This clearly showed that the water volume fraction in the foams during imbibition was the key factor to quantitatively describe the rate of water imbibition. Features in the kinetics of imbibition were discussed.
1. Introduction
Foam is an ensemble of bubbles separated by thin liquid layers. The gas–liquid interfaces are generally deformable, which provides a complicated structure of a connected network of thin liquid layers. Gas molecules permeate through liquid films,1 and coarsening,1,2 rearrangement,3 and destabilization4 of the bubbles frequently occur in foams. The surface elasticity of bubbles is an important factor for coarsening and coalescence5 because of the large gas–liquid interfacial area in foams. Osmotic pressure emerges in foams depending on the liquid volume fraction, size of the bubbles, and gas–liquid interfacial energy.6,7 To understand the complicated properties of foams, theoretical approaches have also been used to describe deformation of the bubbles8 and the response to shear fields.9 These are only a few examples, but they clearly show the unique properties of foams originating from the gas–liquid interfaces.Many thin liquid channels are connected in foams, and the flow in these channels is an intensely studied topic. A narrow channel of liquid typically surrounded by three contacting bubbles is called Plateau border and many Plateau borders are connected by junctions called nodes. These connected paths are the main routes for liquid flow in foams. Cutting-edge approaches have been developed to measure the flow in a single Plateau border formed by a triangular prism frame10–12 or three-dimensional (3D) printing.13 The distribution of flow velocities in an exterior or interior channel of the Plateau border has been measured by particle tracking.14 The mobility and surface viscosity on the gas–liquid interfaces are the main factors that affect the flow velocity in Plateau borders,14,15 whereas it has been reported that there is no close relation between the interfacial shear elasticity and liquid entrainment on foam films.16 Studies on the spontaneous flow of liquid in a narrow gap between rods17 or bubbles18 has also provided useful information about the liquid flow in a Plateau border between packed bubbles. The flow in nodes and its differences from the flow in channels have been experimentally investigated.19,20 The cross section of the Plateau border and the channel length have been mathematically modeled using a geometric relation,21,22 with which conservation of the liquid volume during flow is considered.23–26 Both the experimental and theoretical work on the microscopic flow in foams are summarized in ref. 27. Similar Plateau borders form in concentrated emulsions,28–31 and these models for the flow between bubbles are used to simulate the pressure distribution in packed droplets in drying emulsions.28,29
The flow of liquid through many Plateau borders and nodes is measurable experimentally using foam drainage or imbibition of the liquid into dry foam. In foam drainage, the liquid phase drains owing to gravity, which has been extensively investigated experimentally and theoretically.32–38 The moving rate of the wetting front is proportional to the square root of the rate of liquid addition to a monodisperse foam.32 The mobility parameter M, which incorporates bubble size, liquid content and surface shear viscosity of bubbles has been proposed as a relevant parameter to describe foam drainage regimes.36 In the case of emulsions or colloidal suspensions, dispersed oil droplets or solid particles are trapped in the water paths in the foams, which reduces the rate of drainage compared to that without droplets or solid particles.39–41
Imbibition of liquid into a foam occurs owing to the capillary pressure of the Plateau border, and comparison with the gravity effect is the key to imbibition on earth.42,43 Microgravity has been investigated in liquid imbibition to minimize the effect of gravity,44–50 in which the bubbles are very stable and coarsening or coalescence does not occur.50 Imbibition can be explained by a diffusion-like process and the wetting front is proportional to the square root of time.46 In the case of dry foam under microgravity, the proportional constant of A = 1.19 cm2 s−1, is reported,46 but this value would vary depending on foams. The diffusion-like process of the wetting front has been supported by modeling and the corresponding diffusion equations have been theoretically derived.44,46,48,51 Prediction of the A value from experimental data has also been performed.46,51 However, one important point is that most reported microgravity experiments were mainly conducted in a falling plane and the experimental time for imbibition was inevitably limited (up to at most 20 s).45,46,48 We do not understand how imbibition proceeds for longer time scales. In addition, a number of reported A values are rather limited46,48 and the generality of this approach to other polydisperse foams and the range of A are still unknown. Our motivation for this work is to clarify these points. Imbibition is a fundamental phenomenon in foams and it consists of the microscopic flows in many Plateau borders. Thus, this study is important to understand the features of liquid flow in foams.
In this study, we observed water imbibition in aqueous foams. For visual observation, the foam was introduced into the gap between two parallel glass plates (Hele-Shaw cell). To avoid the gravity effect, we set the samples horizontally and forced dyed aqueous solution to contact the foam. We used polydisperse foams with various initial water fractions. The change of the position of the imbibition front with time was measured. The correlations between the rate constant for imbibition and the relevant parameters of foams are also discussed.
2. Experimental methods
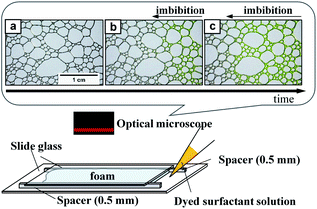
Sodium dodecyl sulfate (SDS) (Fujifilm Wako Pure Chemical Co., Osaka, Japan) and polyoxyethylene(10) octylphenyl ether (TX-100) (Fujifilm Wako Pure Chemical) were used as surfactants. We prepared aqueous surfactant solutions containing 8 mM SDS and 1 mM TX-100. The interfacial energies (surface tensions) of these solutions were 42 mN m−1 for SDS and 33 mN m−1 for TX-100, both of which were determined by the capillary rise method (DG-1, Surfgage Instruments, Matsudo, Chiba, Japan). We also prepared surfactant solutions with the same concentrations but dyed with uranine (Fujifilm Wako Pure Chemical). We used the dyed solutions for imbibition observation.Air was introduced into the solutions through a glass tube with an inner diameter of 5 mm. The tip of the tube was fully covered by a filter paper (Munktell M1-125, Ahlstrom Corporation, Helsinki, Finland). We changed the air flow rate in the range 50–200 mL min−1 to vary the sizes of the bubbles and their distribution. After the bubbling, the bubbles were spontaneously accumulated on the top of the solutions and we obtained foams. The solutions were left to stand for various periods to change the liquid-volume fraction in the foam. We placed a specified amount of the foam in an observation cell, which is schematically illustrated in Fig. 1 (bottom). We fabricated the observation cells using a set of slide glasses and spacers. Two spacers with a height of 0.5 mm was set on the slide glass in parallel. The width between the spacers was 35 mm. We placed aqueous foam between the spacers and set the other slide glass on them so that the foam was sandwiched between the slide glasses. The total length of the foam between the glasses was approximately 5–6 cm. We then placed an amount of the dyed surfactant solution on one side of the cell. Spontaneous imbibition of the dyed surfactant solution was observed and recorded by an optical microscope (AZ-100, Nikon, Tokyo, Japan) equipped with a digital camera (D-5200, Nikon). We used an objective lens (AZ-Plan Apo 0.5×, Nikon). An example of imbibition observation is shown in Fig. 1 (top). The time intervals for recording were 3 s for the initial fast imbibition and 20 s for the later slow imbibition. Bubbles were flexible and shape change in bubbles spontaneously occurred owing to water imbibition within the time intervals of 3 s. We observed water imbibition in a timescale of up to 103 s.
The recorded images were analyzed using the free software ImageJ (National Institute of Health, USA). We measured the imbibition length of the foam, from the injection edge of the cell to the tip of the imbibition as defined in Fig. 1b and c. In addition, we measured the radius of curvature and channel length of the bubbles in the foam. Definitions of these valuables are shown in Fig. 3. We also estimated the total air area of the bubbles using the commercial software MATLAB (Mathworks Inc., Natick, MA, USA), with which we estimated the water volume fraction in the foam.
The numerical aperture of the objective lens was 0.05 and the resolution limit of the lens was estimated to be 6 μm. We also checked the resolution of the recorded digital images, which was 10 μm per pixel. The minimum length scale discussed in this work is 0.1 mm and we confirmed that the observed images had sufficient resolution.
In estimation of the water volume fraction, we first estimated the total area of the bubbles surrounded by gas–liquid interfaces. We then subtracted it from the total area of the foam. Owing to the curved shape of the interfaces, they were recorded as black lines with a width in the images. In our analysis, these lines were counted as the water phase, but both air and water were present in these black line regions owing to the curved interfaces. This suggests that the estimated water volume fraction would overestimate the actual value. However, we did not aim to determine the precise value of the water fraction, and hence we used the estimated water fraction in this work. The estimated values of the initial water volume fraction before imbibition were in the range 0.18–0.59 and those of the final water volume fraction after the end of imbibition were in the range 0.40–0.70.
3. Results
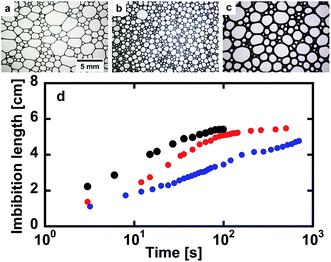
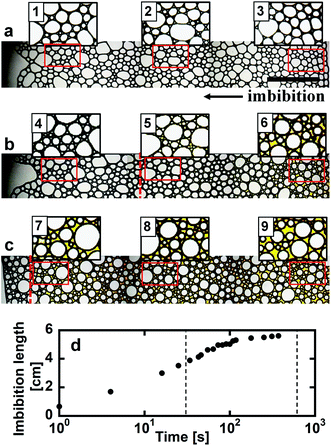
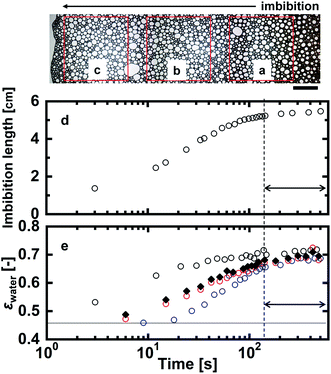
Optical microscope images of the foams before imbibition are shown in Fig. 2a–c. The corresponding distributions of the radius of curvature rcurv, circular radius rcircle, channel length of the Plateau border Lnn are shown in Fig. 3. The definition of rcircle is shown in Fig. 3b. The bubbles in the foams we used were polydisperse and they had different distributions of these characteristic values (Fig. 3). The change of the imbibition length with time is shown in Fig. 2d. Imbibition of water varied depending on the foam, and the rate of imbibition decreased with time. Images of the bubbles at three different positions during imbibition are shown in Fig. 4. Before imbibition, the bubbles were packed and distorted at all positions (images 1–3 in Fig. 4a). After 30 s imbibition (Fig. 4b), the bubbles near the starting point of water imbibition were circular in shape (image 6), while those at different positions near the imbibition tip (image 5) and away from the tip (image 4) were still distorted. In the late stage of imbibition, the tip of imbibition reached the other side of the foam (Fig. 4c), and all of the bubbles became spherical in shape (images 7–9). The correlations between the imbibition length and estimated water volume fraction εwater at three different positions are shown in Fig. 5. We need to define a sufficiently larger area than the bubble sizes to estimate εwater. The sizes of most of the bubbles were less than 1 mm (Fig. 2 and 3). Thus, we used a 13 mm square to estimate the water volume fraction (see the top image of Fig. 5). εwater increased with time for all three areas, but the increase was slower for areas b and c. This suggests that εwater was not uniform in the foams during imbibition. In the late stage of imbibition indicated by the arrows in Fig. 5d and e, there was almost no change in εwater for all areas and εwater was almost constant at around 0.7 (Fig. 5e).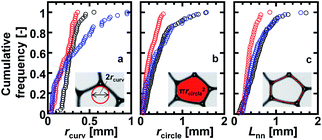 | ||
| Fig. 3 Cumulative frequencies of the initial values of the (a) radius of curvature (rcurv), (b) circular radius (rcircle), and (c) channel length of the Plateau border (Lnn) for the three different foams. The black, red, and blue symbols are for the foams in Fig. 2(a–c), respectively. The definitions of rcurv, rcircle, and Lnn are schematically shown in the inserts. | ||
4. Discussion
4.1 Kinetic constant for the initial stage of imbibition
Foam drainage theory is a candidate to describe the change of the tip position of water imbibition.33,34,36,38 However, this is not practical for this study because the partial differential nature of the fundamental equation in foam drainage theory.33,34,44,46 Conservation of the volume of the flowing liquid in foams frequently requires both temporal and spatial differential formulas. Consequently, the governing equations need to be numerically treated to obtain solutions,33,34,44,46 which brings complexity into the analysis. Thus, we analyzed the experimental data using a square-root expression.45,46,48Assuming that the tip position of water imbibition x(t) is described by the square root of time, we set x(t) = At1/2, where A is a kinetic constant in units of cm s−1/2. In several papers, the constant A is called the diffusivity.45,46 However, as we have already discussed, the origin of water imbibition is flow. Therefore, hereafter, we call A the kinetic constant in this paper. We define t = 0 as the time when we added the dyed solution to the observation cell. However, there was a slight delay before the first image of imbibition was recorded. To minimize this experimental error in time, we used the difference in the imbibition length
 | (1) |
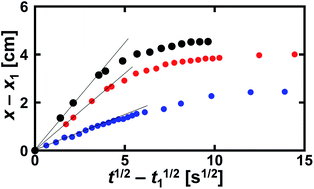 | ||
| Fig. 6 Data in Fig. 2 replotted using eqn (1). The definitions of the black, red, and blue solid circles are the same as in Fig. 2. The solid lines show the initial slopes of A for the separate data. | ||
Water imbibition occurs because of the negative pressure in the Plateau borders in the foam, which is approximately expressed as γ/rcurv, with γ being the interfacial energy on the air–liquid interface. Thus, it is a reasonable interpretation that rcurv has a close relation with A. However, there was no clear relation between A and the mean values of the initial rcurv (Fig. 7 left). We also plotted A against the mean channel length before imbibition Lnn, but there was also no close relation with A (Fig. 7 right). Thus, we did not find any clear relation between the initial geometric parameters of the foams and the kinetic constant A. There were wide distributions of rcurv and Lnn (Fig. 3). This would be a reason why A and rcurv did not show a clear correlation (Fig. 7 left). We also measured the cumulative frequencies of the bubble area in the foams during water imbibition, but we did not find any clear change in the distributions during water imbibition.
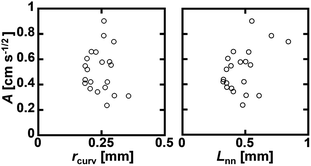 | ||
| Fig. 7 Correlation between A and the mean initial rcurv (left) and mean channel length before imbibition Lnn (right). | ||
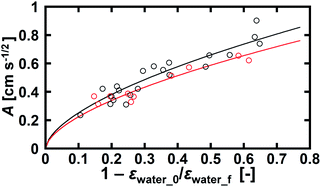
We found that εwater in the foam increased as imbibition progressed (Fig. 5). It became constant after the rate of increase in the imbibition length was small. In this late stage of imbibition, all of the bubbles were circular in shape (Fig. 4c), suggesting that the foam was saturated with water. We consider that the constant εwater in the late stage of imbibition was the upper limit of εwater in the foam. Water imbibition is a process in which εwater increases in foams. The difference between the final water volume fraction εwater_f and initial volume fraction εwater_0 in the same foam corresponds to the amount of water that can be absorbed by the foam. The ratio of the absorbable amount of water to the maximum water volume in a foam (εwater_f − εwater_0)/εwater_f would then be correlated with the kinetics of imbibition. Thus, we plotted the A values using (1 − εwater_0/εwater_f) for all of the examined foams (Fig. 8). The samples of SDS and TX-100 both showed good correlations. We concluded that the initial and final volume fractions of water are the key factors to describe water imbibition.
We used a power law formula to describe the dependency of A on (1 − εwater_0/εwater_f). The SDS data agreed well with A = (1 − εwater_0/εwater_f)0.6, while A = 0.89(1 − εwater_0/εwater_f)0.6 gave the best fitting result for the TX-100 data. This suggests that the rate of water imbibition in the TX-100 foams was about 90% of that in the SDS foams. The surface tension on the air–water interface was 42 mN m−1 for SDS and 33 mN m−1 for TX-100. The air–water interfacial energy of the TX-100 samples was about 80% of that of the SDS samples, showing reasonable agreement with the proportional constant of 0.89. This simple comparison suggests that the air–water interfacial energy affects A. Thus A would vary depending on types of surfactants and types of gases in foams.
In this study, the kinetic coefficient A varied from 0.2 to 1 cm s−1/2 (Fig. 8). In a microgravity experiment, the corresponding coefficient has been reported to be 1.19 cm2 s−1 (1.09 cm s−1/2) in a Hele-Shaw cell.45,46 Our values were smaller but in reasonable agreement with the previous studies. Cox et al.51 predicted this constant as A2 = γLKδ/η, in which L is a relevant length scale for the Plateau border, K is the permeability constant, δ is a geometric constant, and η is the viscosity of the surfactant solution. In this study, L was typically 0.5 mm (Fig. 7 right) and the other values were γ = 42 mN m−1, δ = 0.655,51 and η = 1 × 10⁻³ Pa s. K depends on the type of gas–liquid interface, and it has been proposed that K = 9.9 × 10⁻³ for rigid interfaces and K = 2.3 × 10⁻³ for mobile interfaces.51 A is then estimated to be 1.2 cm s−1/2 for rigid interfaces and 0.6 cm s−1/2 for mobile interfaces. This simple comparison suggests that the gas–liquid interface of the SDS or TX-100 aqueous solution in this study would be treated as a mobile interface.46,51
In two-dimensional water imbibition under microgravity, A has been reported to be 0.01–0.02 cm s−1/2.48 This value is one order of magnitude smaller than our values. The imbibition front radially spread in that study, whereas it proceeded along the x direction in this work. In addition, because of the difference in the thicknesses of the observed foams, the number ratio of exterior channels to total channels would be larger in this study compared with that in ref. 48. Faster flow velocity in the exterior channels has been reported,23 and this would contribute to a larger value in A in our work. These factors would cause a different value of A.
4.2 Scaling formula for water imbibition
The kinetic constant A describes the initial rate of increase in the imbibition length, but we were not able to describe the later imbibition rate using A. In this section, we derive a dimensionless equation that describes the change of the imbibition length with time over the entire period.We assumed a constant value of A in eqn (1). However, as clearly shown in Fig. 6, A decreased as water imbibition progressed. We define An for A at time tn. We then rewrite eqn (1) using a recurrence formula as
 | (2) |
 | (3) |
The kinetic constant An varies with time because the volume fraction of water in the foam increases during imbibition. We assume that the volume fraction of water in the foam is εwater_f after the tip of water imbibition has passed and the water volume fraction in the rest part of the foam is εwater_0. This assumption is schematically illustrated in Fig. 9. The average water volume fraction in the foam εav is then
 | (4) |
| An = (1 − εav/εwater_f)0.6 | (5) |
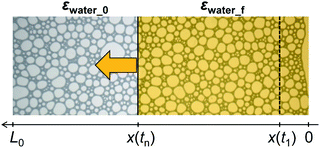 | ||
| Fig. 9 Schematic illustration of the assumptions for the imbibition length and water volume fraction in the proposed model. | ||
We are able to simulate the change of the imbibition length with time using eqn (3)–(5).
We further developed these expressions by introducing the dimensionless length and time. We define the dimensionless length as ηn = (x(tn) − x(t1))/(L0 − x(t1)) and the dimensionless time as φn = tn/τSDS, where τSDS is the characteristic time scale for water imbibition in the SDS samples, which is defined as τSDS−0.5 = (1 − εwater_0/εwater_f)0.6(L0 − x(t1))−1. For the TX-100 samples, An is 0.89(1 − εav/εwater_f)0.6, which is roughly described as (γTX-100/γSDS)(1 − εav/εwater_f)0.6 as discussed in the Section 4.1. In this relation, γ is interfacial energy between water and air, and the subscript denotes surfactants dissolved in water. Then we obtain the ratio of the characteristic times as τTX-100/τSDS = (γSDS/γTX-100)2. By substituting these values into eqn (3) and using the relation that η1 = 0 from the definition of ηn, we finally obtained the following relation:
 | (6) |
Derivation of eqn (6), τSDS and τTX-100 is given in the Appendix. We scaled all data for SDS and for TX-100 to ηn and φn, and they are plotted in Fig. 10. For comparison, the same data before scaling are shown in the inserts of Fig. 10. We found that there was good agreement between the experimental data and the curve simulated using eqn (6). We concluded that eqn (3)–(5) and the dimensionless form of eqn (6) reasonably quantitatively describe water imbibition.
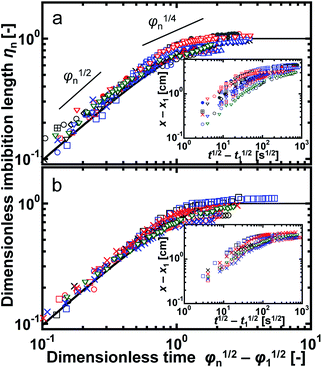 | ||
| Fig. 10 Plots of the dimensionless imbibition length ηn and time φn for foams of (a) SDS and (b) TX-100. The different symbols represent the data for different samples. The solid lines in (a) and (b) were obtained with eqn (6), and they show good agreement with the experimental data. The inserts show the same data but not in a dimensionless form, in which x and x1 correspond to x(t) and x(t1) in the main text. The two short lines in (a) show the corresponding slopes for ηn in proportion to φn1/2 and φn1/4. | ||
One important point is that we did not use microscopic parameters, such as rcurv and Lnn, in the above equations. They have been used as essential factors in theoretical approaches of the flow in foams. However, our results clearly showed that we did not need to evaluate these parameters for water imbibition. From eqn (4), the dimensionless water volume fraction of (εav − εwater_0)/(εwater_f − εwater_0) is equal to ηn. Thus, another interpretation of Fig. 10 is time evolution of the average water volume fraction in foams. (εav − εwater_0)/(εwater_f − εwater_0) ≈ 0.7 for φn − φ1 ≈ 1, around which the rate of water imbibition gradually decreased. In most cases, φ1 ≪1, and thus t ≈ τ is the characteristic time for the beginning of the decrease in the rate of water imbibition.
In the initial stage of imbibition, ηn was proportional to φn1/2 (Fig. 10). This feature is observed in three different experimental systems: water imbibition under microgravity,45,46 oil imbibition under gravity,42 and horizontal oil imbibition in aqueous foams in a Hele-Shaw cell.52 In the first case, the gravity effect is negligible and water imbibition is induced by the capillary pressure in the dry foam. Mensire et al.42 observed 3D oil imbibition in a dry foam under gravity. They proposed a physical model that considers a balance between gravity and the vertical capillary pressure, Darcy's law, and conservation of mass in the foam, with which they succeeded in describing the t1/2 dependence of the tip position of imbibition.42 Kusaka et al.52 reported horizontal oil imbibition, and they explained the t1/2 dependence of the tip position using a simple form of Darcy's law. Our data agrees with these results, and we conclude that the t1/2 dependence of the imbibition tip is a general feature independent of the imbibition direction (horizontal or vertical) and type of liquid (water or oil).
In the late stage of imbibition, the rate of imbibition gradually decreased (Fig. 10). Mensire et al.42 reported that the time dependence of the tip position was t1/4 in 3D imbibition, while a theoretical approach predicted t1/3.33 The differences in the boundary conditions between theory and experiment have been suggested to be a reason for the discrepancy.42 Horizontal oil imbibition shows t1/3 dependence of the imbibition front.52 Thus, the time dependence is still under debate. Our data showed approximate agreement with the slope of φn1/4 around φn ≈ 1 (Fig. 10), but the slope of the data clearly decreased for further imbibition. Thus, our data did not show any constant time dependence of the tip position in the late stage of imbibition. One reason is the small ratio of the imbibition length to the total length of the foam. In the 3D imbibition study,42 the reported tip position was about 10 mm in a foam with a height of 5 cm. For the horizontal oil imbibition study,52 an imbibition length of 10 mm was observed for a circular foam with a diameter of 55 mm, which was estimated from the experimental conditions. The ratio was approximately 0.2 in both cases. In the above studies, the liquid imbibed from the edge of the foam, but the observed tip position was away from the other edge, suggesting that the end of the foam could be assumed to be an infinite boundary for imbibition. In contrast, in this study, imbibition reached very close to the end of the foams and the infinite boundary condition was not a suitable assumption. Imbibition occurs in a foam, and imbibition will stop when the front reaches the end of the foam. Therefore, the rate of imbibition decreased when ηn was close to unity, and this effect is expressed as (1 − ηn)0.6 in eqn (6).
In vertical capillary rise experiments, there is a maximum height at which the capillary pressure balances with the gravity.53 However in horizontal imbibition, the gravity is negligible in general54 and there is no clear prediction on the maximum length for the imbibition. But our results clearly show that there is a termination in horizontal imbibition in foams when the foams are filled with imbibed liquid. Another important point is that we used an expression of t1/2 dependence for scaling. In most previous papers on imbibition or capillary rise experiments, imbibition kinetics is considered separately with a different scaling law. Different imbibition regimes are expressed by different power laws of time, such as t1/2, t1/3 or t1/4 in these papers.33,42,52 We used a combination of t1/2 dependence and a valuable of A, which was a function of the volume fraction of water in foams during imbibition. This is not a general approach. However we have succeeded in describing water imbibition over the entire period of imbibition using a single formula of eqn (6) as shown in Fig. 10. Gradual decrease in the rate of imbibition was not described by the power law of t1/2, but it was described by a decrease in A in our model. We conclude that the volume fraction of water during imbibition is a key to describe imbibition.
We note that coalescence or coarsening of bubbles occurred during imbibition but it was infrequent. In addition, the timescale for coarsening was about 103 s in this study. Water imbibition was much faster than this time scale and we consider that bubbles in this work was stable during observation. We also note that coarsening and coalescence generally occurs when bubbles are in close contact. However, in the final stage of water imbibition, the water volume fraction in foam is large and bubbles are separated by thick water layer as in Fig. 4c. Thus even if coalescence or coarsening of bubbles would affect water imbibition in this study, it would be observed in the initial stage of imbibition, in which foam is still dry.
In flow of an oil in a single aqueous Plateau border, the imbibition dynamics of the oil obey the t2/3 law in the initial stage of imbibition, during which there is oil flow from the soap film to the Plateau border.10 It then changes to the t1/3 law after all of the oil has entered the Plateau border.10 These features were not observed in our study. This clearly shows that imbibition in foams is not simple summation of the flows in the individual Plateau borders. Different flow velocities in the exterior and interior channels,23 complicated flow in the nodes,23,25 and connection of many Plateau borders through nodes would cause different imbibition features from the liquid flow in a single Plateau border.
We found that the average liquid volume fraction of water is the key factor to describe the kinetics of the imbibition front. This is important to predict the imbibition front in a simple way and could be used for liquid transport on two-dimensional cell sheets. However, several open questions remain. The followings are two examples. First, what is the physical background for why A is proportional to (1 − εwater_0/εwater_f)0.6? Second, what is the link between the microscopic parameters, such as rcurv and Lnn, and the macroscopically determined εwater, especially for a system of a polydisperse foam? Theoretical approaches are necessary to answer these questions. We believe that further investigation of these questions will reveal the hidden physical background of liquid imbibition in foams.
5. Conclusions
Our main findings are the following points.• The progression in the tip position of water imbibition in polydisperse foams is proportional to the square root of time during the initial stage of imbibition, but the kinetic (proportional) constant A gradually decreases during further water imbibition.
• The kinetic constant A does not show any clear correlation to the radius of curvature and channel length in the polydisperse foams before imbibition. Conversely, the volume fraction of water closely relates to the kinetic constant A.
• All data is well summarized by the dimensionless recurrence formula, which is obtained from the t1/2 dependence of the tip position and the correlation of A with the water volume fraction during imbibition. This suggests that the formula can be used as a general scaling law for water imbibition.
We consider that these findings in this work provide a new framework for theoretical approaches in understanding the scaling law for the kinetics in water imbibition in foams.
6. Appendix
From eqn (4), εav = εwater_0 + (εwater_f − εwater_0)ηn and we obtain a different expression for An:| An = (1 − εwater_0/εwater_f)0.6(1 − ηn)0.6 | (A-1) |
The imbibition length and time are expressed as x(tn) − x(t1) = (L0 − x(t1))ηn and tn = φnτSDS. By substituting these expressions and eqn (A-1) into eqn (3), we obtain
 | (A-2) |
Thus, τSDS−0.5 = (1 − εwater_0/εwater_f)0.6/(L0 − x(t1)) is defined as the characteristic time scale for water imbibition in the SDS samples, with which the final form of the dimensionless formula of eqn (6) is obtained. For TX-100, An is approximately defined as (γTX-100/γSDS)(1 − εwater_0/εwater_f)0.6(1 − ηn)0.6 and this leads (τTX-100/τSDS) = (γSDS/γTX-100)2 as in the main text.
Author contributions
K. T. conducted the experiments and data validation, and drafted the first draft of the manuscript. S. I. contributed to the concept and design of the study, funding acquisition, and reviewed and edited the manuscript.Conflicts of interest
There are no conflicts to declare.Acknowledgements
We thank Tim Cooper, PhD, from Edanz Group (https://jp.edanz.com/ac) for editing a draft of this manuscript. This work was partially financially supported by JSPS KAKENHI, Grant Number JP21K18843.References
- L. Saulnier, W. Drenckhan, P. –E. Larre, C. Anglade, D. Langevin, E. Janiaud and E. Rio, Colloids Surf., A, 2015, 473, 32–39 CrossRef CAS.
- A. E. Roth, C. D. Jones and D. J. Durian, Phys. Rev. E, 2013, 87, 042304 CrossRef CAS PubMed.
- F. F. Dunne, F. Bolton, D. Weaire and S. Hutzler, Philosophical Magazine, 2017, 97, 1768–1781 CrossRef CAS.
- V. Carrier and A. Colin, Langmuir, 2003, 19, 4535–4538 CrossRef CAS.
- D. Georgieva, A. Cagna and D. Langevin, Soft Matter, 2009, 5, 2063–2071 RSC.
- A. Maestro, W. Drenckhan, E. Rio and R. Hohler, Soft Matter, 2013, 9, 2531–2540 RSC.
- R. Hohler, Y. Y. C. San, E. Lorenceau and S. Cohen-Addad, Langmuir, 2008, 24, 418–425 CrossRef PubMed.
- A. Boromand, A. Signoriello, J. Lowensohn, C. S. Orellana, E. R. Weeks, F. Ye, M. D. Shattuch and C. S. O'Hern, Soft Matter, 2019, 15, 5854–5865 RSC.
- F. Zaccagnino and S. Cox, Soft Matter, 2020, 16, 8861–8870 RSC.
- K. Piroird and E. Lorenceau, Phys. Rev. Lett., 2013, 111, 234503 CrossRef PubMed.
- A. Cohen, N. Fraysse and C. Raufaste, Phys. Rev. E, 2015, 91, 053008 CrossRef PubMed.
- A. Cohen, N. Fraysse, J. Rajchenbach, M. Argentina, Y. Bouret and C. Raufaste, Phys. Rev. Lett., 2014, 112, 218303 CrossRef.
- C. Clarke, A. Lazidis, F. Spyropoulos and I. T. Norton, Soft Matter, 2019, 15, 1879–1889 RSC.
- S. A. Koehler, S. Hilgenfeldt, E. R. Weeks and H. A. Stone, J. Colloid Interface Sci., 2004, 276, 439–449 CrossRef CAS PubMed.
- O. Pitois, C. Fritz and M. Vignes-Adler, Colloids Surf., A, 2005, 261, 109–114 CrossRef CAS.
- G. Lin, J. Frostad and G. Fuller, Physical Review Fluids, 2018, 3, 114001 CrossRef.
- A. Ponomarenko, D. Quere and C. Clanet, J. Fluid Mech., 2011, 666, 146–154 CrossRef.
- M. J. Kennedy, M. W. Conroy, J. W. Fleming and R. Ananth, Colloids Surf., A, 2018, 540, 158–166 CrossRef CAS.
- O. Pitois, N. Louvet, E. Lorenceau and F. Rouyer, J. Colloid Interface Sci., 2008, 322, 675–677 CrossRef CAS PubMed.
- K. Piroird, E. Lorenceau and A. –L. Biance, Soft Matter, 2014, 10, 7061–7067 RSC.
- R. A. Leonard and R. Lemlich, AIChE J., 1965, 11, 18–25 CrossRef CAS.
- H. M. Princen, J. Colloid Interface Sci., 1979, 71, 55–66 CrossRef.
- S. A. Koehler, S. Hilgenfeldt and H. A. Stone, J. Colloid Interface Sci., 2004, 276, 420–438 CrossRef CAS PubMed.
- B. Gay, P. Rognon, D. Reinelt and F. Molino, Eur. Phys. J. E, 2011, 34, 2 CrossRef PubMed.
- A. Anazadehsayed, N. Rezaee and J. Naser, J. Colloid Interface Sci., 2017, 504, 485–491 CrossRef CAS PubMed.
- A. Anazadehsayed, N. Rezaee and J. Naser, J. Colloid Interface Sci., 2018, 511, 440–446 CrossRef CAS PubMed.
- A. Anazadehsayed, N. Rezaee, J. Naser and A. V. Nguyen, Adv. Colloid Interface Sci., 2018, 256, 203–229 CrossRef CAS PubMed.
- H. Feng, J. H. B. Sprakel, D. S. Ershov, T. Krebs, M. A. Cohen Stuart and J. van der Gucht, Soft Matter, 2013, 9, 2810–2815 RSC.
- H. Feng, J. Sprakel and J. van der Gucht, Phys. Rev. E, 2015, 92, 023011 CrossRef PubMed.
- K. Hasegawa and S. Inasawa, Soft Matter, 2017, 13, 7026–7033 RSC.
- K. Hasegawa and S. Inasawa, Soft Matter, 2020, 16, 8692–8701 RSC.
- B. Weaire, N. Pittet, S. Hutzler and D. Pardal, Phys. Rev. Lett., 1993, 71, 2670–2673 CrossRef PubMed.
- S. A. Koehler, H. A. Stone, M. P. Brenner and J. Eggers, Phys. Rev. E, 1998, 58, 2097–2106 CrossRef CAS.
- S. J. Neethling, H. T. Lee and J. J. Cilliers, J. Phys.: Condens. Matter, 2002, 14, 331–342 CrossRef CAS.
- A. Saint-Jalmes, Soft Matter, 2006, 2, 836–849 RSC.
- A. Saint-Jalmes, Y. Zhang and D. Langevin, Eur. Phys. J. E, 2004, 15, 53–60 CrossRef CAS PubMed.
- P. M. Kruglyakov, S. I. Karakashev, A. V. Nguyen and N. G. Vilkova, Curr. Opin. Colloid Interface Sci., 2008, 13, 163–170 CrossRef CAS.
- E. Lorenceau, N. Louvet, F. Rouyer and P. Pitois, Eur. Phys. J. E, 2009, 28, 293–304 CrossRef CAS PubMed.
- M. Schneider, Z. Zou, D. Langevin and A. Salonen, Soft Matter, 2017, 13, 4132–4141 RSC.
- N. Koursari, P. Johnson, M. Parsa, M. Schneider, A. Trybala and V. M. Starov, Colloids Surf., A, 2020, 600, 124915 CrossRef CAS.
- B. Haffner, Y. Khidas and O. Pitois, Soft Matter, 2014, 10, 3277–3283 RSC.
- R. Mensire, K. Piroird and E. Lorenceau, Phys. Rev. E, 2015, 92, 053014 CrossRef PubMed.
- R. Mensire, J. T. Ault, E. Lorenceau and H. A. Stone, Europhys. Lett., 2016, 113, 44002 CrossRef.
- S. J. Cox and G. Verbist, Microgravity Sci. Technol., 2003, XIV/4, 45–52 CrossRef.
- H. Caps, H. Decauwer, M. –L. Chevalier, G. Soyez, M. Ausloos and N. Vandewalle, Eur. Phys. J. B, 2003, 33, 115–119 CrossRef CAS.
- H. Caps, S. J. Cox, H. Decauwer, D. Weaire and N. Vandewalle, Colloids Surf., A, 2005, 261, 131–134 CrossRef CAS.
- A. Saint-Jalmes, S. J. Cox, S. Marze, M. Safouane, D. Langevin and D. Weaire, Microgravity Sci. Technol., 2006, XVIII-3/4, 108–111 CrossRef.
- A. Saint-Jalmes, S. Marze, H. Ritacco, D. Langevin, S. Bail, J. Dubail, L. Guingot, G. Roux, P. Sung and L. Tosini, Phys. Rev. Lett., 2007, 98, 058303 CrossRef CAS PubMed.
- D. Langevin and M. Vignes-Adler, Eur. Phys. J. E, 2014, 37, 16 CrossRef CAS PubMed.
- H. Caps, N. Vandewalle, A. Saint-Jalmes, L. Saulnier, P. Yazhgur, E. Rio, A. Salonen and D. Langevin, Colloids Surf., A, 2014, 457, 392–396 CrossRef CAS.
- S. J. Cox, D. Waire and G. Verbist, Eur. Phys. J. B, 2004, 40, 119–121 CrossRef CAS.
- A. Kusaka, J. Sonoda, H. Tajima and T. Sakai, J. Phys. Chem. B, 2018, 122, 9786–9791 CrossRef CAS.
- D. Quere, Europhys. Lett., 1997, 39, 533–538 CrossRef CAS.
- L. Joly, J. Chem. Phys., 2011, 135, 214705 CrossRef PubMed.
| This journal is © The Royal Society of Chemistry 2021 |

