DOI:
10.1039/D1RA06701J
(Paper)
RSC Adv., 2021,
11, 33102-33113
Preparation of diameter-controlled free-standing MWCNT membranes and their application for dye adsorption†
Received
6th September 2021
, Accepted 18th September 2021
First published on 7th October 2021
Abstract
The synthesis of multi-walled carbon nanotubes (MWCNTs) was carried out over different Ni-loaded metallic oxide catalyst nanoparticles and under different reduction times to control the outside diameter of the nanotubes. Moreover, high-purity, free-standing membranes were fabricated by a simple filtration of the as-grown MWCNTs. Furthermore, the dye-adsorption properties of the nanotubes depended on the diameter of the carbon nanotubes (CNTs). The adsorption isotherms and kinetics of anionic dyes could be described by Freundlich and pseudo-second-order models, respectively. Thermodynamic studies suggested that the adsorption processes were spontaneous and exothermic. This work provides new insights into the synthesis and application of MWCNTs with the selective adsorption properties of carbon-based materials for the removal of organic dyes.
1. Introduction
Nowadays, the major sources of dyes pollution are industries such as textile, paper, rubber, plastics, paints, printing, and leather, which cause pollution in the receiving water bodies.1 Accordingly, finding an appropriate treatment method to eliminate these dyes from contaminated water is highly needed. There are numerous methods for the removal of dyes from wastewater, including filtration, oxidation, adsorption and bio-/photo-degradation.2–6 Among these widespread methods, adsorption is the most commonly implemented technique for the removal of dyes from effluent water due to its various advantages, such as the simplicity of the operation process, easy sequestration, regeneration, and low cost.6
Carbon nanotubes (CNTs) with a high surface area and good stability characteristics are considered ideal candidates for the adsorption of various dye pollutants (Fig. S1†).7,8 However, to the best of our knowledge, it is noteworthy that most of the developed CNT-based adsorbents are powders, and this leads to serious recontamination and recycling problems.9–13 From this respect, a free-standing film or bulk materials are highly desired, but this usually comes with the problems of a reduction in both the adsorption ability and stability in solution. Therefore, realizing efficient, selective, and reversible dye adsorption and desorption using a free-standing bulk material remains a big challenge.14–18 For an ideal free-standing bulk material, an interconnected network is necessary for achieving a high surface area and flexibility as well as good electrical conductivity. In addition, it should be prepared with a uniform diameter and controllable CNTs, in order to obtain free-standing membranes.
As is well known, the preparation of uniform diameter and controllable CNTs by chemical vapor deposition (CVD) is of interest to the scientific field, yet the effect of the particle size on precipitated catalyst mixtures has been rarely reported.19–22 It is believed that the growth of CNTs via CVD is affected by the particle size of the precipitate catalyst mixture before the CVD process. Theoretically, the size of CNTs is reduced with a catalyst size reduction for all CNT formation in a CVD system.23,24 As the construction of nanostructures is the main goal of this research, it is essential to explore the geometry size and shape of CNTs. Pretreatment is considered a promising technique for reducing the particle size of co-precipitation catalysts.25–27
This study is the first to aim at controlling the diameter of MWCNTs by controlling the particle size of the catalyst mixture through the co-precipitation technique. Then, the synthesis of MWCNTs was achieved via the CVD process. Moreover, high-purity and free-standing membranes were fabricated by a simple filtration of the as-grown MWCNTs (Scheme 1). The morphological and structural changes in MWCNTs due to various element ratios, different supporters, calcination temperatures and reduction times of the catalysts were investigated in detail. Our second aim in the present study was to control the diameter of the grown MWCNTs and to establish the correlation between the catalyst size, the diameter of MWCNTs, and the adsorption capacity. This study also revealed the effects of different temperatures and initial dye concentrations on the adsorption behavior of MWCNTs. The adsorption mechanism was described by adsorption thermodynamics. In addition, first-order and quasi-second-order models were employed to explain the adsorption kinetics. Based on these models, the mechanism of dye adsorption onto MWCNTs can be better understood. This work provides a feasible method for the synthesis of highly efficient and reusable MWCNTs for the adsorption and separation of dyes.
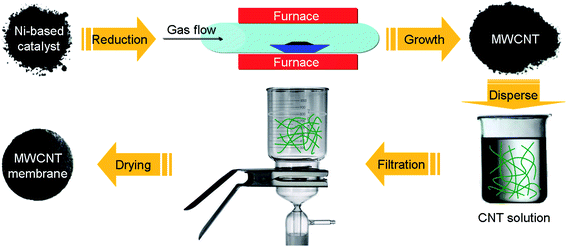 |
| | Scheme 1 Schematic illustration of the experiment process. | |
2. Experimental
2.1 Preparation of Ni-based catalysts
A mixture of Ni(NO3)2·6H2O, M(NO3)x·yH2O and NaOH (0.1 mol) in 80 mL water was stirred for 1 h at room temperature. The wet solid was dried at 100 °C and then calcined in air at 400–600 °C for 2.5 h in order to obtain the oxidic form of the catalyst precursor. After slowly cooling to room temperature, followed by ball-milling and filtering, the catalyst samples were obtained. A list of the samples produced and the experimental variables used in their synthesis are provided in Table 1.
Table 1 List of the samples and the corresponding experimental variables (ratio and calcination temperature) of the catalysts
| Catalyst |
Ratio of the catalyst |
Calcination temperature (°C) |
| Ni(NO3)2·6H2O |
Al(NO3)3·9H2O |
Mg(NO3)2·6H2O |
Mn(NO3)2·4H2O |
La(NO3)3·6H2O |
| Ni-1# |
2 |
1 |
— |
— |
— |
400 |
| Ni-2# |
2 |
1 |
— |
0.25 |
— |
400 |
| Ni-3# |
2 |
0.25 |
— |
0.75 |
— |
400 |
| Ni-4# |
2 |
— |
— |
— |
1 |
400 |
| Ni-5# |
2 |
— |
1 |
0.25 |
— |
400 |
| Ni-6# |
2 |
— |
1 |
0.25 |
— |
500 |
| Ni-7# |
2 |
— |
1 |
0.25 |
— |
600 |
2.2 Preparation of diameter-controlled MWCNTs
The catalyst (80 mg), in its oxidic form, was placed in a quartz boat inside a quartz tube (diameter 80 mm, length 1100 mm), located in an horizontal electrical furnace, and flushed for 30 min in flowing pure nitrogen (240 mL min−1, 99.99% purity) from room temperature to 800 °C; then hydrogen (200 mL min−1, 99.99% purity) was introduced to deoxidize the catalyst for 10–80 min. After this treatment, the hydrogen flow was shut off and the furnace was heated to reach 660 °C, and then the nitrogen flow was replaced by propylene (100 mL min−1, 99.99% purity), nitrogen (240 mL min−1, 99.99% purity), and hydrogen (20 mL min−1, 99.99% purity). The mixture flow lasted for 1 h and was then replaced by nitrogen and the furnace was cooled to room temperature. A list of the samples produced and the experimental variables used in their synthesis are provided in Table 2.
Table 2 List of the samples and the corresponding experimental variables (synthesis temperature, time, and flow rate of the carrier gas) of MWCNTs
| Experiment |
Reduction time (min) |
Catalyst |
Catalyst size (nm) |
Diameter of MWCNT (nm) |
Raman ID/IG |
| 1 |
10 |
Ni-1# |
10.0 |
10–20 |
1.24 |
| 2 |
20 |
Ni-1# |
10.6 |
20–30 |
1.18 |
| 3 |
40 |
Ni-1# |
11.3 |
30–40 |
1.05 |
| 4 |
80 |
Ni-1# |
11.5 |
40–50 |
0.90 |
| 5 |
80 |
Ni-2# |
11.6 |
50–60 |
0.87 |
| 6 |
80 |
Ni-3# |
12.3 |
60–70 |
0.79 |
| 7 |
80 |
Ni-4# |
12.5 |
70–80 |
0.68 |
| 8 |
80 |
Ni-5# |
13.0 |
80–90 |
0.65 |
| 9 |
80 |
Ni-6# |
13.5 |
90–100 |
0.65 |
| 10 |
80 |
Ni-7# |
13.8 |
>100 |
0.64 |
2.3 Characterization of catalysts and MWCNTs
The morphology and structure of the MWCNT samples were characterized by scanning electron microscopy (SEM, Nova NanoSEM 430) and high-resolution transmission electron microscopy (HRTEM, JEOL2010 at 200 kV). Laser Raman spectroscopy (JY HR800) was used to estimate the diameter and quality of the MWCNTs. X-ray diffraction (XRD) patterns of the powdered samples were recorded at room temperature using a D/Max-2500PC diffractometer with a Cu Kα non-monochromatic radiation source (λ = 1.54056 Å). Infrared spectra were recorded with a Varian 640 FT-IR spectrometer with KBr pellets in the range of 4000–500 cm−1. X-ray photoelectron spectroscopy (XPS) was performed using an Escalab 250 system with Al Kα. The specific surface area and pore structure of the samples were investigated with an automatic volumetric sorption analyzer (ASAP 2020 M) using N2 as the adsorbate at −196 °C. The zeta potentials of the various samples were obtained on a Zetasizer Nano instrument (Malvern, UK) at 298 K. The UV-vis absorption spectra were obtained using a SP-1900 UV-vis spectrophotometer.
2.4 Preparation of the free-standing MWCNT membranes
Free-standing MWCNT membranes were fabricated by a simple filtration method (Scheme 1). About 20 mg MWCNTs were ultrasonicated in 200 mL of a 0.5 wt% sodium dodecyl sulfate (SDBS) water solution. The suspension was then filtered using a porous cellulose membrane filter with a pore diameter of 0.42 mm. The sheet resistivity of the films was measured by a four-point probe meter (4-probe tech.). A list of the optical photographs and resistances of the free-standing MWCNT membranes are provided in Scheme 2.
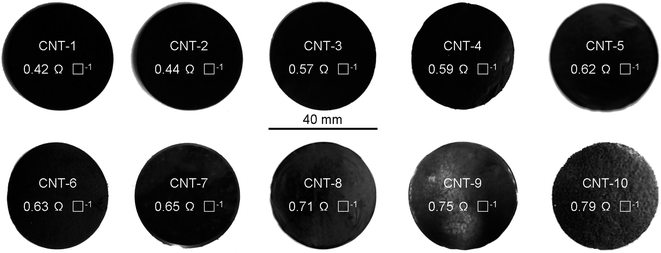 |
| | Scheme 2 The optical photographs and resistances of the free-standing MWCNT membranes. | |
2.5 Dye adsorption of the MWCNT membranes
The adsorption process was conducted at room temperature using aqueous solutions of five dyes: methylene blue (MB), rhodamine B (RhB), methyl orange (MO), Congo Red (CR), and gentian violet (GV), respectively. In a typical experiment, the MWCNT membrane (5 mg) was added into an aqueous dye solution (100 mL, 10 mg L−1 for MB, RhB and GV, 40 mg L−1 for MO, 80 mg L−1 for CR), which was subsequently stirred at room temperature. At 30 min time intervals, the dye concentration was measured via UV-vis spectroscopy at the maximum absorbance of each dye (664, 553, 465, 490, and 590 nm for MB, RhB, MO, CR, and GV, respectively).
The effects of the different temperatures, contact times, and concentrations on the adsorption of RhB by CNT were tested. Meanwhile, the adsorption isotherms, adsorption thermodynamics, kinetics, and mechanism were investigated in detail. The initial concentrations were in the range of 10 mg L−1 for MB and GV, 1–10 mg L−1 for RhB, 40 mg L−1 for MO, and 80 mg L−1 for CR, and the samples were kept at a constant temperature until equilibrium was reached. Subsequently, the concentrations of the five dyes at equilibrium were determined via UV-vis spectroscopy. The adsorption amount, qe (mg g−1), was calculated according to the following eqn (1):
| |
 | (1) |
where
Co and
Ce represent the initial concentration (mg L
−1) and equilibrium concentration of the dyes (mg L
−1),
W denotes the mass of the adsorbent (g), and
V represents the volume (mL) of each of the five dye solutions, respectively.
In the thermodynamic study, 5 mg of adsorbent was added to a 100 mL aqueous RhB solution with concentrations of 1–10 mg L−1 at temperatures of 298, 303, 313, and 323 K, respectively, until the adsorption equilibrium was reached, so as to study the effect of temperature on the adsorption performance. The effect of the concentration on the adsorption performance of RhB was also investigated by adding the same mass (5 mg) of adsorbent to the aqueous solutions with different concentrations of RhB. The effect of the contact time on the concentration was also studied. Next, 5 mg of adsorbent was added to a 100 mL aqueous solution with RhB concentrations of 10 mg L−1, respectively. At a predetermined time interval, samples of this solution were taken, and the concentrations of RhB in each sample solution were determined. During these periods, the adsorption capacity qt (mg g−1) of the adsorbent was calculated by the following formula (2):
| |
 | (2) |
where
Ct (mg L
−1) represents the concentrations of RhB at time
t.
3. Results and discussion
3.1 Structure description of the catalysts and MWCNTs
To understand why the MWCNT diameters depended on the catalyst, we performed a study to gain an insight into the properties of the catalyst. First, we studied the effects of the catalyst reduction time on the MWCNTs' growth over 10, 20, 40, and 80 min at a temperature of 800 °C. The PXRD patterns in Fig. 1 demonstrate the peak intensity of Ni(111), (200), and (222)28 increased with the reduction time. The average Ni catalyst particle sizes calculated from Ni(111) by means of the Debye–Scherrer equation28 were, in turn, 10.0, 10.6, 11.3, and 11.5 nm, suggesting that the Ni particles were relatively stable at the temperature of 800 °C. When hydrogen was introduced at any time between 10 min and 80 min, MWCNTs sized 10–50 nm were obtained. Changes in the timing of the H2 introduction led to significant changes in the diameter of the MWCNTs, because the Ni clusters coarsened at a rate that increased with time.29 The clusters that were formed by agglomeration of the nanoparticles after reduction of the catalysts were initially small, and consequently closely spaced. Continuing annealing in the presence of H2 allowed the clusters to coarsen. This process, driven by surface energy minimization, occurred through the transport of Ni among the clusters, either through the vapor phase, or more likely by diffusion of Ni as adatoms on the support (Al2O3, MgO, or La2O3) surface. In coarsening processes, small clusters tend to shrink and disappear with their mass being redistributed to larger clusters.29 This process therefore results in an increase in the average cluster size as well as an increase in the average cluster spacing. These trends are consistent with the observed trends in the average MWCNT diameter observed here (Fig. 2a–c and S2a–c†).
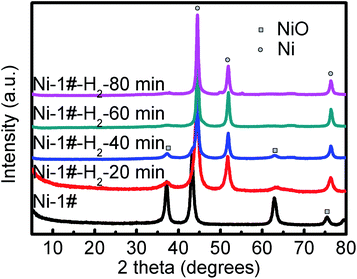 |
| | Fig. 1 PXRD patterns of the effects of the catalyst reduction time before and after H2 reduction for the Ni-1# catalyst. | |
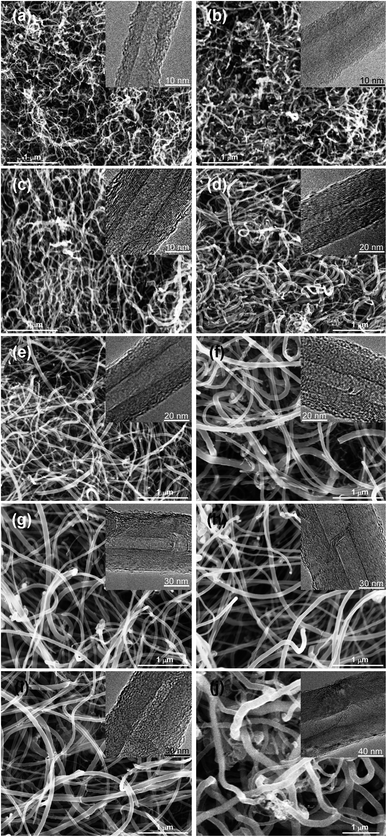 |
| | Fig. 2 SEM images of the samples with different diameters: (a) CNT-1: 10–20 nm; (b) CNT-2: 20–30 nm; (c) CNT-3: 30–40 nm; (d) CNT-4: 40–50 nm; (e) CNT-5: 50–60 nm; (f) CNT-6: 60–70 nm; (g) CNT-7: 70–80 nm; (h) CNT-8: 80–90 nm; (i) CNT-9: 90–100 nm; (j) CNT-10: >100 nm. Insert: corresponding TEM images of the samples. | |
Second, the catalyst properties also depend on the local degree of alkalinity or acidity of the catalytic surface.30,31 Al2O3, MgO, or La2O3 have a weak alkalinity and may be considered as soft bases. The Ni or Ni–Mn particles have a weak acidity, but are heavy acids. Hence, a small increase or decrease in the Ni or Ni–Mn loading causes a significant increase or decrease in the local surface acidity. Thus, when, the Ni or Ni–Mn/Al2O3 ratio was high, as in catalysts Ni1#–Ni3#, the surface acidity was high and the interaction between the strong acid Ni or Ni–Mn and the soft base Al2O3 was low. This led to the high mobility of the Ni or Ni–Mn particles on the Al2O3 support and to more conglomeration into larger Ni or Ni–Mn particles, which in turn led to the larger diameters.31 The PXRD patterns of Fig. 1 and 3a, b show that the average Ni catalyst particle sizes were in turn 11.5, 11.6, 12.3, and 12.5 nm, which allowed concluding that the interaction between Ni/Ni–Mn and Al2O3 was strong, leading to a high mobility and big sizes of the Ni or Ni–Mn particles and hence bigger diameter catalysts and larger diameter MWCNTs (Fig. 2d–f and S2d–f†).
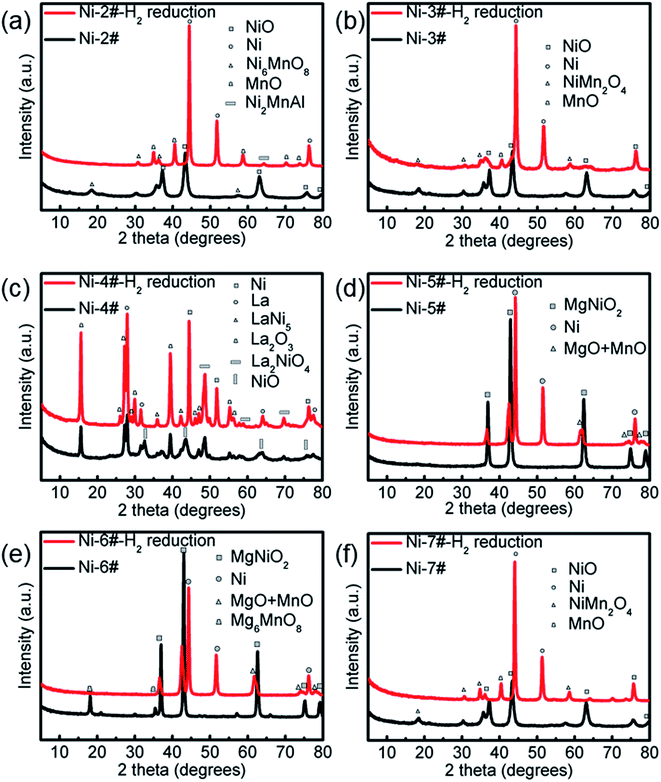 |
| | Fig. 3 PXRD patterns of the different Ni-loaded catalysts before and after H2 reduction for the Ni-2# catalyst (a), Ni-3# catalyst (b), Ni-4# catalyst (c), Ni-5# catalyst (d), Ni-6# catalyst (e) and Ni-7# catalyst (f). | |
Indeed, the MWCNTs produced on catalysts Ni1#–Ni3# had smaller diameters to those produced on catalyst Ni4# (Fig. 2g and S2g†), in which La2O3 has a weaker alkalinity than Al2O3.31 These results are in very close agreement with the XRD results, in which the average Ni catalyst particle size was 11.5 nm (Fig. 3c). The data suggest that the catalyst composition is the dominant factor controlling the diameters of the MWCNTs.
The utilization of MgO as a support has many advantages over conventional supports like Al2O3, and La2O3.31 In particular, the removal of the support and the catalyst metals (Ni and Mn) can be easily done by mild acid treatment, washing with distilled water, and filtration, which reduces the purification cost. MgO has a smaller radius and greater surface area than conventional supports (i.e., Al2O3, La2O3), so, it can retain more active nanometals on its surface. Additionally, the need for multi-step processes and hazardous chemicals are avoided. The XRD patterns in Fig. 3d show that the average Ni catalyst particle size was 11.5 nm, and the diameter of the MWCNTs was larger than those produced on catalyst Ni1#–Ni4# (Fig. 2h and S2h†).
Additionally, the diameter increased along with the increase in the catalyst calcination temperature.32 This might have resulted from the fact that the catalyst calcined at higher temperatures had more resistance to decomposition at the high reaction temperatures compared to the catalyst calcined at lower temperatures. In other words, the catalyst calcined at a lower temperature was thermally less stable compared to the one calcined at a higher temperature. The PXRD patterns in Fig. 3d–f show that the average Ni catalyst particle sizes increased (13.0, 13.5, and 13.8 nm) with the catalyst calcination temperature, and the diameters of MWCNTs increased with the catalyst particle size increasing (Fig. 2h–j and S2h–j†).
Raman spectroscopy was used to compare the quality and defects of the synthesized MWCNTs. The use of the D band to G band intensity ratio ID/IG as a criterion for estimating the defect content on the CNT surfaces is based on the assumption that the G band is a first-order Raman scattering process, which is unrelated to the D band, a defect-dependent, second-order Raman scattering process.33 Fig. 4a shows that the ID/IG intensity ratio decreased with increasing the MWCNTs' diameter. This can be ascribed to either the increase in curvature or the accumulated defects in the MWCNTs. We believe that the curvature effect plays an important role here. Smaller diameter MWCNTs have a higher sp3 to sp2 ratio so that the ID/IG intensity ratio is higher than would be expected for a linear trend. Thus, the curvature effect greatly enhances the ID/IG intensity ratio dispersion in small-diameter MWCNTs.
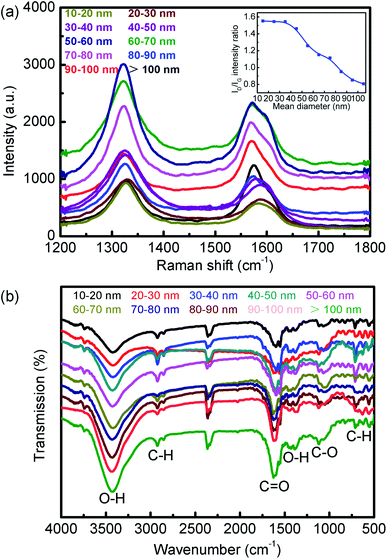 |
| | Fig. 4 (a) Raman spectra of different MWCNT samples; (b) IR spectra of different MWCNT samples. | |
The performance of carbon materials depends greatly on their texture and surface chemistry. The presence of oxygen-containing functional groups on the surface of carbon materials can greatly alter their adsorption properties. Fig. 4b shows the FT-IR spectrum of the title MWCNTs. The two bands at 2854 and 2924 cm−1 were assigned to –CH2– vibration. The strong O–H stretching bands at about 3425 cm−1 as well as the C–OH stretching bands in the range of 1000–1300 cm−1 were all characteristic of hydroxyl groups.34,35 The well-defined peaks at 1389 and 1427 cm−1 and the discernable shoulder peaks at 1551 and 1599 cm−1 could be assigned to the symmetric νs(COO) and asymmetric νas(COO) stretching modes of carboxylate groups, respectively.34,35 The FT-IR results thus indicated that the surface of the MWCNTs obtained in this work was also extensively functionalized with abundant oxygen-containing (–OH and –COO–) groups, which could significantly improve the adsorption performance.36
XPS can be used in two ways to achieve some quantitative analysis of surface oxygen: by deconvolution of the XPS of either the C 1s region, indicating different carbon species bound to oxygen, or the O 1s region, showing singly or doubly bound oxygen to carbon (Fig. 5 and S3†).37 Deconvolution of the C 1s region was impossible here due to the dominant graphite peak at about 284.5 eV. Two peaks could, however, be easily deconvoluted in the O 1s region at 531.5 and 532.5 eV, which could be attributed to (C![[double bond, length as m-dash]](https://www.rsc.org/images/entities/char_e001.gif) O) double bonds found in quinones, ketones, and aldehydes and to (C–O) single bonds from ethers, hydroxyls and phenols, respectively. Esters, lactones, carboxyl groups, anhydrides, and pyrones equally contribute to both peaks, as they possess both bond types.38
O) double bonds found in quinones, ketones, and aldehydes and to (C–O) single bonds from ethers, hydroxyls and phenols, respectively. Esters, lactones, carboxyl groups, anhydrides, and pyrones equally contribute to both peaks, as they possess both bond types.38
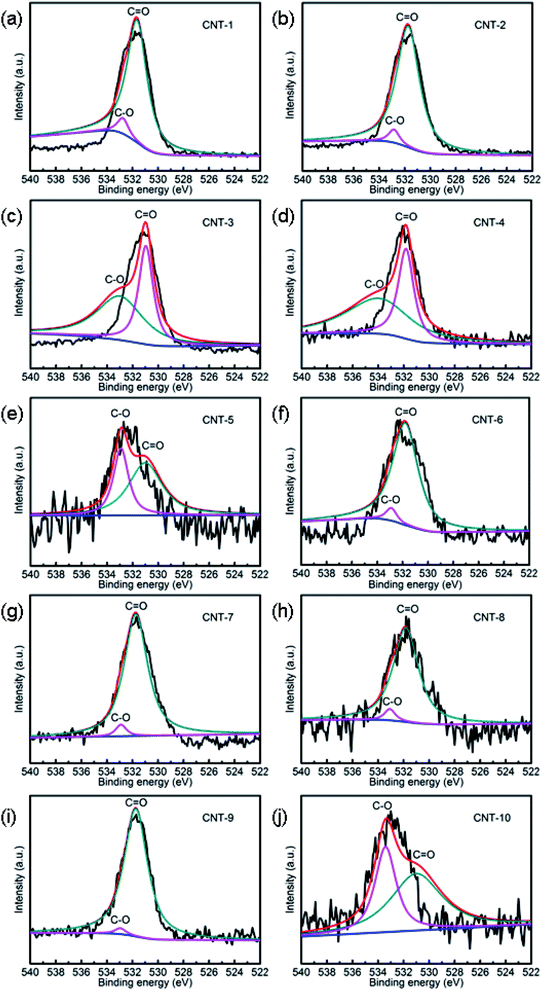 |
| | Fig. 5 XPS analysis of the O 1s spectra of CNT-1 (a), CNT-2 (b), CNT-3 (c), CNT-4 (d), CNT-5 (e), CNT-6 (f), CNT-7 (g), CNT-8 (h), CNT-9 (i) and CNT-10 (j). | |
3.2 Dye-adsorption properties of the free-standing MWCNT membranes
Due to the importance of environmental protection, the removal of dyes from wastewater has drawn much attention.39,40 In this work, the adsorption behaviors of MWCNTs were evaluated using RhB as a model adsorbate. The results of RhB (10 mg L−1) adsorption monitored by UV-vis spectroscopy in the dark are shown in Fig. 6 and S4.† When the adsorption time increased to 240 min, the adsorption ratio of RhB reached 98%, as well as the adsorption amount of RhB reached 195 mg g−1 with CNT-1, which was higher than for the other MWCNTs. Four other organic dyes, namely MB, GV, MO, and CR, were used to evaluate the adsorption selectivity. It could be seen that the adsorption activities were 76% for MB, 92% for GV, 51% for MO, and 73% for CR after 240 min in the dark. We can thus see that the removals of MO and CR from the solution were not as apparent as for RhB, MB, and GV. These results clearly show that the CNT-1 exhibited a superior adsorption capability toward cationic dyes than to anionic dyes. This can be attributed to the different chemical compositions of these two kinds of dyes.
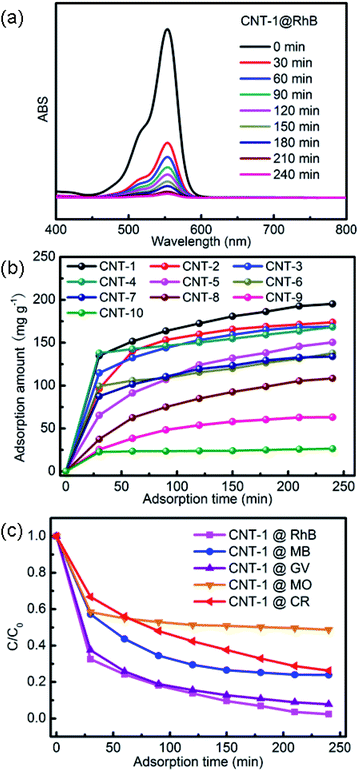 |
| | Fig. 6 (a) UV-vis spectra of RhB solution after different adsorption times with CNT-1 in the dark; (b) the adsorption amounts of RhB at different times with the title MWCNTs; (c) adsorption ratios of RhB, MB, GV, MO, and CR solutions in the dark with the use of CNT-1. | |
According to previous reports, an important mechanism for dye adsorption is host–guest interactions, such as hydrogen bonding, π–π stacking, electrostatic interactions, and so forth.41 In this case, the hydrogen bonding interactions between the –COOH groups (from RhB) and the oxygen atoms of the MWCNTs (from –OH) may be responsible for the selective adsorption. Consequently, the electron-withdrawing power of the oxygen atoms in the –OH bonds of the carboxylate was strengthened, such that hydrogen bonds could be readily formed with the hydrogen atoms of the –COOH groups in RhB, thus leading to the adsorption of this dye. It is evident that the adsorption of RhB was governed by the hydrogen bonding interactions between hydrogen atoms in the –COOH groups of the RhB molecule and the oxygen atom in the carboxylate groups of CNT-1. Adsorption occurred rapidly during the initial 30 min due to the presence of vacant sites, but the initially vacant sites were occupied after 30 min, leading to a reduction in the adsorption rate. This adsorbent can more readily adsorb anionic dyes than cationic dyes. To investigate the dye-adsorption mechanism of the title MWCNTs, zeta potential (ZP) measurements were conducted in an ethanol solution with CNT-1–10, respectively. As shown in Table 3, the title MWCNTs had different negative charges (from −4.17 to −0.46 mV) in ethanol because of the oxygen-containing (–OH and –COO–) groups of the CNTs,42 whereas a positive ZP value (+2.70 mV) was exhibited in the ethanol solution containing 10 mg L−1 RhB. Therefore, the favorable removal of RhB could be ascribed to the strong electrostatic attraction between the positively charged aqueous solution of RhB and the negatively charged surfaces of the CNTs. Furthermore, smaller diameter MWCNTs have a higher sp3 to sp2 ratio so that more functionalized MWCNTs with abundant oxygen-containing (–OH and –COO–) groups will be obtained. Parallel experiments in the dark with other diameters of MWCNTs were also performed for comparison. It was found that the adsorption capacity increased with the decrease in the diameter of the MWCNTs and the adsorption properties of the nanotubes depended on the CNT diameter (Fig. 7 and S4–S8†). Meanwhile, the free-standing MWCNT membranes (CNT-1–10) had specific surface areas from 587.48 to 82.63 m2 g−1 but no open pores ranging from 2 to 200 nm, respectively (Fig. S9†), which indicated that the adsorption amount of dyes onto CNTs may be related to the surface area.
Table 3 List of the samples and corresponding parameters (ZP value, percentage of O atom, and specific surface area) of the MWCNTs
| MWCNT |
ZP value (mV) |
Percentage of O atom (%) |
Specific surface area (m2 g−1) |
| CNT-1 |
−4.17 |
7.87 |
587.48 |
| CNT-2 |
−3.91 |
7.15 |
498.42 |
| CNT-3 |
−3.19 |
6.56 |
199.10 |
| CNT-4 |
−3.08 |
3.84 |
184.46 |
| CNT-5 |
−2.61 |
3.34 |
182.98 |
| CNT-6 |
−1.64 |
3.04 |
171.58 |
| CNT-7 |
−1.48 |
2.42 |
151.37 |
| CNT-8 |
−1.34 |
2.33 |
145.76 |
| CNT-9 |
−0.59 |
2.02 |
143.39 |
| CNT-10 |
−0.46 |
1.73 |
82.63 |
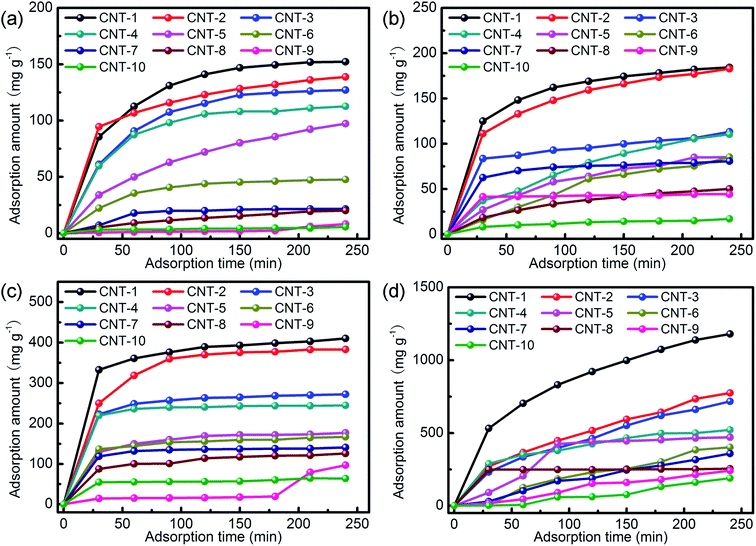 |
| | Fig. 7 The adsorption amounts of MB (a), GV (b), MO (c), and CR (d) at different times with the title MWCNTs. | |
3.3 Effect of temperature on the adsorption performance
Temperature is one of the most important factors influencing the adsorption process. It was observed that as the temperature rose above room temperature, adsorption increased, while a further increment to higher temperatures led to a decrement in the adsorption of the adsorbate. The adsorption capacity of CNT-1 for RhB was investigated in the range of room temperature to 50 °C as depicted in Fig. 8 and S10.† It was noted that the adsorption efficiency of the CNTs increased as the temperature went up from room temperature to 50 °C. The increment in the adsorption efficiency for RhB was 195 mg g−1 to 197 mg g−1 in this temperature range. This may be due to the enhancement of the electrostatic interactions between the MWCNTs and dye molecules at elevated temperatures. The results show that the adsorption of CR on MWCNT is an endothermic process.
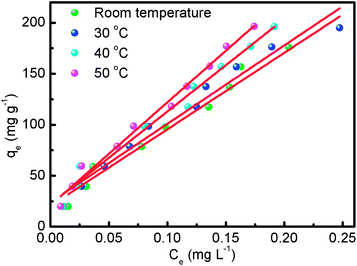 |
| | Fig. 8 Effect of different temperatures on RhB adsorbed by CNT-1. | |
3.4 Adsorption kinetics and thermodynamics
The initial concentration of the solution is another important factor affecting the adsorption process. The effect of the initial concentration of RhB on the adsorption behavior of CNT-1 was investigated in the range of 1 to 10 mg L−1 (Fig. 9 and S10†). The investigation of the adsorption mechanism of RhB on CNT-1 was conducted using Langmuir and Freundlich isotherm models. The Langmuir model assumes that adsorption occurs uniformly on the surface to essentially form a monolayer of the adsorbed compound on the surface of the sorbent, while the Freundlich model assumes that the adsorption process occurs on non-uniform surfaces.43,44 The linear forms of the Langmuir and Freundlich isotherm models are represented by the eqn (3) and (4), respectively:44| |
 | (3) |
| |
 | (4) |
where Ce (mg L−1) is the dye concentration at equilibrium, KL (L mg−1) and KF ((mg g−1)(L mg−1)1/nF) are the Langmuir and Freundlich constants, respectively, and 1/n is related to the adsorption intensity. A dimensionless constant (RL), which is referred to as separation factor, is commonly expressed as:44| |
 | (5) |
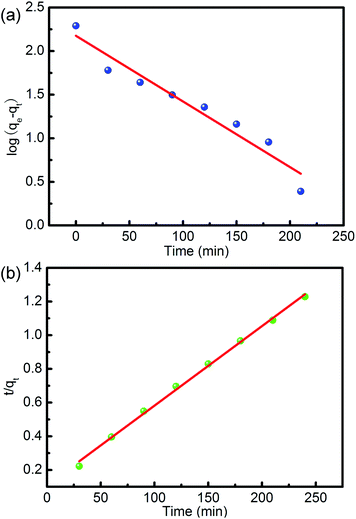 |
| | Fig. 9 Adsorption kinetics of CR adsorbed by CNT-1: (a) pseudo-first-order model; (b) pseudo-second-order model. | |
This factor suggests the type of adsorption isotherm as thermodynamically favorable (0 < RL < 1), unfavorable (RL > 1), and irreversible (RL = 0). The linear plots of the Langmuir and Freundlich isotherms for dye adsorption on CNT-1 are depicted in Fig. S11.† All the RL values were found to be between 0 and 1, suggesting the favorable adsorption of both the investigated dyes on CNT-1 adsorbents. The linear isotherm constants (Table 4) indicated that the adsorption of RhB on CNT-1 could be well described by the Freundlich isotherm model at room temperature and 30 °C as well as by the Langmuir isotherm model at 40 °C and 50 °C. The explanation for the higher removal efficiency is the increased mobility of the dye molecules and as enough energy is also given at high temperature for the interaction between the dye molecules and the adsorption sites available therein. The CNT-1 adsorbent showed a value of Freundlich constant n larger than 1, which could present that adsorption occurred on a heterogenous surface, likely caused by the presence of different functional groups on the surface.
Table 4 The adsorption isotherm constants from the Langmuir and Freundlich model for CR onto CNT-1
| Temperature (°C) |
Langmuir |
Freundlich |
| qmax (mg g−1) |
kL (L mg−1) |
R2 |
RL |
kF (L mg−1) |
1/n |
R2 |
| Room temperature |
195.05 |
4.74 × 10⁻⁴ |
0.9404 |
0.9953–0.9995 |
6.4101 |
0.7848 |
0.9746 |
| 30 °C |
195.06 |
5.72 × 10⁻⁴ |
0.8962 |
0.9942–0.9994 |
6.4056 |
0.7566 |
0.9958 |
| 40 °C |
196.17 |
3.76 × 10⁻⁴ |
0.8835 |
0.9963–0.9996 |
6.4581 |
0.7311 |
0.9653 |
| 50 °C |
196.51 |
4.46 × 10⁻⁴ |
0.8116 |
0.9956–0.9996 |
6.5053 |
0.7225 |
0.9838 |
Several kinetic models, including the quasi-first-order kinetic model and the quasi-second-order kinetic model, are often used to evaluate adsorption data. Fig. 6 shows the adsorption capacity of CNT-1 as a function of time for RhB. The adsorption capacity increased rapidly at the early stage and gradually reached equilibrium. This observation indicated the rapid and efficient adsorption of RhB over the CNT-1 adsorbent throughout the first 100 min. Considering the results, it could be concluded that the adsorption of RhB on CNT-1 took place over two phases: a fast initial adsorption of dye molecules on the available sites, followed by a slow phase until equilibrium was attained. The kinetics of the adsorption process on CNT-1 was evaluated by pseudo-first-order and pseudo-second-order models by considering eqn (6) and (7), respectively.43,44
| |
ln(qe − qt) = ln![[thin space (1/6-em)]](https://www.rsc.org/images/entities/char_2009.gif) qe − k1t qe − k1t
| (6) |
| |
 | (7) |
where
qe and
qt are the adsorption capacity at equilibrium and at time
t, respectively, and
k1 (min
−1) and
k2 (g mg
−1 min
−1) are the rate constant of pseudo-first-order and pseudo-second-order models, respectively. The kinetic model parameters were obtained from the plot of the adsorption data
versus time (
Fig. 9). The obtained results (
Table 5) revealed that the pseudo-second-order model more accurately described the kinetics of adsorption of the investigated RhB on CNT-1.
Table 5 The parameters of the pseudo-first-order and pseudo-second-order models
| Kinetic model |
Parameters |
10 mg L−1 |
| Pseudo-first-order model |
k1 (min−1) |
−0.0075 |
| qe (mg g−1) |
2.1760 |
| R2 |
0.9336 |
| Pseudo-second-order model |
k2 (g mg−1 min−1) |
0.0047 |
| qe (mg g−1) |
0.1098 |
| R2 |
0.9973 |
In order to study the effect of temperature on the adsorption of RhB by CNT-1, the thermodynamic parameters of CNT-1 and RhB were determined at different temperatures. The enthalpy change (ΔH), entropy change (ΔS), and Gibbs free energy (ΔG) were calculated using eqn (8) and (9):43,44
| |
ΔG° = −RT![[thin space (1/6-em)]](https://www.rsc.org/images/entities/char_2009.gif) ln(K) ln(K)
| (8) |
| |
 | (9) |
where
R (8.314 J mol
−1 K
−1) is the universal gas constant,
T (K) is absolute temperature, and K (dimensionless) is the adsorption equilibrium constant. The effect of temperature on the adsorption of dyes on the CNT adsorbent was studied from 298 to 323 K (
Table 6). The enthalpy and entropy were obtained by the van't Hoff equation from the plot of ln
![[thin space (1/6-em)]](https://www.rsc.org/images/entities/char_2009.gif) Ke versus
Ke versus 1/
T (Fig. S12
†). Here, Δ
G was negative, indicating that the adsorption process was spontaneous. In addition, as the temperature increased from 298 to 323 K, the Δ
G of RhB decreased from −234.96 to −255.75 kJ mol
−1, indicating that a higher temperature is more favorable for adsorption. Meanwhile, the positive value of Δ
H (12.81 kJ mol
−1) confirmed that the interactions between CNT-1 and RhB were endothermic processes. The positive entropy change Δ
S indicated that the randomness of the system increased the RhB was adsorbed onto CNT-1.
Table 6 Thermodynamic parameters at different temperatures
| T (K) |
ΔG (kJ mol−1) |
ΔH (kJ mol−1) |
ΔS (kJ mol−1 K−1) |
| 298 |
−234.96 |
12.81 |
0.10 |
| 303 |
−239.12 |
|
|
| 313 |
−247.43 |
|
|
| 323 |
−255.75 |
|
|
3.5 Cyclic adsorption/desorption performance
The cyclic adsorption/desorption performance of the CNT-1 was studied with a constant RhB concentration (10 mg L−1) and amount of adsorbent (5 mg). After each cycle (240 min) of RhB adsorption, the CNT-1 was dipped into ethanol to desorb RhB. The amount of RhB in ethanol reached about 191 mg g−1 after 4 h (Fig. 10a). The residual unreleased RhB (∼4 mg g−1) could be ascribed to chemical adsorption. The recovered CNT-1 was dried at 50 °C and reused for adsorption in the following cycles. There was no obvious adsorption decrease observed after five cycles (Fig. 10b), indicating the reversible adsorption and desorption ability of the CNT-1.
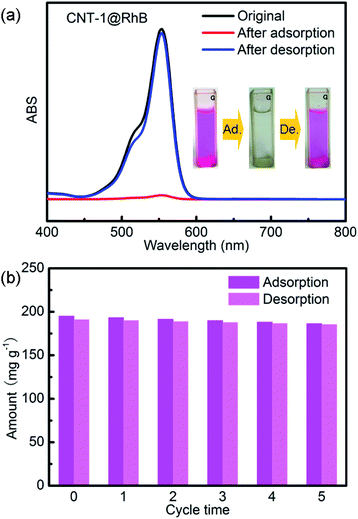 |
| | Fig. 10 (a) UV-vis spectra of RhB solution before adsorption, and after adsorption and desorption with CNT-1. (b) The cycling stability of the adsorption/desorption of RhB on CNT-1. | |
4. Conclusion
A simple CVD method was developed for producing MWCNTs with different diameters, while high-purity, free-standing membranes were fabricated by a simple filtration of the as-grown MWCNTs. The process resulted in an increase in the average cluster size as well as an increase in the average cluster spacing. These trends were consistent with the observed trends in the average MWCNT diameter. The results indicated that the surface of the MWCNTs obtained in this work was also extensively functionalized with abundant oxygen-containing (–OH and –COO–) groups, which could significantly improve the adsorption performance. The results clearly showed that the MWCNTs exhibited superior adsorption capabilities toward cationic dyes than to anionic dyes. This could be attributed to the different chemical compositions of these two kinds of dyes. The adsorption of the investigated organic dyes on the MWCNTs was described by the Freundlich isotherm and pseudo-second-order kinetic models. All the results suggested that the MWCNTs are effective adsorbents for removal of dye pollutants, and thus have potential to be used as a new platform for commercial dye decontamination.
Conflicts of interest
The authors declare no competing financial interest.
Acknowledgements
This work was financially supported by the Liaoning Provincial Department of Education Fund (LQ2019004 and LZ2019005). Y. Li, X. Ma and Z. Yang thank the support from College Students' Innovative Entrepreneurial Training Plan Program of Liaoning Province (No. S202010149062).
Notes and references
- I. Ali, Chem. Rev., 2012, 112, 5073–5091 CrossRef CAS PubMed.
- Y. Li, X. F. Yin, F. R. Chen, H. H. Yang, Z. X. Zhuang and X. R. Wang, Macromolecules, 2006, 39, 4497 CrossRef CAS.
- L. Zhu, T. Ghosh, C. Y. Park, Z. D. Meng and W. C. Oh, Chin. J. Catal., 2012, 33, 1276 CrossRef CAS.
- L. Zhang, Y. Nie, C. Hu and J. Qu, Appl. Catal., B, 2012, 125, 418 CrossRef CAS.
- T. Li, L. Zhao, Y. He, J. Cai, M. Luo and J. Lin, Appl. Catal., B, 2013, 129, 255 CrossRef CAS.
- J. Luan, P. X. Hou, C. Liu, C. Shi, G. X. Li and H. M. Cheng, J. Mater. Chem. A, 2016, 4, 1191 RSC.
- V. K. Gupta, R. Kumar, A. Nayak, T. A. Saleh and M. A. Barakat, Adv. Colloid Interface Sci., 2013, 193–194, 24 CrossRef CAS PubMed.
- C. Kim, Y. S. Chio, S. M. Lee, J. T. Park, B. Kim and Y. H. Lee, J. Am. Chem. Soc., 2002, 124, 9906 CrossRef CAS PubMed.
- S. Saber-Samandari, S. Saber-Samandari, H. Joneidi-Yekta and M. Mohseni, Chem. Eng. J., 2017, 308, 1133 CrossRef CAS.
- M. Zhang, Y. T. Wang, Y. W. Zhang, L. Ding, J. Zheng and J. L. Xu, Appl. Surf. Sci., 2016, 375, 154 CrossRef CAS.
- J. Chen, S. Xue, Y. T. Song, M. L. Shen, Z. H. Zhang, T. X. Yuan, F. Y. Tian and D. D. Dionysiou, J. Hazard. Mater., 2016, 310, 226 CrossRef CAS PubMed.
- R. H. Gangupomu, M. L. Sattler and D. Ramirez, J. Hazard. Mater., 2016, 302, 362 CrossRef CAS PubMed.
- X. M. Ren, C. L. Chen, M. Nagatsu and X. K. Wang, Chem. Eng. J., 2011, 170, 395 CrossRef CAS.
- D. Q. Zhu, S. H. Hyun, J. J. Pignatello and L. S. Lee, Environ. Sci. Technol., 2004, 38, 4361 CrossRef CAS PubMed.
- Y. Yan, M. Zhang, K. Gong, L. Su, Z. Guo and L. Mao, Chem. Mater., 2005, 17, 3457 CrossRef CAS.
- R. Ahmad and R. Kumar, J. Chem. Eng. Data, 2010, 55, 3489 CrossRef CAS.
- F. Liu, S. Chung, G. Oh and T. S. Seo, ACS Appl. Mater. Interfaces, 2012, 4, 922 CrossRef CAS PubMed.
- J. Li, C. L. Chen, S. W. Zhang and X. K. Wang, Environ. Sci.: Nano, 2014, 1, 488 RSC.
- W. Z. Li, S. S. Xie, L. X. Qian, B. H. Chang, B. S. Zou, W. Y. Zhou, R. A. Zhao and G. Wang, Science, 1996, 274, 1701 CrossRef CAS PubMed.
- N. R. Franklin, Y. M. Li, R. J. Chen, A. Javey and H. J. Dai, Appl. Phys. Lett., 2001, 79, 4571 CrossRef CAS.
- F. Schäffel, C. Kramberger, M. H. Rümmeli, D. Grimm, E. Mohn, T. Gemming, T. Pichler, B. Rellinghaus, B. Büchner and L. Schultz, Chem. Mater., 2007, 19, 5006 CrossRef.
- C. Schünemann, F. Schäffel, A. Bachmatiuk, U. Queitsch, M. Sparing, B. Rellinghaus, K. Lafdi, L. Schultz, B. Büchner and M. H. Rümmeli, ACS Nano, 2011, 5, 8928 CrossRef PubMed.
- Z. X. Yu, D. Chen, B. Tøtdal and A. Holmen, Catal. Today, 2005, 100, 261 CrossRef CAS.
- H. Y. Shang, C. G. Liu, Y. Q. Xu, J. S. Qiu and F. Wei, Fuel Process. Technol., 2007, 88, 117 CrossRef CAS.
- A. I. Yardimci, S. Yılmaz and Y. Selamet, Diamond Relat. Mater., 2015, 60, 81 CrossRef CAS.
- X. W. Cui, W. F. Wei, C. Harrower and W. X. Chen, Carbon, 2009, 47, 3441 CrossRef CAS.
- P. Moodley, J. Loos, J. W. Niemantsverdriet and P. C. Thüne, Carbon, 2009, 47, 2002 CrossRef CAS.
- S. H. Wu and D. H. Chen, J. Colloid Interface Sci., 2003, 259, 282 CrossRef CAS PubMed.
- G. D. Nessim, A. J. Hart, J. S. Kim, D. Acquaviva, J. Oh, C. D. Morgan, M. Seita, J. S. Leib and C. V. Thompson, Nano Lett., 2008, 8, 3587 CrossRef CAS PubMed.
- I. Vesselényi, K. Niesz, A. Siska, Z. Kónya, K. Hernadi, J. B. Nagy and I. Kiricsi, React. Kinet. Catal. Lett., 2001, 74, 329 CrossRef.
- H. S. Roh and K. W. Jun, Catal. Surv. Asia, 2008, 12, 239 CrossRef CAS.
- C. Hocaoğlu and N. A. Sezgi, Chem. Eng. Commun., 2015, 202, 1041 CrossRef.
- S. Lee and J. W. Peng, J. Phys. Chem. Solids, 2011, 72, 1133 CrossRef CAS.
- L. J. Bellamy, The infrared spectra of complex molecules, Wiley, New York, 1958 Search PubMed.
- P. S. Kalsi, Spectroscopy of organic compounds, New Age International, New Delhi, India, 2008 Search PubMed.
- X. Wang, Z. J. Ma, L. L. Chai, L. Q. Xu, Z. Y. Zhu, Y. Hu, J. J. Qian and S. M. Huang, Carbon, 2019, 141, 643 CrossRef CAS.
- G. G. Wildgoose, P. Abiman and R. G. Compton, J. Mater. Chem., 2009, 19, 4875 RSC.
- S. Kundu, Y. Wang, W. Xia and M. Muhler, J. Phys. Chem. C, 2008, 112, 16869 CrossRef CAS.
- P. Y. Du, H. Li, X. Fu, W. Gu and X. Liu, Dalton Trans., 2015, 44, 13752 RSC.
- L. Liu, H. Y. Zhang, H. J. Wang, S. Chen, J. H. Wang and J. W. Sun, Eur. J. Inorg. Chem., 2019, 2019, 1839 CrossRef CAS.
- J. Luan, P. X. Hou, C. Liu, C. Shi, G. X. Li and H. M. Cheng, J. Mater. Chem. A, 2016, 4, 1191 RSC.
- Y. Wang, W. L. Zhang, J. X. Zhang, W. Sun, R. Y. Zhang and H. C. Gu, ACS Appl. Mater. Interfaces, 2013, 5, 10337 CrossRef CAS PubMed.
- H. S. Far, M. Hasanzadeh, M. S. Nashtaei, M. Rabbani, A. Haji and B. H. Moghadam, ACS Appl. Mater. Interfaces, 2020, 12, 25294 CrossRef CAS PubMed.
- X. P. Quan, Z. Q. Sun, J. L. Xu, S. Y. Liu, Y. D. Han, Y. Xu, H. Meng, J. B. Wu and X. Zhang, Inorg. Chem., 2020, 59, 2667 CrossRef CAS PubMed.
Footnote |
| † Electronic supplementary information (ESI) available. See DOI: 10.1039/d1ra06701j |
|
| This journal is © The Royal Society of Chemistry 2021 |
Click here to see how this site uses Cookies. View our privacy policy here.  Open Access Article
 *,
Ying-Ying Li,
Xiang-Rong Ma,
Ze-Zhou Yang and
Yu Liu*


![[double bond, length as m-dash]](https://www.rsc.org/images/entities/char_e001.gif) O) double bonds found in quinones, ketones, and aldehydes and to (C–O) single bonds from ethers, hydroxyls and phenols, respectively. Esters, lactones, carboxyl groups, anhydrides, and pyrones equally contribute to both peaks, as they possess both bond types.38
O) double bonds found in quinones, ketones, and aldehydes and to (C–O) single bonds from ethers, hydroxyls and phenols, respectively. Esters, lactones, carboxyl groups, anhydrides, and pyrones equally contribute to both peaks, as they possess both bond types.38


![[thin space (1/6-em)]](https://www.rsc.org/images/entities/char_2009.gif) qe − k1t
qe − k1t

![[thin space (1/6-em)]](https://www.rsc.org/images/entities/char_2009.gif) ln(K)
ln(K)

![[thin space (1/6-em)]](https://www.rsc.org/images/entities/char_2009.gif) Ke versus 1/T (Fig. S12†). Here, ΔG was negative, indicating that the adsorption process was spontaneous. In addition, as the temperature increased from 298 to 323 K, the ΔG of RhB decreased from −234.96 to −255.75 kJ mol−1, indicating that a higher temperature is more favorable for adsorption. Meanwhile, the positive value of ΔH (12.81 kJ mol−1) confirmed that the interactions between CNT-1 and RhB were endothermic processes. The positive entropy change ΔS indicated that the randomness of the system increased the RhB was adsorbed onto CNT-1.
Ke versus 1/T (Fig. S12†). Here, ΔG was negative, indicating that the adsorption process was spontaneous. In addition, as the temperature increased from 298 to 323 K, the ΔG of RhB decreased from −234.96 to −255.75 kJ mol−1, indicating that a higher temperature is more favorable for adsorption. Meanwhile, the positive value of ΔH (12.81 kJ mol−1) confirmed that the interactions between CNT-1 and RhB were endothermic processes. The positive entropy change ΔS indicated that the randomness of the system increased the RhB was adsorbed onto CNT-1.


