 Open Access Article
Carbon nanotubes/Al2O3 composite derived from catalytic reforming of the pyrolysis volatiles of the mixture of polyethylene and lignin for highly-efficient removal of Pb(II)†
Zhanghong Wang *ab,
Kun Qina,
Zhikang Wang*a,
Dekui Shen*b and
Chunfei Wu
 *c
*c
aCollege of Eco-Environmental Engineering, Guizhou Minzu University, Guiyang 550025, PR China. E-mail: z.wang@gzmu.edu.cn; wzk8726@sina.com
bKey Laboratory of Energy Thermal Conversion and Control of Ministry of Education, Southeast University, Nanjing 210096, PR China. E-mail: 101011398@seu.edu.cn
cSchool of Chemistry and Chemical Engineering, Queen's University Belfast, Belfast BT7 1NN, UK. E-mail: c.wu@qub.ac.uk
First published on 24th November 2021
Abstract
In the present study, the coked catalysts derived from catalytic reforming of the pyrolysis volatiles of polyethylene (PE), lignin (LG) and their mixture were developed as low-cost and environmentally-friendly carbon materials-containing composites to remove heavy metal ions from aqueous solution. The composites were thoroughly characterized by SEM, TEM, XRD, TGA and FT-IR and then their adsorption capability towards Pb(II) was investigated. It is found that curved cone-shape carbon nanotubes (CNTs) with abundant structural defects and O-containing surface functional groups, such as C–O, C![[double bond, length as m-dash]](https://www.rsc.org/images/entities/char_e001.gif) O and –OH, can be obtained from the catalytic reforming of the mixture of PE and LG. The CNT-containing catalyst composite presents a superior adsorption capability towards Pb(II) when it is employed in Pb(II) removal. Adsorption isotherm and adsorption kinetics studies show that the adsorption process can be well simulated by the Langmuir isotherm and pseudo-second-order model, demonstrating that the adsorption is subjected to a homogeneous and chemical process. The calculated maximum adsorption capacity is as high as 146.08 mg g−1, which is much higher than most of the adsorbents reported. Moreover, thermodynamic analysis reveals that the adsorption is spontaneous and endothermic. Accordingly, the used catalyst from the catalytic reforming can be developed as a low-cost and highly-efficient adsorbent.
O and –OH, can be obtained from the catalytic reforming of the mixture of PE and LG. The CNT-containing catalyst composite presents a superior adsorption capability towards Pb(II) when it is employed in Pb(II) removal. Adsorption isotherm and adsorption kinetics studies show that the adsorption process can be well simulated by the Langmuir isotherm and pseudo-second-order model, demonstrating that the adsorption is subjected to a homogeneous and chemical process. The calculated maximum adsorption capacity is as high as 146.08 mg g−1, which is much higher than most of the adsorbents reported. Moreover, thermodynamic analysis reveals that the adsorption is spontaneous and endothermic. Accordingly, the used catalyst from the catalytic reforming can be developed as a low-cost and highly-efficient adsorbent.
1 Introduction
Heavy metal-related contaminants mainly originate from anthropogenic activities such as industrial manufacture, energy production and transportation and are widely pervasive in our surroundings in the forms of dust, precipitation and ions in the air and drinking water.1,2 It is confirmed that the prolonged exposure to and excessive uptake of heavy metals would cause severe damage to body organs (kidneys, liver and brain), bone, blood and nervous systems due to their acute toxicity, and non-biodegradable and bioaccumulative nature.3 Accordingly, contamination and corresponding risks arising from heavy metals have attracted a large number of concerns. In the past few decades, strict standards about the limitations of individually toxic heavy metals have successively been set in most countries and important health institutions.4 For example, the maximum contaminant level for lead (Pb), chromium, cadmium, arsenic, mercury, copper, zinc and nickel in drinking water, several of the most representatives of heavy metals, is 0.01, 0.05, 0.003, 0.01, 0.06, 2, 3 and 0.07 mg g−1, respectively, according to the World Health Organization provisional guidelines.5 In order to achieve the goals, several methods involving ion exchange, chemical precipitation, reverse osmosis, membrane and ultrafiltration have been successfully developed to address heavy metals-related contaminations. However, most of these techniques show disadvantages such as low efficiency and extra energy or chemical requirements, which greatly limit their flexibility and applicability. By contrast, adsorption has generally been accepted as one of the most promising methods because of its high efficiency, cost-effectiveness, sludge-free and simplicity.6 Up to now, a large amount of adsorbents has been applied in adsorption techniques, such as virgin biomass, biomass-based carbon materials, clay minerals, ceramics and oxides.2,7–10Carbon nanomaterials, such as CNTs and graphene, possessing high specific surface area and abundant adsorption sites, have been considered as a class of newly emerging and highly efficient adsorbents.11 However, low dispersity and strong hydrophobicity arising from their strong Van de Waals force and unique molecular structure have become crucial to restrict the practical applications of carbon nanomaterials to a certain degree. An alternative method to improve the dispersity and hydrophilicity of carbon nanomaterials is to combine with other materials to achieve carbon nanomaterial-contained composites.12 As a result, the removal efficiency of the carbon nanomaterials serving as adsorbents was found to be greatly improved.13,14 For example, Ca/Al layered double hydroxide decorated CNTs composites fabricated from CNTs and Ca/Al-containing precursor solution via co-precipitation and hydrothermal aged treatment possessed a favorable adsorption capability towards U(VI), which was 4-fold that of pristine CNTs.15 Similarly, the adsorption ability of graphene oxide towards Cd(II) and Ni(II) was found to be greatly improved as it was incorporated with almond shell (graphene oxide/almond shell composite) by a freeze-drying method.16
However, it is worth noting that a complex assembly or synthesis process is generally needed for the preparation of desirable carbon nanomaterials-contained composites, which hence brought a large amount of wastage and cost as well as extra wastes. Interestingly, various carbon nanomaterials-contained composites being considered as by-products or industrial wastes are inevitably and largely being produced in daily industrial production, such as catalytic pyrolysis or reforming-involved industries.17,18 The used catalysts in these industries are generally deactivated and poisoned by the damage of structure or the production of coke, which are difficult to recover and conduct to further reuse. Further analysis revealed that the coke that existed on the used catalysts is mainly composed of amorphous carbons and ordered structure carbons (carbon nanomaterials).19 The carbons are uniformly covered or nested on the catalyst surface or its inner pore structure. Also, abundant oxygen-containing functional groups can be found in the carbons in the catalytic conversion of oxygen-contained feedstock, which endowed their favorable hydrophilicity and excellent adsorption sites.13,20 Therefore, the used catalysts can be sustainably disposed of as a low cost source of carbon nanomaterials-contained composites, employing as an efficient adsorbent for the removal of pollutants from environment.
Herein, the purpose of the present work is to investigate the feasibility and performance for the employment of the carbon nanomaterials-contained composites originated from used catalysts as adsorbents on pollutants removal. Three types of used catalysts derived from catalytic reforming of the vapor of LG, PE and their mixture were comparably investigated to determine the influence of the type of carbon nanomaterials and corresponding surface chemistry, which were characterized by SEM, XRD, TEM, TG and FTIR. The adsorption capability of these three types of used catalysts towards Pb(II) from aqueous solution varied from adsorption conditions, such as initial Pb(II) concentration, contact time, solution pH and ambient temperature were further investigated. Adsorption isotherm, kinetic, thermodynamics and potential adsorption mechanism were analyzed and discussed as well.
2 Materials and methods
2.1 Raw materials and chemicals
LG was extracted from a black liquor collected from an alkali pulping mill in Hunan Province, China, according to an acid precipitate method which has been exhaustively described in our previous study.21 Commercially available PE powder with an average Mw of ∼4000 and Mn of ∼1700 GPC was provided by Sigma–Aldrich Corporation (St. Louis, MO, USA). Chemicals including nickel nitrate hexahydrate, aluminium oxide (Al2O3), nitric acid, sodium hydroxide, lead nitrate and EDTA in analytical reagent grade were obtained from Sigma-Aldrich Corporation (St. Louis, MO, USA). Deionized water with a resistivity of 18.2 MΩ cm−1 was employed as a solvent to prepare the desired solution.2.2 Preparation of carbon materials/Al2O3 composites
![[thin space (1/6-em)]](https://www.rsc.org/images/entities/char_2009.gif) :
:![[thin space (1/6-em)]](https://www.rsc.org/images/entities/char_2009.gif) 1) was carried out at a vertical two-stage fixed bed where nitrogen was introduced to maintain an inert atmosphere (Fig. S1†). The feedstock was pyrolyzed at the first stage with a heating rate of 10 °C min−1 at 800 °C for 2 h. The produced vapour was passed through the catalyst bed placed in the second stage where the temperature was controlled as 600 °C. Particularly, the first stage was commenced to heat after the catalyst bed reached the set temperature. Once the pyrolysis at the first stage finished, the two stages were simultaneously ceased. Then the instrument was allowed to cool down naturally to room temperature. The reacted catalyst carpeting with carbon materials (carbon materials Ni/Al2O3) was collected. Particularly, the carbon materials Ni/Al2O3 composites originated from PE, LG and their mixture were labelled as PE-CNTs-Ni/Al2O3, LG-Chars-Ni/Al2O3 and PE/LG-CNTs-Ni/Al2O3, respectively.
1) was carried out at a vertical two-stage fixed bed where nitrogen was introduced to maintain an inert atmosphere (Fig. S1†). The feedstock was pyrolyzed at the first stage with a heating rate of 10 °C min−1 at 800 °C for 2 h. The produced vapour was passed through the catalyst bed placed in the second stage where the temperature was controlled as 600 °C. Particularly, the first stage was commenced to heat after the catalyst bed reached the set temperature. Once the pyrolysis at the first stage finished, the two stages were simultaneously ceased. Then the instrument was allowed to cool down naturally to room temperature. The reacted catalyst carpeting with carbon materials (carbon materials Ni/Al2O3) was collected. Particularly, the carbon materials Ni/Al2O3 composites originated from PE, LG and their mixture were labelled as PE-CNTs-Ni/Al2O3, LG-Chars-Ni/Al2O3 and PE/LG-CNTs-Ni/Al2O3, respectively.2.3 Characterization of as-synthesized carbon materials/Al2O3 composites
The crystalline information of carbon products and corresponding catalyst components in samples (the as-synthesized fresh Ni/Al2O3 catalysts with different Ni content and carbon materials-Ni/Al2O3 composites) was determined by a powder X-ray diffractometer with Cu Kα radiation in the 2θ range 5–80° (Empyrean series 2, PANalytical, Netherlands). The reduction behaviors of the fresh catalysts were detected by a Temperature Programmed Reduction instrument (TPR) (FineSorb3010, FINETEC instrument, China). Morphologic features of the samples were characterized using scanning electron microscopy (SU1510, Hitachi, Japan). Transmission electron microscope (JEM-2010F, JOEL, Janpan) equipped with a high-resolution transmission electron microscopy (talos F200, FEI, USA) was employed to investigate the detailed morphology of the samples. Thermogravimetric analysis was conducted to determine the thermal stability of samples in the air using a thermo-gravimetric analyzer (SDT Q600, TA instrument, USA) in the temperature range of 30–850 °C with a heating rate of 10 °C min−1. Surface functional groups of the samples were analyzed by a Fourier Transform Infrared Spectrometer (Nicolet iS5, Thermo Fisher Scientific, USA). The vibration of the transmissions and corresponding wavenumbers ranging from 600 to 4000 cm−1 were collected with a resolution of 4 cm−1. Ash, volatile matter and fixed carbon of the samples were measured according to the standard method (ASTM D 1762-84). The analysis on the composition of carbon (C), hydrogen (H) and sulphur (S) in samples was carried out on an Elemental Analyzer (EA112, Thermo Finnigan, USA). While the oxygen content (O) was calculated by difference. The specific surface area of samples was determined by N2 adsorption/desorption at 77 K on a surface area analyzer (NOVA-2000E, Quantachrome Instruments, USA) according to the Brunauer–Emmett–Teller (BET) method. The point of zero charge (pHpzc) of samples was measured based on the method in our previous study.72.4 Adsorption of Pb(II) onto carbon materials/Al2O3 composites
Stock solution of Pb(II) in a concentration of 1000 mg L−1 was prepared by dissolving lead nitrate in deionized water. Pb(II)-containing solutions in required initial concentrations were subsequently prepared by diluting the calculated amount of the stock solution to 50 mL using deionized water in 100 mL conical flasks. About 0.05 mg sample (PE-CNTs-Ni/Al2O3, LG-Chars-Ni/Al2O3 or PE/LG-CNTs-Ni/Al2O3) was added to the flasks and shook at a horizontal air bath shaker under 25 °C for 8 h with a constant rate of 120 r/min. Afterwards, the suspensions were filtered with 0.22 μm filters and the separated filtrates were analysed by an atomic adsorption spectrometer (AAS) (FAAS-M6, Thermo, USA) to determine the remnant Pb(II) concentration. The effect of initial concentrations (ranging from 20 to 400 mg L−1), contact time (ranging from 0–8 h), ambient temperature (ranging from 15–45 °C) and solution pH (ranging from 2 to 6) on the adsorption of Pb(II) on samples were extensively investigated. Particularly, the pH of Pb(II) solution was accurately controlled with diluted HNO3 or NaOH.For the investigation of reusability, 0.05 g of Pb(II)-loaded PE/LG-CNTs-Ni/Al2O3 composites were mixed with 10 mL of 0.1 mol L−1 EDTA solution and then ultrasonicated at 25 °C for 10 min to desorb. The suspension was filtered. The Pb(II) concentration in filtrate was determined and the filter residue was dried and employed for the renewed adsorption. Five repeated adsorption–regeneration cycles were performed.
3 Results and discussion
3.1 Characteristics of carbon materials-Ni/Al2O3 composites
The SEM images of carbon materials-Ni/Al2O3 composites are shown in Fig. 1. Preliminary observations under low magnification reveal that Ni/Al2O3 derived from catalytic reforming PE and LG/PE mixture is covered with dense carbon materials (Fig. 1a and c). Further study demonstrates that PE-derived carbon materials show long and entangled fibre-like structures (15–30 μm in length and 5–50 nm in diameter) while stubby and interconnected ones can be found from PE/LG mixture-derived carbon materials (0.1–1 μm in length and 10–100 nm in diameter) in term the result of Fig. 1b and d. It is reported that filamentous carbon materials were found to be the most important and ubiquitous carbon materials during catalytic reforming plastics and their mixture together with biomass.22,23 For catalytic reforming LG, bulk spine-like structured carbon is obtained, which is evidently different from those from PE and LG/PE mixture. This result is also different from that of Wu, et al., where pyrolysis/gasification of lignin over Ni–Ca–Al catalyst was investigated and filamentous carbon was produced.24 Meanwhile, no evident carbon products can be found during the catalytic steam gasification of lignin over CaO.25 This may be highly associated with the catalyst employed and operating conditions conducted.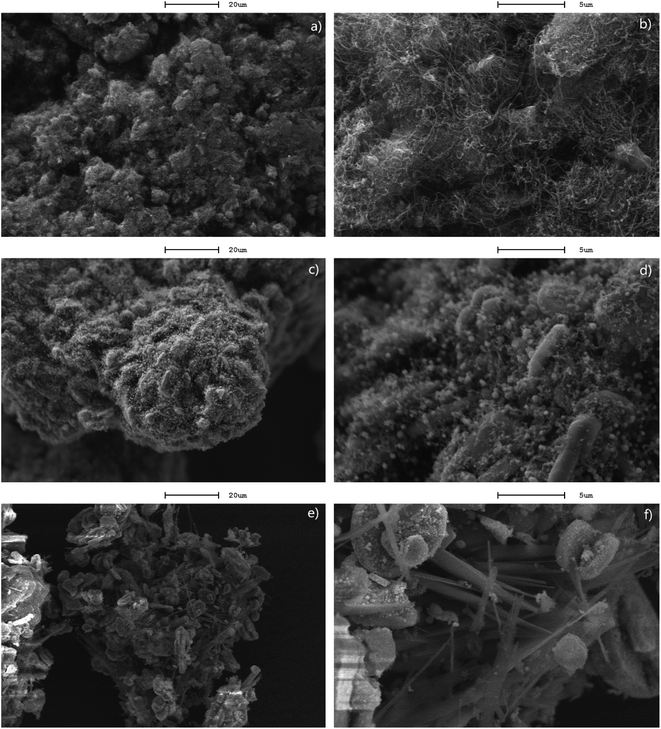 | ||
| Fig. 1 SEM images of carbon materials-Ni/Al2O3 composites derived from different carbon sources using Ni/Al2O3 as catalyst, (a and b) PE; (c and d) PE/LG mixture; (e and f) LG. | ||
Fig. 2 shows TEM images of the carbon materials-Ni/Al2O3 composites. It can be found that filamentous carbon derived from PE possessed a clearly tubular structure and relatively smooth surface, which is assigned to well-ordered CNTs (PE-CNTs-Ni/Al2O3). The diameter of the CNTs is in the range of 10–100 nm and the length is over 10 μm. This is well coincided with the SEM result (Fig. 1a and b). However, in addition to a small amount of well-ordered CNTs in a tubular structure, the filamentous carbon from PE/LG mixture appears to be mainly made up of highly curved cone-shape CNTs (PE/LG-CNTs-Ni/Al2O3) (Fig. 2c and d). The diameter and length of the curved cone-shape CNTs are in the range of about 10–100 nm and about 0.1–1 μm, respectively, which is consistent with the SEM result in Fig. 1c and d. Compared to the well-ordered CNTs from catalytic reforming of PE, the highly curved cone-shape CNTs from PE/LG mixture may reveal that the involvement of LG results in the occurrence of abundant structure defects. Moreover, the CNTs in PE-CNTs-Ni/Al2O3 with hollow tip can be easily seen in Fig. 2a and b further shows that the top end of the CNTs encapsulates a metallic particle in a diameter of 12 nm, indicating that the growth of the CNTs from catalytic reforming PE follows the tip-growth model.26 Similar growth model may be responsible for the growth of curved cone-shape CNTs from catalytic reforming the mixture of PE and LG according to the TEM results in Fig. 2c and d due to hollow tip and encapsulated metal particle can be found as well. Fig. 2e and f reveals that the carbon materials derived from catalytic reforming LG (LG-Chars-Ni/Al2O3) are mainly composed of amorphous carbon.
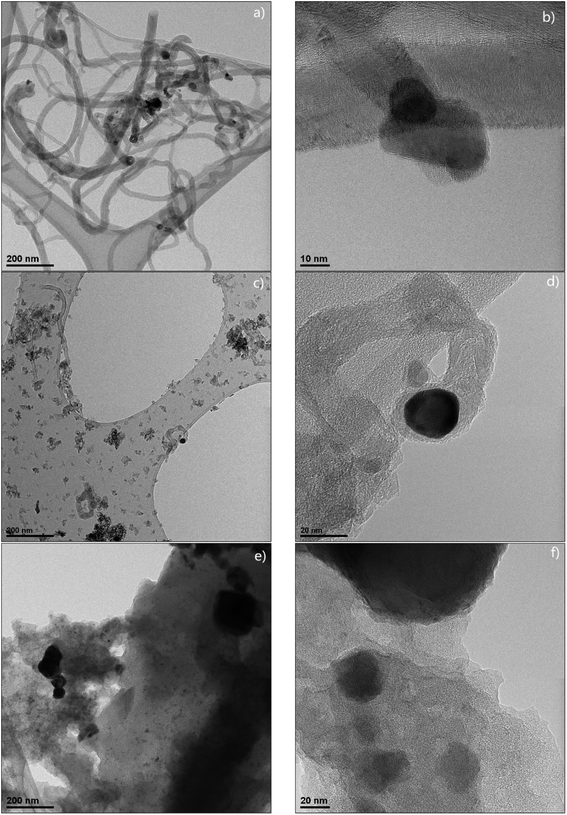 | ||
| Fig. 2 TEM images of carbon materials-Ni/Al2O3 derived from different carbon sources, (a and b) PE; (c and d) PE/LG; (e and f) LG. | ||
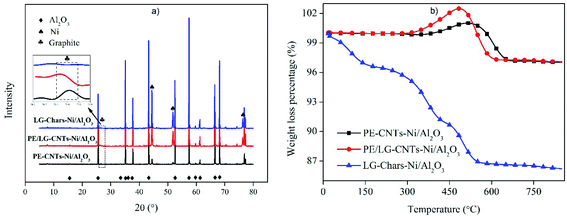
XRD patterns of carbon materials-Ni/Al2O3 composites are presented in Fig. 3a. In addition to several pronounced characteristic peaks of Al2O3 and Ni, a small diffraction peak at 2θ = 26.5° in PE-CNTs-Ni/Al2O3 and PE/LG-CNTs-Ni/Al2O3 corresponding to the plane (002) of graphite like structure also can be observed, whereas the peak can not be found in LG-Chars-Ni/Al2O3.27 This result reveals that the carbon materials from PE and PE/LG mixture contain a large amount of relatively well-ordered carbon in graphitic nature, while amorphous carbon is mainly responsible for the carbon material from LG, which is well in agreement with the SEM and TEM results. Fig. 3b shows TG curves of carbon materials-Ni/Al2O3 composites under air atmosphere from ambient temperature to 850 °C. It can be seen that PE-CNTs-Ni/Al2O3 exhibits good thermal stability before 355 °C with negligible weight loss. After that, PE-CNTs-Ni/Al2O3 undergoes a weight increase stage taking place at 355–516 °C, followed by a weight loss stage in the range of 516–682 °C. The weight increase stage can be attributed to the oxidation of Ni particle (from Ni to NiO) in PE-CNTs-Ni/Al2O3, which is originated from the reduction of catalyst precursor (NiO) by the pyrolysis intermediates of PE, such as ethylene. While the weight loss stage is related to the oxidation of CNTs. Similarly, the weight change of LG/PE-CNTs-Ni/Al2O3 exhibits a similar trend with that of PE-CNTs-Ni/Al2O3. The main difference lies in the initial temperatures of the weight increase and weight decrease of PE/LG-CNTs-Ni/Al2O3, which is 291 and 482 °C, respectively, both lowering than those of PE-CNTs-Ni/Al2O3. According to the TEM analysis, this result may result from the presence of abundant structure defects in PE/LG-CNTs-Ni/Al2O3. For LG-Chars-Ni/Al2O3, a successive weight loss stage can be seen at the whole temperature range, which indicates that the content of chars (amorphous carbon) in LG-Chars-Ni/Al2O3 is relatively high and the chars possess a relatively low thermal stability. Furthermore, the high solid residue ranging from 85.2% to 97.4% for the three composites is mainly assigned to the presence of the mixture of Al2O3 and NiO (see Table 1).
| PE-CNTs-Ni/Al2O3 | PE/LG-CNTs-Ni/Al2O3 | LG-Chars-Ni/Al2O3 | |
|---|---|---|---|
| a The mass remaining after TPO analysis. | |||
| Yield | 4.71 | 6.98 | 18.42 |
![[thin space (1/6-em)]](https://www.rsc.org/images/entities/char_2009.gif) |
|||
| Proximate analysis | |||
| Fixed carbon (%) | 4.1 | 4.8 | 7.6 |
| Volatile matter (%) | 0.1 | 0.8 | 7.3 |
| Ash (%) | 95.8 | 94.4 | 85.1 |
![[thin space (1/6-em)]](https://www.rsc.org/images/entities/char_2009.gif) |
|||
| Ultimate analysis | |||
| C (%) | 4.34 | 4.84 | 6.53 |
| H (%) | 0.01 | 0.18 | 0.45 |
| O (%) | — | 0.68 | 1.85 |
| S (%) | — | 0.06 | 0.28 |
![[thin space (1/6-em)]](https://www.rsc.org/images/entities/char_2009.gif) |
|||
| Other properties | |||
| SSA (m2 g−1) | 48.87 | 52.13 | 2.61 |
| TPV (cm3 g−1) | 0.15 | 0.16 | 0.02 |
| APD (nm) | 10.8 | 13.5 | 1.6 |
| Solid residea | 97.3% | 97.4% | 85.2% |
| pHpzc | 8.16 | 5.42 | 5.28 |
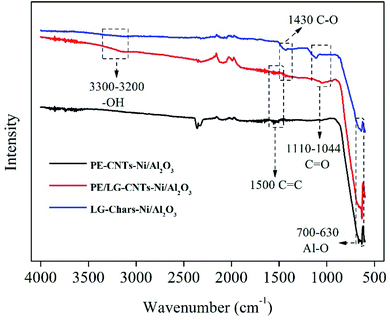
The surface functional groups of carbon materials-Ni/Al2O3 composites were analyzed by FT-IR, and the results are presented in Fig. 4. The strong adsorption bands between 630 and 700 cm−1 correspond to the stretching vibration of Al–O bond originating from catalyst substrate (Al2O3), which can be evidently found in all carbon materials-Ni/Al2O3 composites.28 O-containing surface functional groups, such as C![[double bond, length as m-dash]](https://www.rsc.org/images/entities/char_e001.gif) O occurring at the adsorption bands at the range of 1044–1110 cm−1, C–O observing at the adsorption band at 1430 cm−1, and –OH presenting at the adsorption bands between 3200–3300 cm−1, can be only found in PE/LG-CNTs-Ni/Al2O3 and LG-Chars-Ni/Al2O3 thanks to the presence of a large amount of O content in LG.29 On the other hand, the band at 1500 cm−1 attributing to aromatic C
O occurring at the adsorption bands at the range of 1044–1110 cm−1, C–O observing at the adsorption band at 1430 cm−1, and –OH presenting at the adsorption bands between 3200–3300 cm−1, can be only found in PE/LG-CNTs-Ni/Al2O3 and LG-Chars-Ni/Al2O3 thanks to the presence of a large amount of O content in LG.29 On the other hand, the band at 1500 cm−1 attributing to aromatic C![[double bond, length as m-dash]](https://www.rsc.org/images/entities/char_e001.gif) C are only seen in PE-CNTs-Ni/Al2O3 and PE/LG-CNTs-Ni/Al2O3, which may be related to the graphitic structure in CNTs.
C are only seen in PE-CNTs-Ni/Al2O3 and PE/LG-CNTs-Ni/Al2O3, which may be related to the graphitic structure in CNTs.
Physicochemical characteristics of carbon materials-Ni/Al2O3 composites are shown in Table 1. The carbon yield of the three types of composites follows an order of PE-CNTs-Ni/Al2O3 < PE/LG-CNTs-Ni/Al2O3 < LG-Chars-Ni/Al2O3, which is well coincided with the TG result in Fig. 3b. The proximate analysis reveals that fixed carbon is the main content in PE-CNTs-Ni/Al2O3 and PE/LG-CNTs-Ni/Al2O3 while the volatile matter (7.3%) in LG-Chars-Ni/Al2O3 is nearly equivalent to that of the fixed carbon (7.8%) except for ash content. The higher content of volatile matter in LG-Chars-Ni/Al2O3 highly relates to its inner amorphous carbon structure, leading to lower thermal stability.30 PE-CNTs-Ni/Al2O3 is mainly composed of C and H according to ultimate analysis. For PE/LG-CNTs-Ni/Al2O3 and LG-Chars-Ni/Al2O3, a certain amount of O and S can be detected besides C and H. The presence of O content may be highly related to the O-containing surface functional groups in PE/LG-CNTs-Ni/Al2O3 and LG-Chars-Ni/Al2O3 as shown in Fig. 4. PE-CNTs-Ni/Al2O3 and PE/LG-CNTs-Ni/Al2O3 is similar in pore characteristics involving surface area (48.87–52.12 m2 g−1), total pore volume (0.15–0.16 cm3 g−1) and average pore diameter (10.8–13.5 nm). By comparison, LG-Chars-Ni/Al2O3 possesses relatively inferior surface area (2.61 m2 g−1) and total pore volume (0.02 cm3 g−1). It is reported that the relatively higher O content in biomass (25–45%) causes the extensive polycondensation of the intermediates during pyrolysis, which is not beneficial to produce porous material.29 The pHpzc of PE-CNTs-Ni/Al2O3 is 8.16 while that of PE/LG-CNTs-Ni/Al2O3 decreases to 5.42 due to the introduction of LG, which brings into a large amount of O-containing surface functional groups.31
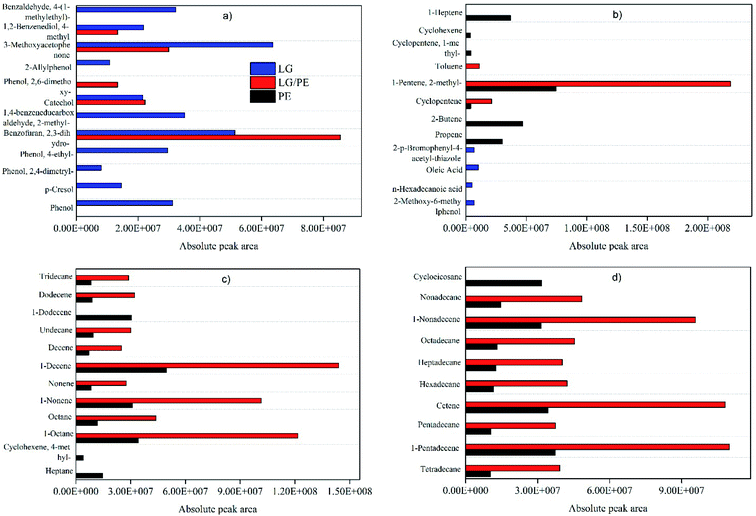
In order to understand the growth mechanism of the carbon materials prepared from different carbonaceous precursors (i.e., PE, LG and their mixture), the volatile components of the carbonaceous precursors are determined using Py-GC/MS and the corresponding analysis is shown in Fig. 5. It can be found that the volatiles of PE mainly consists of a large amount of alkanes (i.g., heptane, octane, nonane, tetradecane, pentadecane, hexadecane, heptadecane, octadecane) and alkenes (i.g., propylene, butene, cyclopentene, heptene, nonadecene, decene, pentadecane, cetene), as well as a small amount of aromatic hydrocarbons, which is well in agreement with previous study.32 By comparison, oxygenated compounds including phenols (i.g., phenol, cresol, catechol), aromatic aldehydes (i.g., benzaldehyde), aromatic alcohols (i.g., benzenediol) and aromatic ketones (i.g., methoxyacetophenone) are the main components of the volatiles of LG. Jin et al. obtained similar results as black liquor-derived LG were carried out to pyrolyze.33 Interestingly, the types of hydrocarbons and oxygenated compounds in the volatiles obtained from the pyrolysis of PE together with LG are evidently reduced in comparison with the pyrolysis products from PE alone and LG alone. Moreover, a certain amount of newly produced substances, such as toluene, can be found, which can be attributed to the interaction between the pyrolysis intermediates of PE and LG, such as hydrodeoxygenation and anti polycondensation.33
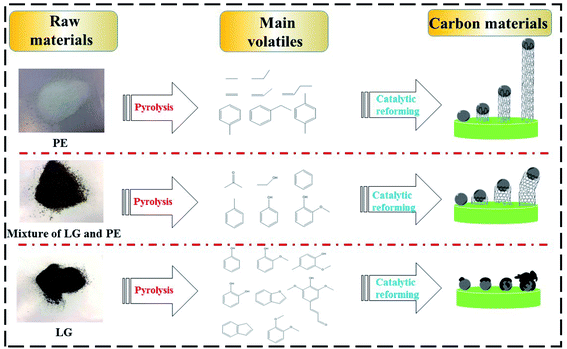
Alkanes, alkenes and aromatic hydrocarbons are considered the superior carbonaceous feedstocks for the preparation of carbon nanomaterials such as CNTs, carbon nanofibres, and graphene via catalytic reforming.34 While the catalytic reforming of phenols, aromatic aldehydes, aromatic alcohols and aromatic ketones only can produce amorphous carbon due to their complex structure and high oxygen content.35 Accordingly, well-ordered CNTs can be obtained from the catalytic reforming of the pyrolysis products from PE while amorphous carbon is the main component of the solid carbon product from LG. This has been well confirmed by TEM, XRD and TG results. The volatiles from the co-pyrolysis of PE and LG are mixtures mainly consisting of hydrocarbons and oxygenated compounds. It is reported that oxygenated compounds, such as phenol like compounds, can be employed to produce CNTs with abundant defects and O-containing surface functional groups in the presence of reductant (H2 or hydrocarbons).36 This may be the main reason for the curved cone-shape CNTs produced from the catalytic reforming of PE/LG, which is well coincided with the TEM and FT-IR results. According to the results of SEM, TEM, XRD, TG and FTIR, possible mechanisms of the growth of carbon materials over the Ni/Al2O3 catalysts varying from the raw materials are proposed (see Scheme 1).
3.2 Adsorption capability towards Pb(II)
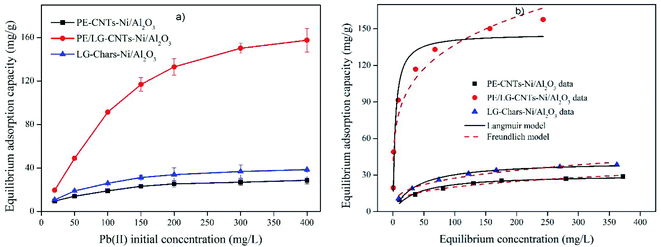
In order to clarify the relationship between the Pb(II) concentration adsorbed on composite surface and remained in solution at adsorption equilibrium, two typical adsorption isotherm models, i.e., Langmuir model (eqn (1)) and Freundlich model (eqn (2)) are employed to fit the adsorption processes. Langmuir model is applicable on the assumption of monolayer adsorption of adsorbate molecular onto a homogeneous adsorbent surface with no interactions between the adsorbed molecules. Freundlich model assumes that the adsorption enthalpy on the sorbent surface is heterogeneously distributed and increased with a surface coverage of adsorbent.
 | (1) |
| qe = KfCen | (2) |
The fitting results for Pb(II) adsorption using Langmuir and Freundlich models are shown in Fig. 6b and Table 2. It is found that the R2 values of PE-CNTs-Ni/Al2O3, PE/LG-CNTs-CNTs-Ni/Al2O3 and LG-Chars-Ni/Al2O3 composites from Langmuir model are 0.97, 0.96 and 0.99, respectively, which are slight higher than those from Freundlich model (0.94–0.95), indicating that the adsorption processes could be well described by Langmuir model and the adoption of Pb(II) onto the three composites is subjected to a homogeneous monolayer adsorption. Similar results have been reported when carbon nanotubes/CoFe2O4 magnetic hybrid material was employed as adsorbents to remove Pb(II).38 The theoretical maximum adsorption capacity of Pb(II) (Qm) calculated from Langmuir model are 30.47, 146.08 and 41.44 mg g−1 for PE-CNTs-Ni/Al2O3, PE/LG-CNTs-Ni/Al2O3 and LG-Chars-Ni/Al2O3 composites, respectively. PE/LG-CNTs-Ni/Al2O3 composite shows the highest Qm value among the three composites employed, which is about 4.8 and 3.5 folds to those of PE-CNTs-Ni/Al2O3 and LG-Chars-Ni/Al2O3 composites, respectively, revealing that PE/LG-CNTs-Ni/Al2O3 composite has a superior adsorption capability to Pb(II). Moreover, the Qm of PE/LG-CNTs-Ni/Al2O3 composite is much higher than most of the adsorption in previous reports as shown in Table S3.† For example, the adsorbed Pb(II) on PE/LG-CNTs-Ni/Al2O3 composite is about 3 folds higher than those of CNTs/bagasse composite (56.6 mg g−1) and CNTs@zeolite composite (55.74 mg g−1).39,40 On the other hand, Kl, the Langmuir bonding term related to interaction energies, can be employed to analyze the bonding strength between adsorbate molecular and the adsorption sites of adsorbent. According to the results in Table 2, the Kl values of the three composites are subject to an order of PE-CNTs-Ni/Al2O3 (0.02 L g−1) < LG-Chars-Ni/Al2O3 (0.03 L g−1) < PE/LG-CNTs-Ni/Al2O3 (0.26 L g−1), which is consistent with the trend of Qm. This suggests that among the three composites, PE/LG-CNTs-Ni/Al2O3 possesses not only the highest Qm value but also the strongest bonding strength towards Pb(II).
| PE-CNTs-Ni/Al2O3 | PE/LG-CNTs-Ni/Al2O3 | LG-Chars-Ni/Al2O3 | |
|---|---|---|---|
| Langmuir | |||
| Qm (mg g−1) | 30.47 | 146.08 | 41.44 |
| Kl (L mg−1) | 0.02 | 0.26 | 0.03 |
| R2 | 0.97 | 0.96 | 0.99 |
![[thin space (1/6-em)]](https://www.rsc.org/images/entities/char_2009.gif) |
|||
| Freundlich | |||
| Kf (mg(1−n) Ln g−1) | 5.15 | 48.67 | 6.73 |
| n | 3.37 | 4.45 | 3.28 |
| R2 | 0.95 | 0.94 | 0.94 |
The affinities between Pb(II) and composite can be further predicted by Kl using a dimensionless separation factor RL according to the following equation (eqn (3)):
 | (3) |
It is reported that RL > 1, RL = 1, 1 > RL >0 and RL = 0 indicates the isotherm to be unfavorable, linear, favorable and irreversible, respectively.41 The calculated values of PE-CNTs-Ni/Al2O3, PE/LG-CNTs-CNTs-Ni/Al2O3 and LG-Chars-Ni/Al2O3 composites are 0.11–0.71, 0.01–0.16 and 0.08–0.63, respectively, suggesting that the adsorption of Pb(II) onto the three composites are favorable.
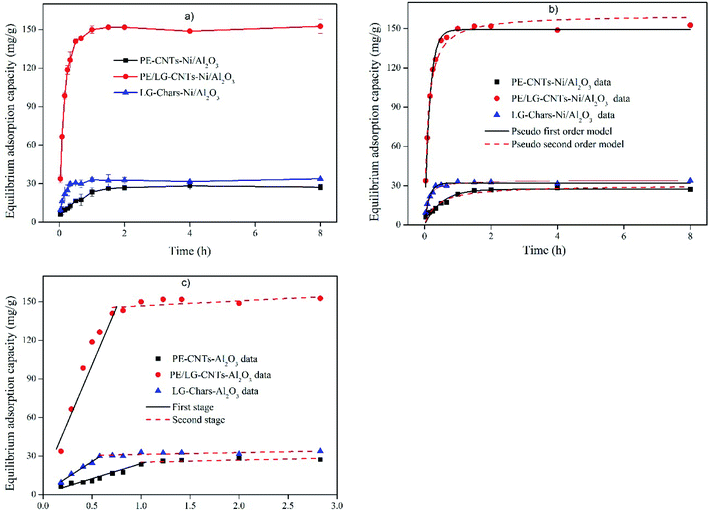
The interaction between Pb(II) and the surface adsorption sites of composites with contact time can be investigated by adsorption kinetics models. Two widely accepted kinetics models, i.e., Pseudo-first-order (eqn (4)) and Pseudo-second-order (eqn (5)) models, are conducted to simulate the adsorption. Pseudo-first-order model considers the adsorption to a reversible reaction, while Pseudo-second-order model is associated with a chemisorption process.
 | (4) |
 | (5) |
The kinetics fitting results are exhibited in Fig. 7b and the obtaining fitting parameters are shown in Table 3. Pseudo-second-order model can well describe the adsorption of Pb(II) using the three composites with R2 values in the range of 0.94–0.99, which are higher than those of Pseudo-first-order model (0.92–0.95). Moreover, the calculated equilibrium adsorption capacity (qe) from Pseudo-second-order model are 28.35, 153.64 and 34.34 mg g−1 for PE-CNTs-Ni/Al2O3, PE/LG-CNTs-Ni/Al2O3 and LG-Chars-Ni/Al2O3 composites, respectively, which are much close to their experimental values (Qexp). It is therefore demonstrated that Pseudo-second-order model is an ideal model to simulate the adsorption of Pb(II) using the three composites. Pseudo-second-order model is also found to be the best kinetic model to simulate the adsorption of Pb(II) using carbon nanotubes/CoFe2O4 magnetic hybrid material as reported in the study from Zhou et al.38 Moreover, the adsorption well following Pseudo-second-order model reveals that the adsorption of Pb(II) using the three composites are mainly dominated by a series of chemical reactions.
| PE-CNTs-Ni/Al2O3 | PE/LG-CNTs-Ni/Al2O3 | LG-Chars-Ni/Al2O3 | |
|---|---|---|---|
| a Slope.b Intercept. | |||
| Qexp (mg g−1) | 28.25 | 152.60 | 34.80 |
![[thin space (1/6-em)]](https://www.rsc.org/images/entities/char_2009.gif) |
|||
| Pseudo-first-order model | |||
| K1 (h−1) | 1.98 | 6.46 | 7.36 |
| qe (mg g−1) | 27.31 | 143.24 | 32.06 |
| R2 | 0.92 | 0.95 | 0.94 |
![[thin space (1/6-em)]](https://www.rsc.org/images/entities/char_2009.gif) |
|||
| Pseudo-second-order model | |||
| K2 (g mg h−1) | 0.09 | 0.06 | 0.34 |
| qe (mg g−1) | 28.35 | 153.64 | 34.34 |
| R2 | 0.94 | 0.99 | 0.98 |
![[thin space (1/6-em)]](https://www.rsc.org/images/entities/char_2009.gif) |
|||
| Weber-Morris model | |||
| First stage | |||
| a1a | 13.14 | 268.45 | 49.34 |
| b1b | 4.26 | −13.26 | 1.10 |
| R2 | 0.90 | 0.99 | 0.99 |
![[thin space (1/6-em)]](https://www.rsc.org/images/entities/char_2009.gif) |
|||
| Second stage | |||
| a2 | 22.02 | 61.98 | 6.74 |
| b2 | 0.08 | 91.19 | 25.60 |
| R2 | 0.97 | 0.92 | 0.90 |
![[thin space (1/6-em)]](https://www.rsc.org/images/entities/char_2009.gif) |
|||
| Third stage | |||
| a3 | 0.63 | 0.58 | 0.36 |
| b3 | 25.97 | 150.02 | 32.13 |
| R2 | 0.91 | 0.91 | 0.91 |
Weber–Morris model analysis is usually carried out to interpret the mass transfer and intraparticle diffusion mechanism between the adsorbate and the adsorbent during adsorption process, which can be expressed by the following equation (eqn (6)).
| qt = a × t0.5 + b | (6) |
The relationship between the adsorption capacity of Pb(II) at contact time t (qt) and the square root of corresponding contact time is plotted in Fig. 7c and the obtained parameters is presented in Table 3. As shown, the adsorption of Pb(II) using the three composites can be well divided into three linear lines with different slopes (R2 = 0.90–0.99). It is well-established that the first linear stage is assigned to the mass transfer of Pb(II) from the bulk solution to the surface of composite, while the second and third stages are attributed to intraparticle diffusion of Pb(II) into the porous interior structure of composite. It is found that the slopes of the first linear stage from the three composites are 13.14–268.45 which are steeper than those of the second and third stages (0.36–61.98) (except for PE-CNTs-Ni/Al2O3). This observation indicates that the mass transfer of Pb(II) from the bulk solution to the surface of the composite is much fast and fierce, while the intraparticle diffusion is relatively slow and not the rate-limiting process for the adsorption.
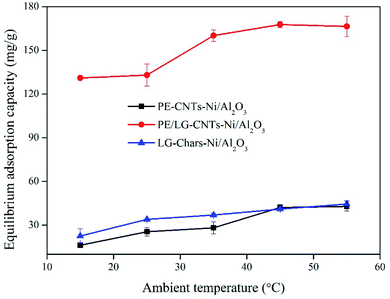 | ||
| Fig. 8 Effect of ambient temperature on the adsorption of Pb(II) on PE-CNTs-Ni/Al2O3, PE/LG-CNTs-Ni/Al2O3 and LG-Chars-Ni/Al2O3 composites. | ||
The thermodynamic parameters, involving Gibbs free energy (ΔG0), enthalpy (ΔH0) and entropy (ΔS0), are generally employed to reveal the deep relationship between the ambient temperature and the adsorption of Pb(II), which can be obtained from a series of equations (eqn (7)–(9)). ΔG0 represents an indication of the spontaneity of a chemical reaction. Particularly, ΔG0 in a negative value reveals a spontaneous reaction, while an unspontaneous reaction would lead to a positive value of ΔG0. ΔH0 and ΔS0 are associated with the energy change of system and the randomness state of the adsorption, respectively.
ΔG0 = RT![[thin space (1/6-em)]](https://www.rsc.org/images/entities/char_2009.gif) ln ln![[thin space (1/6-em)]](https://www.rsc.org/images/entities/char_2009.gif) Ke Ke
| (7) |
 | (8) |
 | (9) |
The calculated thermodynamic parameters of the adsorption of Pb(II) on PE-CNTs-Ni/Al2O3, PE/LG-CNTs-Ni/Al2O3 and LG-Chars-Ni/Al2O3 composites are presented in Table 4. It can be found that the values of ΔG0 obtained from the adsorption of Pb(II) using the three composites under various temperatures are negative (−6.94∼−18.82 kJ mol−1), revealing that the adsorption can proceed spontaneously. The absolute values of ΔG0 for each composite shows a positive relationship with the ambient temperature, which indicates that the increase in ambient temperature is favorable for the adsorption. The ΔH0 values of PE-CNTs-Ni/Al2O3, PE/LG-CNTs-Ni/Al2O3 and LG-Chars-Ni/Al2O3 composites for Pb(II) adsorption are 22.61, 22.30 and 14.78 kJ mol−1, respectively, indicating that the adsorption are subjected to be endothermic. In other words, an increase in ambient temperature are beneficial to the adsorption of Pb(II) using the composites. This well coincides with the result in Fig. 8. Moreover, the positive values of ΔS0 suggests a fierce randomness state between the interface of composite and Pb(II) solution during Pb(II) adsorption.
| ΔG0 (kJ mol−1) | ΔH0 (kJ mol−1) | ΔS0 (J (mol−1 K−1)) | |||||
|---|---|---|---|---|---|---|---|
| 288 (K) | 298 (K) | 308 (K) | 318 (K) | 328 (K) | |||
| PE-CNTs-Ni/Al2O3 | −6.94 | −8.45 | −9.01 | −10.58 | −10.98 | 22.61 | 100.93 |
| PE/LG-CNTs-Ni/Al2O3 | −14.27 | −14.87 | −17.14 | −18.36 | −18.82 | 22.30 | 126.62 |
| LG-Chars-Ni/Al2O3 | −7.80 | −9.26 | −9.84 | −10.50 | −11.11 | 14.78 | 79.50 |
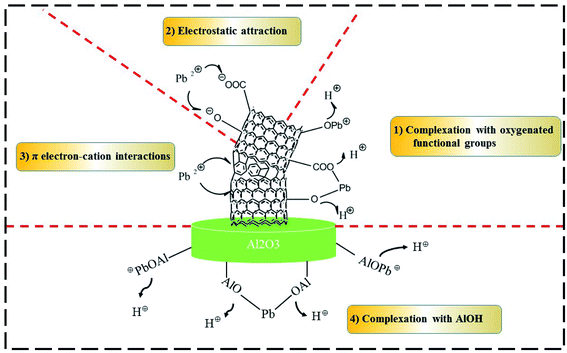
![[double bond, length as m-dash]](https://www.rsc.org/images/entities/char_e001.gif) O, C–O, C–O–C, –OH, possess a strong affinity to Pb(II) and can greatly facilitate the adsorption of Pb(II) on carbon materials via complexation based on eqn (10)–(12).43 A quantitative calculation on the adsorption of Pb(II) using peanut shell-based carbon material shows that 11.4% of the adsorbed Pb(II) can be attributed to the O-containing surface functional groups.44 According to FT-IR analysis in Fig. 4, PE/LG-CNTs-Ni/Al2O3 composite has a large amount of C
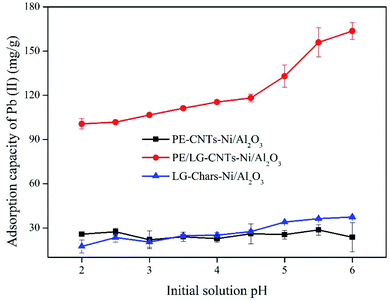
O, C–O, C–O–C, –OH, possess a strong affinity to Pb(II) and can greatly facilitate the adsorption of Pb(II) on carbon materials via complexation based on eqn (10)–(12).43 A quantitative calculation on the adsorption of Pb(II) using peanut shell-based carbon material shows that 11.4% of the adsorbed Pb(II) can be attributed to the O-containing surface functional groups.44 According to FT-IR analysis in Fig. 4, PE/LG-CNTs-Ni/Al2O3 composite has a large amount of C![[double bond, length as m-dash]](https://www.rsc.org/images/entities/char_e001.gif) O, C–O, –OH, suggesting that the complexation between Pb(II) and O-containing surface functional groups may make contributions to the adsorption of Pb(II). (2) Electrostatic attraction. The pHpzc value of PE/LG-CNTs-Ni/Al2O3 composite is 5.42 as shown in Table 1. According to the characteristics of pHpzc, the surface of PE/LG-CNTs-Ni/Al2O3 composite would be negatively charged as the solution pH is higher than 5.42. The adsorption of Pb(II) is conducted in the solution pH range of 2–6 (see Fig. 9) in the present study. It is hence inferred that electrostatic attraction between the negatively charged surface of PE/LG-CNTs-Ni/Al2O3 composite and positively charged Pb(II) would occur as the solution pH is relatively high (i.e., 5.5 and 6). (3) π electron–cation interaction. It is reported that aromatic C
O, C–O, –OH, suggesting that the complexation between Pb(II) and O-containing surface functional groups may make contributions to the adsorption of Pb(II). (2) Electrostatic attraction. The pHpzc value of PE/LG-CNTs-Ni/Al2O3 composite is 5.42 as shown in Table 1. According to the characteristics of pHpzc, the surface of PE/LG-CNTs-Ni/Al2O3 composite would be negatively charged as the solution pH is higher than 5.42. The adsorption of Pb(II) is conducted in the solution pH range of 2–6 (see Fig. 9) in the present study. It is hence inferred that electrostatic attraction between the negatively charged surface of PE/LG-CNTs-Ni/Al2O3 composite and positively charged Pb(II) would occur as the solution pH is relatively high (i.e., 5.5 and 6). (3) π electron–cation interaction. It is reported that aromatic C![[double bond, length as m-dash]](https://www.rsc.org/images/entities/char_e001.gif) C of carbon materials is considered to be active sites for Pb(II) adsorption via π electron–cation interaction due to the delocalized π electron in C
C of carbon materials is considered to be active sites for Pb(II) adsorption via π electron–cation interaction due to the delocalized π electron in C![[double bond, length as m-dash]](https://www.rsc.org/images/entities/char_e001.gif) C structure has good affinity with metal cations (Pb(II)).43 FT-IR result in Fig. 4 shows that the C
C structure has good affinity with metal cations (Pb(II)).43 FT-IR result in Fig. 4 shows that the C![[double bond, length as m-dash]](https://www.rsc.org/images/entities/char_e001.gif) C originated from the graphitic structure in CNTs can be seen in PE/LG-CNTs-Ni/Al2O3 composite, which hence may act as active sites for the adsorption of Pb(II). (4) Complexation with AlOH. Al2O3 can be considered as a high-efficient adsorbent to adsorption heavy metal ions according to the complexation between AlOH and metal ions.45 In the present study, Al2O3 is employed as the substrate to prepare NiO/Al2O3 catalyst, which also is the major component of the PE/LG-CNTs-Ni/Al2O3 composite as evidenced by TPO analysis in Fig. 3a. As a result, the complexation between Pb(II) and AlOH originated from Al2O3 is responsible for the adsorption of Pb(II) to a certain degree.
C originated from the graphitic structure in CNTs can be seen in PE/LG-CNTs-Ni/Al2O3 composite, which hence may act as active sites for the adsorption of Pb(II). (4) Complexation with AlOH. Al2O3 can be considered as a high-efficient adsorbent to adsorption heavy metal ions according to the complexation between AlOH and metal ions.45 In the present study, Al2O3 is employed as the substrate to prepare NiO/Al2O3 catalyst, which also is the major component of the PE/LG-CNTs-Ni/Al2O3 composite as evidenced by TPO analysis in Fig. 3a. As a result, the complexation between Pb(II) and AlOH originated from Al2O3 is responsible for the adsorption of Pb(II) to a certain degree.| CarbonOHOH + Pb2+ → CarbonOOPb + 2H+ | (10) |
| CarbonCOOHCOOH + Pb2+ → CarbonCOOCOOPb + 2H+ | (11) |
| CarbonOHCOOH + Pb2+ → CarbonOCOOPb + 2H+ | (12) |
3.3 Reusability
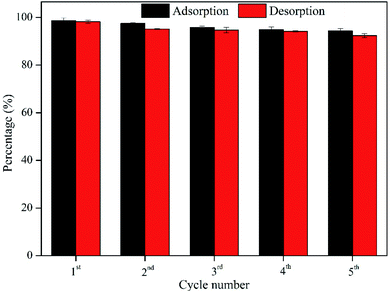
The reusability of an adsorbent greatly determines its cost and practical application prospect. According to the results presented above, PE/LG-CNTs-Ni/Al2O3 composite is found to be a superior adsorbent for the adsorption of Pb(II) in comparison with PE-CNTs-Ni/Al2O3 and LG-Chars-Ni/Al2O3 as well as other composites reported before. Accordingly, it is of significance to investigate the reusability of PE/LG-CNTs-Ni/Al2O3 composite. The result of five successive adsorption–regeneration cycles of PE/LG-CNTs-Ni/Al2O3 composite for Pb(II) adsorption is given in Fig. 10. As shown, the adsorption efficiency is 98.71%, 97.51%, 95.89%, 94.88% and 94.35% after the 1st, 2nd, 3rd, 4th and 5th cycle, respectively, indicating that PE/LG-CNTs-Ni/Al2O3 composite has excellent operating stability and is reusable.4 Conclusions
Well-ordered CNTs, amorphous carbon and curved cone-shape CNTs are obtained from the catalytic reforming the pyrolysis volatiles of PE, LG and their mixture, respectively, using home-made NiO/Al2O3 as catalyst according to the results from SEM and TEM. The curved cone-shape CNTs from PE/LG mixture possessing a diameter range of 10–100 nm and a length range of 0.1–1 μm are abundant in structural defects and O-containing surface functional groups, such as C–O, C![[double bond, length as m-dash]](https://www.rsc.org/images/entities/char_e001.gif) O and –OH. Py-GC/MS result reveals that the volatiles of PE/LG mixture are mainly composed of hydrocarbons and oxygenated compounds, which are highly responsible for the production of the curved cone-shape CNTs with unique characteristics. The curved cone-shape CNTs-containing catalyst composite presents a superior adsorption capability towards Pb(II) when it is employed in Pb(II) removal. Adsorption isotherm and adsorption kinetic studies show that the adsorption process can be well simulated by the Langmuir isotherm and Pseudo-second-order model, demonstrating that the adsorption is subjected to a homogeneous and chemical process. The calculated maximum adsorption capacity is as high as 146.08 mg g−1, which is much higher than most of the adsorbents reported. Moreover, thermodynamic analysis reveals that the adsorption is spontaneous and endothermic. The mechanism for the high-efficient adsorption of Pb(II) by CNTs-containing catalyst composite are attributed to the interactions including complexation with O-containing surface functional groups, electrostatic attraction, π electron–cation interaction and complexation with AlOH.
O and –OH. Py-GC/MS result reveals that the volatiles of PE/LG mixture are mainly composed of hydrocarbons and oxygenated compounds, which are highly responsible for the production of the curved cone-shape CNTs with unique characteristics. The curved cone-shape CNTs-containing catalyst composite presents a superior adsorption capability towards Pb(II) when it is employed in Pb(II) removal. Adsorption isotherm and adsorption kinetic studies show that the adsorption process can be well simulated by the Langmuir isotherm and Pseudo-second-order model, demonstrating that the adsorption is subjected to a homogeneous and chemical process. The calculated maximum adsorption capacity is as high as 146.08 mg g−1, which is much higher than most of the adsorbents reported. Moreover, thermodynamic analysis reveals that the adsorption is spontaneous and endothermic. The mechanism for the high-efficient adsorption of Pb(II) by CNTs-containing catalyst composite are attributed to the interactions including complexation with O-containing surface functional groups, electrostatic attraction, π electron–cation interaction and complexation with AlOH.
Author contributions
Zhanghong Wang and Kun Qin designed the idea and carried out experiment. Zhikang Wang, Dekui Shen and Chunfei Wu supervised the work. The manuscript was written through contributions of all authors.Conflicts of interest
There are no conflicts to declare.Acknowledgements
The authors greatly acknowledge the funding support from the projects supported by National Natural Science Foundation of China (Grant no. 51676047 and 41867048), Guizhou Provincial Science-technology Support Plan Projects in 2018 (Guizhou Science Support [2018]2807), the scientific research fund of Guizhou Minzu University (GZMUZK[2021]YB13), the scientific research platform of Guizhou Minzu University (GZMUGCZX[2021]02) and the construction project of Key Laboratory of State Ethnic Affairs Commission ([2020] No. 91 of DDA office).References
- A. Talbi, Y. Kerchich, R. Kerbachi and M. Boughedaoui, Environ. Pollut., 2018, 232, 252–263 CrossRef CAS PubMed.
- Z. Wang, D. Shen, F. Shen, C. Wu and S. Gu, J. Mol. Liq., 2017, 241, 612–621 CrossRef CAS.
- N. Bortey-Sam, Y. Ikenaka, O. Akoto, S. M. M. Nakayama, K. A. Asante, E. Baidoo, C. Obirikorang, H. Mizukawa and M. Ishizuka, Environ. Pollut., 2018, 235, 163–170 CrossRef CAS PubMed.
- A. I. A. Sherlala, A. A. A. Raman, M. M. Bello and A. Asghar, Chemosphere, 2018, 193, 1004–1017 CrossRef CAS PubMed.
- A. A. Ihsanullah, A. M. Al-Amer, T. Laoui, M. J. Al-Marri, M. S. Nasser, M. Khraisheh and M. A. Atieh, Sep. Purif. Technol., 2016, 157, 141–161 CrossRef CAS.
- X. Ren, C. Chen, M. Nagatsu and X. Wang, Chem. Eng. J., 2011, 170, 395–410 CrossRef CAS.
- Z. Wang, D. Shen, F. Shen, C. Wu and S. Gu, J. Mol. Liq., 2017, 241, 603–611 CrossRef CAS.
- S. K. Hubadillah, M. H. D. Othman, Z. Harun, A. F. Ismail, M. A. Rahman and J. Jaafar, Ceram. Int., 2017, 43, 4716–4720 CrossRef CAS.
- N. Kobylinska, D. Klymchuk, A. Shakhovsky, O. Khainakova, Y. Ratushnyak, V. Duplij and N. Matvieieva, RSC Adv., 2021, 11, 26974–26987 RSC.
- Q. Liu, G.-L. Zang and Q. Zhao, RSC Adv., 2021, 11, 25880–25891 RSC.
- Z. Wang, D. Shen, C. Wu and S. Gu, Green Chem., 2018, 20, 5031–5057 RSC.
- L. Xu, S. Wang, J. Zhou, H. Deng and R. L. Frost, Chem. Eng. J., 2018, 335, 450–457 CrossRef CAS.
- W. N. Nyairo, Y. R. Eker, C. Kowenje, I. Akin, H. Bingol, A. Tor and D. M. Ongeri, Sep. Sci. Technol., 2018, 53, 1498–1510 CrossRef CAS.
- M. Yao, Z. Wang, Y. Liu, G. Yang and J. Chen, Carbohydr. Polym., 2019, 212, 345–351 CrossRef CAS PubMed.
- L. Cao, I. K. M. Yu, Y. Liu, X. Ruan, D. C. W. Tsang, A. J. Hunt, Y. S. Ok, H. Song and S. Zhang, Bioresour. Technol., 2018, 269, 465–475 CrossRef CAS PubMed.
- N. Yari Moghaddam, B. Lorestani, M. Cheraghi and S. Jamehbozorgi, Water Environ. Res., 2019, 19, 475–482 CrossRef PubMed.
- C. Wu, J. Huang and P. T. Williams, Int. J. Hydrogen Energy, 2013, 38, 8790–8797 CrossRef CAS.
- D. Xu, S. Yang, Y. Su, Y. Xiong and S. Zhang, J. Hazard. Mater., 2021, 413, 125289 CrossRef CAS PubMed.
- C. Wu, Z. Wang, P. T. Williams and J. Huang, Sci. Rep., 2013, 3, 2742 CrossRef.
- C. Wu, Z. Wang, J. Huang and P. T. Williams, Fuel, 2013, 106, 697–706 CrossRef CAS.
- D. Shen, J. Zhao, R. Xiao and S. Gu, J. Anal. Appl. Pyrolysis, 2015, 111, 47–54 CrossRef CAS.
- C. Wu, Z. Wang, L. Wang, P. T. Williams and J. Huang, RSC Adv., 2012, 2, 4045–4047 RSC.
- J. Alvarez, S. Kumagai, C. Wu, T. Yoshioka, J. Bilbao, M. Olazar and P. T. Williams, Int. J. Hydrogen Energy, 2014, 39, 10883–10891 CrossRef CAS.
- C. Wu, Z. Wang, V. Dupont, J. Huang and P. T. Williams, J. Anal. Appl. Pyrolysis, 2013, 99, 143–148 CrossRef CAS.
- A. Soomro, S. Chen, S. Ma, C. Xu, Z. Sun and W. Xiang, Biomass Bioenergy, 2018, 115, 210–222 CrossRef CAS.
- Z. W. Pan, S. S. Xie, B. H. Chang, L. F. Sun, W. Y. Zhou and G. Wang, Chem. Phys. Lett., 1999, 299, 97–102 CrossRef CAS.
- H. Wang, Z. Xu, A. Kohandehghan, Z. Li, K. Cui, X. Tan, T. J. Stephenson, C. K. King’ondu, C. M. B. Holt, B. C. Olsen, J. K. Tak, D. Harfield, A. O. Anyia and D. Mitlin, ACS Nano, 2013, 7, 5131–5141 CrossRef CAS PubMed.
- S. Tabesh, F. Davar and M. R. Loghman-Estarki, J. Alloys Compd., 2018, 730, 441–449 CrossRef CAS.
- S. Gillet, M. Aguedo, L. Petitjean, A. R. C. Morais, A. M. da Costa Lopes, R. M. Lukasik and P. T. Anastas, Green Chem., 2017, 19, 4200–4233 RSC.
- C. Wu, M. A. Nahil, N. Miskolczi, J. Huang and P. T. Williams, Environ. Sci. Technol., 2014, 48, 819–826 CrossRef CAS PubMed.
- V. Fierro, V. Torné-Fernández and A. Celzard, Microporous Mesoporous Mater., 2006, 92, 243–250 CrossRef CAS.
- R. Bagri and P. T. Williams, J. Anal. Appl. Pyrolysis, 2002, 63, 29–41 CrossRef CAS.
- W. Jin, D. Shen, Q. Liu and R. Xiao, Polym. Degrad. Stab., 2016, 133, 65–74 CrossRef CAS.
- K. A. Shah and B. A. Tali, Mater. Sci. Semicond. Process., 2016, 41, 67–82 CrossRef CAS.
- W.-J. Liu, H. Jiang and H.-Q. Yu, Green Chem., 2015, 17, 4888–4907 RSC.
- L. Yu, Y. Lv, Y. Zhao and Z. Chen, Mater. Lett., 2010, 64, 2145–2147 CrossRef CAS.
- W. Zhang, S. Mao, H. Chen, L. Huang and R. Qiu, Bioresour. Technol., 2013, 147, 545–552 CrossRef CAS PubMed.
- L. Zhou, L. Ji, P.-C. Ma, Y. Shao, H. Zhang, W. Gao and Y. Li, J. Hazard. Mater., 2014, 265, 104–114 CrossRef CAS PubMed.
- I. A. A. Hamza, B. S. Martincigh, J. C. Ngila and V. O. Nyamori, Phys. Chem. Earth, 2013, 66, 157–166 CrossRef.
- D. K. Venkata Ramana, D. H. Kumar Reddy, B. N. Kumar, K. Seshaiah, G. P. Chandra Rao and C. Lu, Sep. Sci. Technol., 2013, 48, 403–412 CrossRef.
- Z. Wang, D. Shen, F. Shen and T. Li, Chemosphere, 2016, 150, 1–7 CrossRef CAS PubMed.
- Z. Wang, F. Shen, D. Shen, Y. Jiang and R. Xiao, J. Environ. Sci., 2017, 53, 293–300 CrossRef CAS PubMed.
- L. Fan, P. Chen, Y. Zhang, S. Liu, Y. Liu, Y. Wang, L. Dai and R. Ruan, Bioresour. Technol., 2017, 225, 199–205 CrossRef CAS PubMed.
- Z. Wang, G. Liu, H. Zheng, F. Li, H. H. Ngo, W. Guo, C. Liu, L. Chen and B. Xing, Bioresour. Technol., 2015, 177, 308–317 CrossRef CAS.
- W. Sun, K. Yin and X. Yu, Chem. Eng. J., 2013, 225, 464–473 CrossRef CAS.
Footnote |
| † Electronic supplementary information (ESI) available. See DOI: 10.1039/d1ra06762a |
| This journal is © The Royal Society of Chemistry 2021 |

