 Open Access Article
Physical mechanisms of photoinduced charge transfer in neutral and charged donor–acceptor systems
Chunhua Tian†
a,
Yichuan Chen†b,
Pen-ji Yan†c,
Mengtao Sun *b and
Jun Quan*a
aSchool of Physics Science and Technology, Lingnan Normal University, Zhanjiang 524048, People's Republic of China. E-mail: b1603882@ustb.edu.cn; quanj@lingnan.edu.cn
bSchool of Mathematics and Physics, University of Science and Technology Beijing, Beijing 100083, People's Republic of China
cCollege of Chemistry and Chemical Engineering, Key Laboratory of Hexi Corridor Resources Utilization of Gansu Universities, Hexi University, Zhangye 734000, PR China
First published on 29th November 2021
Abstract
In this paper, we provide visualization methods to reveal the physical mechanisms of photoinduced charge transfer in neutral and charged donor–acceptor systems. These visualization methods use the charge density difference and transition density matrix, which can promote deeper understanding of photoinduced charge transfer in donor–acceptor systems.
1. Introduction
Photoinduced charge transfer is one of the most crucial issues in the fields of biology, material science and chemistry.1–5 To better understand the processes of photoinduced charge transfer, revealing the physical mechanisms of photoinduced charge transfer is required in neutral and charged donor–acceptor systems;1–3 for example, the electron–hole redistribution after excitation6 and the electron–hole coherence7 in the dynamic process of charge transfer. In this paper, we report visualization methods to visually reveal the physical mechanisms of photoinduced charge transfer in neutral and charged donor–acceptor systems of poly[2,1,3-benzothiadiazole-4,7-diyl[4,4-bis(2-ethylhexyl)-4H-cyclopenta-2,1-b:3,4-b′]dithiophene-siloe-2,6-diyl] (Si-PCPDTBT, see inset in Fig. 2(a)), based on the recent experiments in ref. 8–10. The optoelectrical properties of the donor–acceptor systems of Si-PCPDTBT and PCPDTBT as candidate for organic solar cells have been reported in ref. 8–11.2. Methods
All the theoretical calculations were performed with the Gaussian 16 software.12 The default boundary condition and vacuum environment were used. The geometry of Si-PCPDTBT at ground state was optimized with density functional theory (DFT),13 B3LYP functional,14 and the 6-31G(d) basis set. The side chains of Si-PCPDTBT which are not conjugated bonds were replaced by H atoms and each unit cell contained 20 non-H atoms in our calculations. The optical properties of electrical transitions were calculated with time-dependent DFT (TD-DFT),15 LC-BLYP functional16 and the 6-31G(d) basis set. Here, the long-range corrected (LC) functional was used instead of the more common Coulomb-attenuated method (CAM), because we noted that the CAM-B3LYP functional only has a 65% fraction of asymptotic nonlocal exchange as opposed to the rigorously correct 100% fraction that the exact exchange-correlation functional would have. Previous works have showed that charge-transfer effects with a “full” range-separated functional can give more accurate charge-transfer excitation energies.17,18 Previously, it was shown that optimally tuned range-separated functionals are much better for such visualizations in donor–acceptor complexes. Therefore, we took the LC-BLYP functional to tune the separation parameter for the investigated system.19–21 Charge density difference (CDD)6 and transition density matrix (TDM)7 were employed to visually reveal the physical mechanisms of photoinduced charge transfer in neutral and charged donor–acceptor systems. Detailed information on the visualization methods has been described in ref. 22.3. Results and discussion
The range-separation equation splits the exchange into short-range and long-range parts in terms of the interelectronic distance (r12),
 | (1) |
 | (2) |
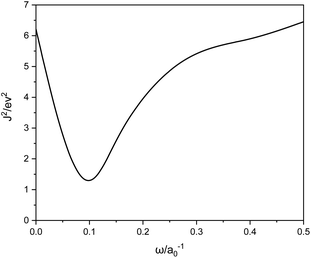
For the systems under study, ω = 0.1 is the best, as shown in Fig. 1. We can see that ω is much smaller than the typical LC functional values of 0.3–0.5, meaning a switch to eX at larger r12.
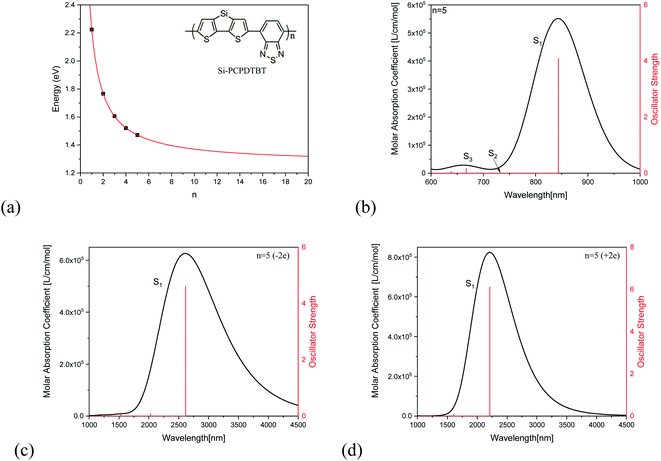
Fig. 2(a) demonstrates the unit number (n)-dependent optical excitation energies S1 for Si-PCPDTBT. It is found that the S1 energy exponentially decreases with the increase of n, which can be used to estimate the S1 energies when n is large enough, and that En=∞ = 1.4 eV. Fig. 2(b) shows the absorption spectrum of Si-PCPDTBT (n = 5), which demonstrates that the strongest optical absorption is for S1 and the optical absorption strength is almost vanished for S2, while the optical absorption for S3 is much weaker than that of S1 but stronger than that of S2. Fig. 2(c) and (d) are the absorption spectra for the −2e and +2e charged Si-PCPDTBT (n = 5), respectively. It is found that the absorption peaks of charged Si-PCPDTBT are significantly red-shifted to the IR region.
To reveal the optical properties of photoinduced charge transfer, the visualization method of charge density difference (CDD) was employed. Fig. 3 demonstrates that the holes and electrons are localized on the donor and acceptor units, respectively; where green and red stand for the holes and electrons, respectively. CDD can well demonstrate the distribution of holes and electrons along Si-PCPDTBT, which is the result of photoinduced charge transfer. However, the electron–hole coherence on the photoinduced charge transfer cannot be reflected, such as the locations of electrons and holes on Si-PCPDTBT after the photoinduced charge transfer.
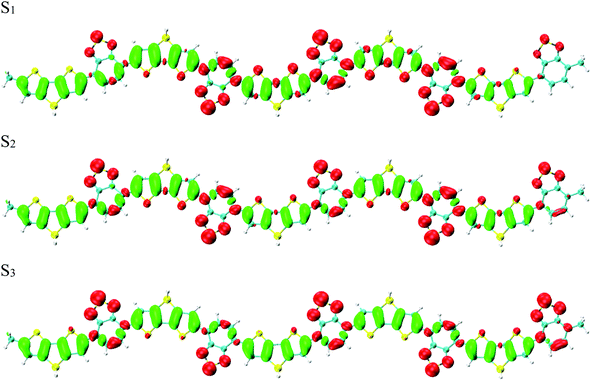 | ||
| Fig. 3 Charge density difference (CDD) for the first three excited states, where green and red stand for holes and electrons, respectively. | ||
To reveal the electron–hole coherence on the photoinduced charge transfer for the different excited states, transition density matrix (TDM) was employed, as seen in Fig. 4. For S1, the TDM reveals that the electron–hole coherence in the inner units is much stronger than that in the outer units along the molecular chain (along the symmetric diagonal) and the length of electron–hole coherence is about 30 atoms (along the anti-symmetric diagonal). For S2, along the symmetric diagonal, we can see that there are two sub-sections for the electron–hole coherence with a nod at the center point of the molecular chain, which reveal that there are two sub-transition dipole moments with opposite orientations along the molecular chain, which results in ![[small mu, Greek, vector]](https://www.rsc.org/images/entities/i_char_e0e9.gif) total =
total = ![[small mu, Greek, vector]](https://www.rsc.org/images/entities/i_char_e0e9.gif) 1 +
1 + ![[small mu, Greek, vector]](https://www.rsc.org/images/entities/i_char_e0e9.gif) 2 ≈ 0, and a vanished absorption peak. For S3, the most distinguished characteristic is that there are two nods for the electron–hole coherence, and three sub-transition dipole moments, while, the outer two sub-transitions are of opposite orientations, which results in
2 ≈ 0, and a vanished absorption peak. For S3, the most distinguished characteristic is that there are two nods for the electron–hole coherence, and three sub-transition dipole moments, while, the outer two sub-transitions are of opposite orientations, which results in ![[small mu, Greek, vector]](https://www.rsc.org/images/entities/i_char_e0e9.gif) total =
total = ![[small mu, Greek, vector]](https://www.rsc.org/images/entities/i_char_e0e9.gif) 1 +
1 + ![[small mu, Greek, vector]](https://www.rsc.org/images/entities/i_char_e0e9.gif) 2 +
2 + ![[small mu, Greek, vector]](https://www.rsc.org/images/entities/i_char_e0e9.gif) 3 ≈
3 ≈ ![[small mu, Greek, vector]](https://www.rsc.org/images/entities/i_char_e0e9.gif) 2. These results reveal that
2. These results reveal that ![[small mu, Greek, vector]](https://www.rsc.org/images/entities/i_char_e0e9.gif) total(S1) >
total(S1) > ![[small mu, Greek, vector]](https://www.rsc.org/images/entities/i_char_e0e9.gif) total(S3) >
total(S3) > ![[small mu, Greek, vector]](https://www.rsc.org/images/entities/i_char_e0e9.gif) total(S2), and the optical absorption strengths are f(S1) > f(S3) > f(S2), as seen in Fig. 2(b).
total(S2), and the optical absorption strengths are f(S1) > f(S3) > f(S2), as seen in Fig. 2(b).
 | ||
| Fig. 4 Transition density matrix for the first three excited states, where the scale bar stands for the strength of electron–hole coherence. TD-DFT calculated with the LC-BLYP functional. | ||
Comparing the transition density matrix calculated with the LC-BLYP functional in TD-DFT in Fig. 4 and those calculated with the CAM-B3LYP functional in TD-DFT in Fig. 5, we find that the results in Fig. 4 can reflect the photoinduced charge transfer better than that in Fig. 5 for the individual excited states.
 | ||
| Fig. 5 Transition density matrix for the first three excited states, where the scale bar stands for the strength of electron–hole coherence. TD-DFT calculated with the CAM-B3LYP functional. | ||
The visualization methods in Fig. 3 and 4 were used to reveal the charge transfer and electron–hole coherence for the neutral donor–acceptor system. If the donor–acceptor system is a positively or negatively charged system, the charge transfer and electron–hole coherence are significantly different from those in the neutral system. To demonstrate that, the optical properties of S1 are investigated, as seen Fig. 6 and 7. Fig. 6(a) and (b) illustrate the −2e and +2e charged CDD for S1 of Si-PCPDTBT, respectively. It is found that the additional charges move to the outer units; for example, negative charges are moved to the outer units and positive charges are localized in the inner units for the -2e Si-PCPDTBT, but for the +2e Si-PCPDTBT, additional positive charges are moved to the outer units and the negative charges are localized in the inner units. Therefore, for the charged system, the distribution of electron and holes is independent of the donor or acceptor units of Si-PCPDTBT. Comparing the electron–hole coherence for charged S1 (in Fig. 7) and neutral S1 (in Fig. 4), it is found that the electron–hole coherence in the outer units is stronger than that in the inner units (along the symmetric diagonal), and the delocalization length of the charged system is larger than that of the neutral system (along the anti-symmetric diagonal).
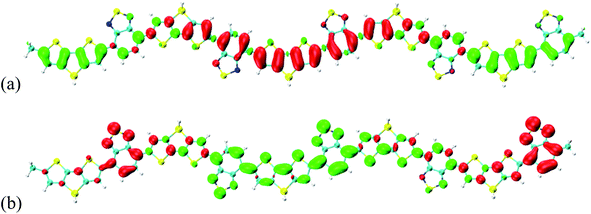 | ||
| Fig. 6 (a) −2e and (b) +2e charged CDD for S1 of Si-PCPDTBT, where green and red stand for holes and electrons, respectively. | ||
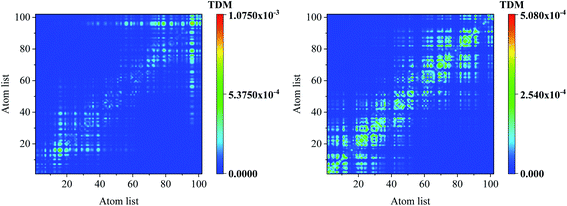 | ||
| Fig. 7 Transition density matrix for the first excited states, where the scale bar stands for the strength of electron–hole coherence. | ||
In order to investigate the extent of physical CT in the CT excitation, the spatial overlap between different excited states was calculated. The Λ index essentially measures the overlapping degree of holes and electrons of the electron excitations,23 which is defined by
 | (3) |
4. Conclusion
In summary, the physical mechanisms of photoinduced charge transfer in neutral and charged donor–acceptor systems are revealed by the visualization methods of CDD and TDM in donor–acceptor systems, which can promote a deeper understanding of the physical mechanisms of photoinduced charge transfer.Conflicts of interest
There are no conflicts to declare.Acknowledgements
This work was supported by the Natural Science Foundation of Guangdong Province in China (No. 2019A1515011132), the Key Scientific Research Platforms and Projects in Guangdong Universities (Grant No. 2018KZDXM046, 2019KTSCX090), the Research Foundation for Advanced Talents of Lingnan Normal University (Grant No. ZL2021020), the National Natural Science Foundation of China (Grant No. 91436102, 11374353), the Fundamental Research Funds for the Central Universities (06500067), the 2020 Special Planning Projects of Hexi University (No. HXZX08), and the NSFC-BRICS STI (Grant: 51861145309).References
- C. Fuentes-Hernandez, W. F. Chou and T. M. Khan, et al., Large-area low-noise flexible organic photodiodes for detecting faint visible light, Science, 2020, 370, 698 CrossRef CAS PubMed.
- A. Tada, Y. F. Geng and Q. S. Wei, et al., Tailoring organic heterojunction interfaces in bilayer polymer photovoltaic devices, Nat. Mater., 2011, 10, 450 CrossRef CAS PubMed.
- T. Polívka and V. Sundström, Ultrafast dynamics of carotenoid excited States−From solution to natural and artificial systems, Chem. Rev., 2004, 104, 2021–2072 CrossRef PubMed.
- A. A. Kistanov, Y. Cai, K. Zhou, S. V. Dmitriev and Y. W. Zhang, Atomic-scale mechanisms of defect-and light-induced oxidation and degradation of InSe, J. Mater. Chem. C, 2018, 6, 518–525 RSC.
- E. Rani, P. Talebi, W. Cao, M. Huttula and H. Singh, Harnessing photo/electro-catalytic activity via nano-junctions in ternary nanocomposites for clean energy, Nanoscale, 2020, 12, 23461–23479 RSC.
- X. Mu and M. T. Sun, Interfacial charge transfer exciton enhanced by plasmon in 2D inplane lateral and van der Waals heterostructures, Appl. Phys. Lett., 2020, 117, 09160 Search PubMed.
- S. Tretiak and S. Mukamel, Density matrix analysis and simulation of electronic excitations in conjugated and aggregated molecules, Chem. Rev., 2002, 102, 3171–3212 CrossRef CAS PubMed.
- N. Gasparini, X. Jiao, T. Heumueller, D. Baran, G. J. Matt, S. Fladischer and T. Ameri, Designing ternary blend bulk heterojunction solar cells with reduced carrier recombination and a fill factor of 77%, Nat. Energy, 2016, 1, 16008 CrossRef.
- S. Kahmann, D. Fazzi, G. J. Matt, W. Thiel, M. A. Loi and C. J. Brabec, Polarons in Narrow Band Gap Polymers Probed over the Entire Infrared Range: A Joint Experimental and Theoretical Investigation, J. Phys. Chem. Lett., 2016, 7, 4438 CrossRef CAS PubMed.
- R. Tautz, E. Da Como and T. Limmer, et al., Structural correlations in the generation of polaron pairs in low-bandgap polymers for photovoltaics, Nat. Commun., 2012, 3, 970 CrossRef PubMed.
- R. A. F. Alexandre, O. V. de Oliveira and J. D. dos Santos, Theoretical studies of new PCPDTBT derivatives as possible electron donor on polymer solar cells, Chem. Phys. Lett., 2021, 766, 138328 CrossRef CAS.
- M. J. Frisch, G. W. Trucks, H. B. Schlegel, G. E. Scuseria, M. A. Robb, J. R. Cheeseman, G. Scalmani, V. Barone, B. Mennucci, G. A. Petersson, et al., Gaussian 16, Gaussian Inc., Wallingford CT, 2016 Search PubMed.
- W. Kohn and L. J. Sham, Self-consistent equations including exchange and correlation effects, Phys. Rev., 1965, 140, A1133–A1138 CrossRef.
- A. Becke, Density-functional exchange-energy approximation with correct asymptotic behavior, Phys. Rev. A: At., Mol., Opt. Phys., 1988, 38, 3098–3110 CrossRef CAS PubMed.
- E. K. U. Gross and W. Kohn, Local density-functional theory of frequency-dependent linear response, Phys. Rev. Lett., 1985, 55, 2850–2852 CrossRef CAS PubMed.
- H. Iikura, T. Tsuneda, T. Yanai and K. Hirao, A Long-Range Correction Scheme for Generalized-Gradient-Approximation Exchange Functionals, J. Chem. Phys., 2001, 115, 3540–3544 CrossRef CAS.
- B. M. Wong and T. H. Hsieh, Optoelectrical and Excitonic Properties of oligoacences: Substantial improvements from Range-separated time-dependent density functional theory, J. Chem. Theory Comput., 2010, 6, 3704–3712 CrossRef CAS PubMed.
- Z. C. Wong, W. Y. Fan, T. S. Chwee and M. B. Sullivan, Using non-empirically tuned range-separated functionals with simulated emission bands to model fluorescence lifetimes, Phys. Chem. Chem. Phys., 2017, 19, 21046–21057 RSC.
- H. Sun and J. Autschbach, Influence of the delocalization error and applicability of optimal functional tuning in density functional calculations of nonlinear optical properties of organic donor–acceptor chromophores, ChemPhysChem, 2013, 14, 2450–2461 CrossRef CAS PubMed.
- J. Autschbach and M. Srebro, Delocalization error and “functional tuning” in Kohn–Sham calculations of molecular properties, Acc. Chem. Res., 2014, 47, 2592–2602 CrossRef CAS PubMed.
- A. K. Pal, T. J. Duignan and J. Autschbach, Calculation of linear and nonlinear optical properties of azobenzene derivatives with Kohn–Sham and coupled-cluster methods, Phys. Chem. Chem. Phys., 2018, 20, 7303–7316 RSC.
- X. Mu, J. Wang and M. Sun, Visualization of Photoinduced Charge Transfer and Electron–Hole Coherence in Two-Photon Absorption, J. Phys. Chem. C, 2019, 123, 14132–14143 CrossRef CAS.
- M. J. Peach, P. Benfield, T. Helgaker and D. J. Tozer, Excitation energies in density functional theory: An evaluation and a diagnostic test, J. Chem. Phys., 2008, 128, 044118 CrossRef PubMed.
Footnote |
| † Contributed equally. |
| This journal is © The Royal Society of Chemistry 2021 |

