 Open Access Article
Deep in blue with green chemistry: influence of solvent and chain length on the behaviour of N- and N,N′- alkyl indigo derivatives†
Daniela
Pinheiro
 a,
Marta
Pineiro
 a,
Adelino M.
Galvão
b and
J. Sérgio
Seixas de Melo
 *a
*a
aUniversity of Coimbra, CQC, Department of Chemistry, Rua Larga, 3004-535 Coimbra, Portugal. E-mail: sseixas@ci.uc.pt
bCentro de Química Estrutural, Departamento de Engenharia Química, Instituto Superior Técnico (IST), Universidade de Lisboa, Av. Rovisco Pais, 1049-001 Lisboa, Portugal
First published on 22nd October 2020
Abstract
Using green chemistry procedures the synthesis of N-alkyl (NCnInd) and N,N′-dialkyl (N,N′CnInd) indigo derivatives, with n = 1–3, 6, 8, 12 and 18, was undertaken, leading to compounds with blueish to greenish colors in solution. The effect of the alkyl chain length on the spectral (including color) and photophysical properties of the compounds was explored. This was done with solvents of different viscosities and polarities (dielectric constants). From time-resolved fluorescence and femtosecond-transient absorption (fs-TA) for the NCnInd derivatives with n = 1 and 2, the decays are, in methylcyclohexane (MCH) and n-dodecane, single-exponential, while in 2-methyltetrahydrofuran (2MeTHF) they are bi-exponential. The excited state proton transfer (ESPT) is ultrafast (<1 ps) for NC1,2Ind in MCH and n-dodecane, supported by time-dependent density functional theory (TDDFT) calculations, thus showing that both the chain length and solvent influence the ESPT process. For N,N′CnInd, from time-resolved experiments, and with the exception of the shortest member of the series, N,N′C1Ind, two conformers are found to be present in the excited state.
Introduction
Indigo has been rightfully considered an iconic dye used from ancient times till today when it remains popular and is used worldwide for dyeing denim.1 Indigo can be extracted from plants (more than 700 different Indigofera species are found in nature)2 or industrially synthesized. In this last case it is linked to the modern chemical industry and the rise of the industrial revolution that led to a reconsideration of the use of natural supplies.1–3The longevity of indigo usage is chemically related to its (photo)stability which is linked to the highly efficient internal conversion and inefficient intersystem crossing and fluorescence.2,3 The highly efficient deactivation process of the excited state of indigo has been associated with a mechanistic process resulting from a fast excited state proton transfer (ESPT) between a carbonyl group and the adjacent nitrogen proton.2,4–9 In the ground state, indigo remains in a stable trans-planar configuration, as a result of the hydrogen bond originating from the two C![[double bond, length as m-dash]](https://www.rsc.org/images/entities/char_e001.gif) O and two N–H groups, thus preventing trans–cis photochemical isomerization.2,10,11 Yet, structural changes in indigo may tune its photochemical and photophysical properties. The more common modification consists in the replacement of hydrogen atoms at the 4-, 5-, 6- and 7-position of the phenyl ring with other atoms, or groups of atoms, e.g., methyl, halogen, methoxy groups.9,12,13 Replacement of both hydrogen atoms of the N–H groups in indigo by different groups has also been described and unexpected properties were observed.14–20 Indigo derivatives, which are not secondary amines and cannot establish intramolecular hydrogen bonds, showed photoinduced isomerizations.10,11,21–24Trans–cis isomerization of N,N′-substituted indigo derivatives has been studied since at least 1968 with the work of Giuliano et al. where reversible photoisomerizations were reported for N,N′-dimethylindigo in benzene.25
O and two N–H groups, thus preventing trans–cis photochemical isomerization.2,10,11 Yet, structural changes in indigo may tune its photochemical and photophysical properties. The more common modification consists in the replacement of hydrogen atoms at the 4-, 5-, 6- and 7-position of the phenyl ring with other atoms, or groups of atoms, e.g., methyl, halogen, methoxy groups.9,12,13 Replacement of both hydrogen atoms of the N–H groups in indigo by different groups has also been described and unexpected properties were observed.14–20 Indigo derivatives, which are not secondary amines and cannot establish intramolecular hydrogen bonds, showed photoinduced isomerizations.10,11,21–24Trans–cis isomerization of N,N′-substituted indigo derivatives has been studied since at least 1968 with the work of Giuliano et al. where reversible photoisomerizations were reported for N,N′-dimethylindigo in benzene.25
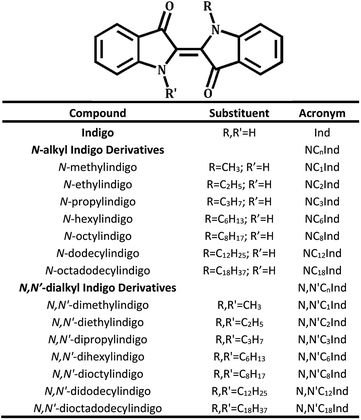
In the present work, modifications of the chromophoric core (H-chromophore) of indigo, following a similar methodology to that reported by Setsune,26 were undertaken by replacing one or two hydrogens of indigo's N–H groups with alkyl groups with an increased number of carbons (see Scheme 1). A total of seven N-alkyl indigo derivatives and seven N,N′-dialkyl indigo derivatives have been synthesized and investigated in different solvent media in order to study the influence of the substitution of the alkyl groups on the electronic spectral, photophysical and photochemical properties of the compounds. The observed properties and behaviour were further rationalized with the help of TDDFT computational studies.
Results and discussion
Synthesis of the N- and N,N′-alkyl indigo derivatives
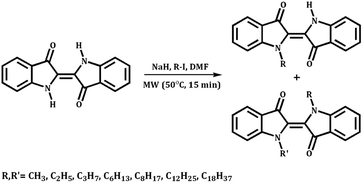
The synthesis of N- and N,N′-alkyl indigo derivatives was performed by using a typical substitution reaction of iodoalkanes using sodium hydride (NaH) as a base and N-dimethylformamide (DMF) as a solvent.26,27 The reaction was performed under microwave (MW) irradiation and the overall reaction pathway is illustrated in Scheme 2. Under MW irradiation conditions, the amount of solvent necessary to perform the reaction is strongly reduced and the reaction time decreased when compared to conventional reaction procedures.14General synthetic procedure
In a thick-glass microwave reactor, with a magnetic stirring bar, indigo (1 equiv.) and NaH (2 equiv.) were dissolved in 1 mL DMF. The corresponding alkyl halide (R–I) was added (4 equiv.) and solvent was added to a total volume of 2 mL. The resulting mixture was heated under microwave irradiation at 50 °C for 15 minutes.After cooling down to room temperature, the reaction mixture was extracted with dichloromethane and water and the organic layer was dried overnight with anhydrous sodium sulfate. After this, the mixture was filtered and the solvent concentrated under reduced pressure.
The crude was purified by column chromatography (SiO2) using dichloromethane as an eluent to give N- and N,N′-alkyl indigo derivatives, as blue and green powders, respectively.
These reactions provide both mono- and di-substituted indigos from the abundant and inexpensive parent compound indigo in a straightforward manner. In contrast to their parent indigo precursor, all compounds are readily soluble in most organic solvents, simplifying the purification, characterization and further processing.
The molecular structures of all the N- and N,N′-alkyl indigo derivatives were confirmed by 1H and 13C nuclear magnetic resonance (NMR) spectroscopy and further by gas chromatography-mass spectrometry (GC-MS) and/or high resolution mass spectrometry (HRMS). The obtained data were in accordance with the structure proposed. Detailed information on the 1H and 13C NMR spectroscopy, GC-MS and/or HRMS characterization is given in the ESI.†
Ground and excited state characterization
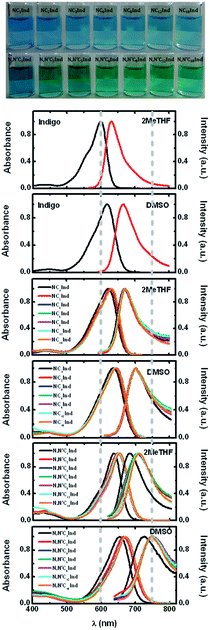
Fig. 1 also shows the absorption and emission spectra of indigo, and N- and N,N′-alkyl indigo derivatives investigated in 2MeTHF and dimethylsulfoxide (DMSO) at T = 293 K. A more careful observation of this figure shows that (i) the absorption and emission of indigo are blue-shifted relative to all other indigo derivatives; (ii) the full width at half maximum (FWHM) values of the absorption spectra of indigo and the N,N′-dialkyl indigo derivatives are similar (FWHM = 1515 cm−1) while N-alkyl indigo derivatives present a higher value (FWHM = 2129 cm−1); however (iii), the same does not occur with the emission spectra where now it is indigo and the N,N′-dialkyl indigo derivatives that display similar (and lower) FWHM values relative to the N-alkyl indigo derivatives. The overall data seem to indicate that there are different contributions to the ground and excited state geometries of the N- and N,N′-alkyl indigo derivatives. In the case of the N-alkyl indigo derivatives the narrower band spectra mirror the fact that there is a single geometry in the ground state (and singlet excited state), while for the N,N′-dialkyl indigo derivatives the more broad nature of the absorption and emission spectra suggests that in the solvents MCH and n-dodecane it is likely that more than one conformer in the ground and excited states exists. These interpretations will be further addressed and fully justified from TDDFT calculations.
The spectral properties (absorption and fluorescence emission) show that while there is little dependence of the absorption on solvent polarity (relatively small red-shift), there is a pronounced red-shift of the emission spectra, which is also mirrored by a high Stokes shift (ΔSS, see Fig. SI1 and SI2†).
TDDFT calculations show that while in absorption, excitation is to the Franck–Condon (FC) S1 surface, and only dependent on the fast component of polarization (quantified by the square of the refractive index, which can be roughly considered to be the same in all solvents), in emission, relaxation to the adiabatic surface has already occurred making it much more sensitive to, and strongly influenced by, the value of the dipole moment (Scheme 3).
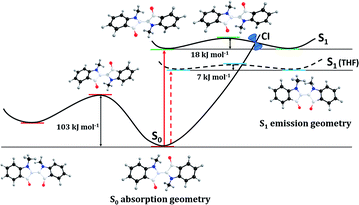
Using the shortest member of the series, NC1Ind, as an illustrative example, Scheme 3 shows how the solvent influences the polarization of the ground and singlet excited states (relaxed structures in the S0 – relaxed with S1 geometry – and S1 potential energy surfaces (PESs), S1 relaxed), the effect being more marked in the emission. The charge redistribution due to excitation/de-excitation is more marked in the emission geometry. Indeed, by changing from a non-polar solvent (MCH) to a polar one (DMSO), the difference in the ground state dipole in the S1 geometry (ΔMCH–DMSO, S0 with relaxed S1 geometry) increases by 18% (from 1.7 D to 2.0 D) but doubles (100% increase) in the S1 relaxed excited state (ΔMCH–DMSO, S1 relaxed) from 0.9 D in MCH to 1.8 D in DMSO (see Table SI1 and Fig. SI3 in the ESI†).
This can be further complemented with TDDFT calculations of Franck–Condon (FC) state excitations, in S1 emission geometries, whose difference from the adiabatic surface constitutes a qualitative measurement of the contribution of the dipole solvent stabilization to the Stokes shift. This ranges from 0 cm−1 (in MCH) to 1024 cm−1 (in DMSO), with an intermediary value of 758 cm−1 (in tetrahydrofuran (THF)).
Tables 1 and 2 summarize the spectral data for N- and N,N′-alkyl indigo derivatives and of indigo in 2MeTHF and DMSO. Full data details in all solvents are available in Tables SI2 and SI3 in the ESI.†
| Compound | Solvent | η (cP) | ε | λ Abs (nm) | λ Fluo (nm) | Δ SS (cm−1) |
|---|---|---|---|---|---|---|
| Ind | 2MeTHF | 0.575 | 7.58 | 602 | 631 | 763 |
| DMSO | 1.991 | 46.45 | 619 | 665 | 1117 | |
| NC 1 Ind | 2MeTHF | 0.575 | 7.58 | 622 | 670 | 1152 |
| DMSO | 1.991 | 46.45 | 635 | 700 | 1462 | |
| NC 2 Ind | 2MeTHF | 0.575 | 7.58 | 629 | 671 | 995 |
| DMSO | 1.991 | 46.45 | 641 | 700 | 1315 | |
| NC 3 Ind | 2MeTHF | 0.575 | 7.58 | 631 | 671 | 945 |
| DMSO | 1.991 | 46.45 | 644 | 700 | 1242 | |
| NC 6 Ind | 2MeTHF | 0.575 | 7.58 | 632 | 672 | 942 |
| DMSO | 1.991 | 46.45 | 644 | 702 | 1283 | |
| NC 8 Ind | 2MeTHF | 0.575 | 7.58 | 632 | 673 | 964 |
| DMSO | 1.991 | 46.45 | 644 | 702 | 1283 | |
| NC 12 Ind | 2MeTHF | 0.575 | 7.58 | 632 | 673 | 964 |
| DMSO | 1.991 | 46.45 | 644 | 703 | 1303 | |
| NC 18 Ind | 2MeTHF | 0.575 | 7.58 | 632 | 673 | 964 |
| DMSO | 1.991 | 46.45 | 644 | 704 | 1323 |
| Compound | Solvent | η (cP) | ε | λ Abs (nm) | λ Fluo (nm) | Δ SS (cm−1) |
|---|---|---|---|---|---|---|
| N,N′C 1 Ind | 2MeTHF | 0.575 | 7.58 | 637 | 683 | 1057 |
| DMSO | 1.991 | 46.45 | 655 | 726 | 1493 | |
| N,N′C 2 Ind | 2MeTHF | 0.575 | 7.58 | 649 | 708 | 1284 |
| DMSO | 1.991 | 46.45 | 667 | 750 | 1650 | |
| N,N′C 3 Ind | 2MeTHF | 0.575 | 7.58 | 653 | 707 | 1170 |
| DMSO | 1.991 | 46.45 | 672 | 752 | 1583 | |
| N,N′C 6 Ind | 2MeTHF | 0.575 | 7.58 | 654 | 707 | 1146 |
| DMSO | 1.991 | 46.45 | 672 | 751 | 1565 | |
| N,N′C 8 Ind | 2MeTHF | 0.575 | 7.58 | 653 | 708 | 1190 |
| DMSO | 1.991 | 46.45 | 672 | 751 | 1565 | |
| N,N′C 12 Ind | 2MeTHF | 0.575 | 7.58 | 652 | 708 | 1233 |
| DMSO | 1.991 | 46.45 | 672 | 751 | 1565 | |
| N,N′C 18 Ind | 2MeTHF | 0.575 | 7.58 | 654 | 712 | 1246 |
| DMSO | 1.991 | 46.45 | 673 | 751 | 1543 |
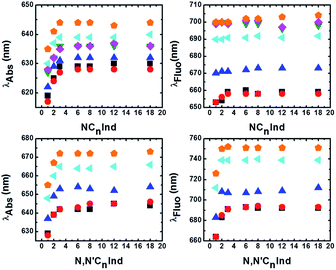
From Table 1 and Fig. 2, it can be seen that although the λabsmax of NC1Ind and NC2Ind displays a small blue-shift when compared to the other N-alkyl indigo derivatives, the fluorescence emission maxima (and spectra) are essentially identical, despite the increase in the size of the alkyl chain (from NC3Ind to NC18Ind). Similar behaviour was also observed with the N,N′-dialkyl indigo derivatives. Indeed, these display lower values for the absorption wavelength maxima of N,N′C1Ind when compared with the remaining N,N′-dialkyl indigo derivatives (Table 2 and Fig. 2). However, contrasting with the behaviour observed for the N-alkyl indigo derivatives, the fluorescence emission band of N,N′C1Ind is blue-shifted (∼20–30 nm) relative to that observed for the other N,N′-dialkyl derivatives (N,N′C2Ind to N,N′C18Ind, see Fig. 1).
Photophysical properties in solution
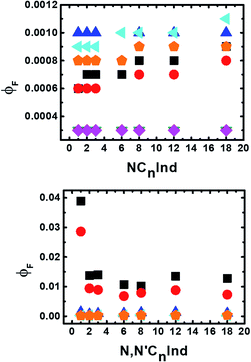
From Fig. 3 (and Table SI4†) four main observations can be made. The first (i) is that the fluorescence quantum yields of the N-alkyl indigo derivatives are much lower than those of indigo (ca. 3-fold lower in DMF). The second (ii) observation results from the fact that for the N-alkyl indigo derivatives the fluorescence quantum yields are basically identical in 2MeTHF, ethanol (EtOH) and methanol (MeOH) and close (in values) in the other solvents despite the increase of the alkyl chain length. For the N,N′-dialkyl indigo derivatives it is seen that (iii), with the exception of N,N′C1Ind in n-dodecane and MCH (which display higher ϕF values), the quantum yield values remain approximately identical in 2MeTHF, DMF and DMSO despite the increase of the alkyl chain length (see Table SI5†). Finally (iv), a comparison of the ϕF values for the mono- and di-substituted indigo derivatives shows that the latter (N,N′-dialkyl indigo derivatives) have higher values in n-dodecane and MCH. This shows that in these solvents and for N,N′C1Ind and N,N′C2Ind, the radiative deactivation channel has a higher contribution than in the higher alkyl chain derivatives (n ≥ 3).
For the N-alkyl indigo derivatives the kF values are approximately 1–2 × 10⁻² ns−1 while the kNR values are 4 orders of magnitude higher (with indigo the kNR values are only 3 times higher than kF), thus showing that, as with indigo, more than 99.9% of the quantum loss occurs through the radiationless internal conversion channel. Contrasting with this behaviour is the observation that for the N,N′-dialkyl indigo derivatives in non-polar solvents (n-dodecane and MCH) the ϕF values are 1–2 orders of magnitude higher than those in polar solvents (DMF, DMSO and even 2MeTHF). This is also reflected in the τF values and consequently in the ratio of the radiationless (kNR) and radiative (kF) constants (see Tables SI4 and SI5†).
TDDFT calculations were used to probe S0 and S1 surfaces by rotation around the central C![[double bond, length as m-dash]](https://www.rsc.org/images/entities/char_e001.gif) C bond (atoms and bonds in white in Scheme 4). As illustrated in Scheme 4, in the ground state, rotation around the central C
C bond (atoms and bonds in white in Scheme 4). As illustrated in Scheme 4, in the ground state, rotation around the central C![[double bond, length as m-dash]](https://www.rsc.org/images/entities/char_e001.gif) C bond is precluded by an activation barrier of 103 kJ mol−1. In contrast, in the excited state this barrier drops almost six-fold to 17.6 kJ mol−1. Nevertheless just a few degrees after crossing the top of the barrier a sloped conical intersection (CI) deactivates non-radiatively to the ground state, rotating back to the trans structure, instead of proceeding with an additional rotation to achieve the cis structure. This mirrors the behaviour observed in non-polar solvents. As the solvent polarity increases, the process becomes progressively less activated (e.g. 7 kJ mol−1 in THF), increasing the efficiency of this radiationless decay channel relative to the radiative channel with a corresponding drop in fluorescence quantum yield, lifetime and rate constant. This will be further complemented on the basis of the time resolved data in the next section.
C bond is precluded by an activation barrier of 103 kJ mol−1. In contrast, in the excited state this barrier drops almost six-fold to 17.6 kJ mol−1. Nevertheless just a few degrees after crossing the top of the barrier a sloped conical intersection (CI) deactivates non-radiatively to the ground state, rotating back to the trans structure, instead of proceeding with an additional rotation to achieve the cis structure. This mirrors the behaviour observed in non-polar solvents. As the solvent polarity increases, the process becomes progressively less activated (e.g. 7 kJ mol−1 in THF), increasing the efficiency of this radiationless decay channel relative to the radiative channel with a corresponding drop in fluorescence quantum yield, lifetime and rate constant. This will be further complemented on the basis of the time resolved data in the next section.
Molecular deactivation mechanisms from time-resolved experiments: picosecond (ps)-time-resolved fluorescence and femtosecond (fs)-transient absorption difference
ps-time-resolved fluorescence. In contrast to other systems, where two emissive species are clearly seen,28–31 in the case of indigo the evidence for the presence of two excited state species is given from the bi-exponential nature of the time-resolved fluorescence measurements also observed with fs-transient difference absorption (fs-TA).5,9,11,32 The two-state system in the excited state is consistent with a keto-excited form giving rise to the enol form of indigo by fast single proton transfer (SPT).5,7,9,32 The presence of the rising component (negative pre-exponential value) at longer emission wavelengths (Table SI6†) is of particular relevance, demonstrating that the second species (the long-living enol) is formed at the expense of the short-living keto species.8
From the present data, with the exception of NC1Ind and NC2Ind in n-dodecane and MCH, all the other N-alkyl indigo derivatives could be well fitted with a bi-exponential decay law according to eqn (1) (with n = 2).
 | (1) |
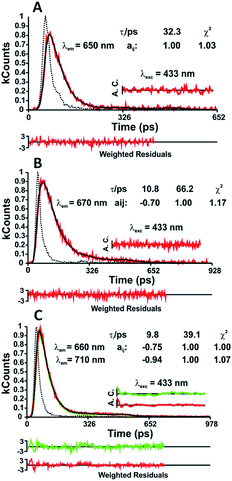
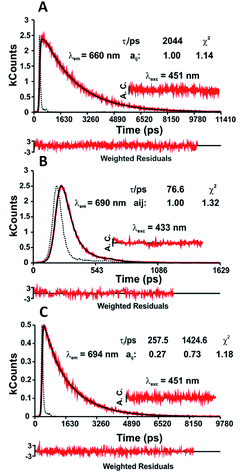
In n-dodecane and MCH, the fluorescence decays of NC1Ind and NC2Ind could be well fitted with a single exponential decay law according to eqn (1) (with n = 1) (see Table SI6†), which, as will be discussed below, is due to the fast ESPT in these compounds found to be below 1 ps. It is also worth noting that in the studied solvents intermolecular excited proton transfer (to the solvent) is precluded, a mechanism that has been proposed to exist with indigo carmine.33,34 However, inter-molecular (but involving two NC1Ind molecules), i.e. dimeric, species are predicted from TDDFT (see the discussion at the end of this section), which may explain the very fast ESPT in these compounds. Fig. 4A and B (and detailed data in Table SI6†) show the fluorescence for NC1Ind in MCH and 2MeTHF in addition to that for the long-chain NC18Ind in MCH. The mono-exponential decay for NC1Ind in MCH shows that only the enol form is able to be observed (with a value of 32.3 ps), while for NC1Ind in 2MeTHF and NC18Ind in MCH, the keto species (associated with the ESPT) is observed (10.8 ps for NC1Ind; 9.8 ps for NC18Ind) together with the decay of the enol (66.2 ps for NC1Ind; 39 ps for NC18Ind). If one considers an Arrhenius type behaviour and the activation barriers given by TDDFT calculations, with values of 3.0 kJ mol−1 and 9.5 kJ mol−1 in MCH and THF, respectively, one obtains a ratio of kMCH/k2MeTHF = 14.4. If now one uses the value of k2MeTHF as the value of kESPT = 1/10.8 ps = 9.3 × 10¹⁰ s−1 in this solvent and assuming that kMCH/k2MeTHF is 14.4, one obtains kESPT = 1/0.75 ps, leading to a value (1.33 × 10¹² s−1) that is beyond the time resolution and therefore not observed in the ps-TCSPC measurements and is likely to be mixed up with the solvent reorientation decay component in the fs-TA measurements.
In agreement with previous experimental and theoretical studies,5 density functional theory (DFT) and TDDFT calculations predict a possible internal ESPT corresponding to a keto/enol tautomerization, Scheme 5, through the N–H stretching frequency which has a saddle point with an imaginary frequency of 710 cm−1. This process, already reported previously,5 although activated (3.0 kJ mol−1 in MCH and 9.5 kJ mol−1 in THF), is a spontaneous process if corrected to zero point vibrational (ZPV) energy (the N–H stretching mode, which becomes a translation mode at the saddle geometry, has a ZPV energy of 19 kJ mol−1).
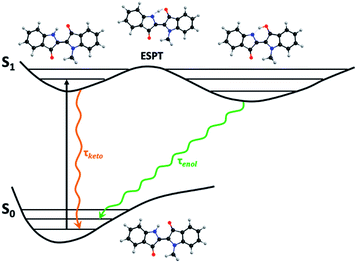 | ||
| Scheme 5 Schematic view of the keto/enol tautomerization occurring through an internal proton transfer. Saddle geometry depicting the 710 cm−1 imaginary frequency mode. | ||
The relevant bond distances and dihedral angles in the ESPT in NC1Ind (Table 3) pertaining to the change in the N–H and C![[double bond, length as m-dash]](https://www.rsc.org/images/entities/char_e001.gif) O bonds in the keto and (via the saddle point) enol forms, and the fact that the system remains almost planar explains the fast ESPT (kESPT = 1.33 × 10¹² s−1) observed.
O bonds in the keto and (via the saddle point) enol forms, and the fact that the system remains almost planar explains the fast ESPT (kESPT = 1.33 × 10¹² s−1) observed.
| Bond distances (pm) and dihedral angles (°) | keto | Saddle point | enol |
|---|---|---|---|
C![[double bond, length as m-dash]](https://www.rsc.org/images/entities/b_char_e001.gif) O (pm) O (pm)
|
123.1 | 128.6 | 131.4 |
| O–H (pm) | 187.0 | 120.7 | 101.7 |
| N–H (pm) | 101.4 | 128.3 | 163.1 |
| N–C–C–C (°) | 2.9 | 1.4 | 2.1 |
| O–C–C–C (°) | 0.5 | 0.8 | 0.7 |
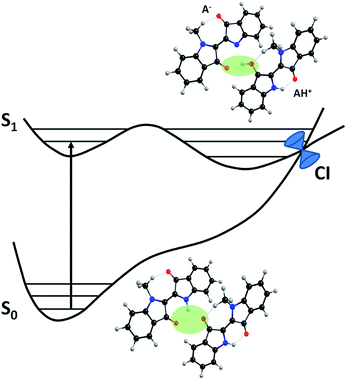
Moreover, after ESPT, rotation around the central C![[double bond, length as m-dash]](https://www.rsc.org/images/entities/char_e001.gif) C bond would provide access to a CI as a channel for deactivation to the ground state (Scheme 4). This mechanism is in fact observed for all systems in polar solvents as well as in NCnInd with alkyl chains longer than or equal to n = 3, failing for the two shortest chain compounds NC1Ind and NC2Ind. With the two shortest members of the series, DFT calculations are compatible with the existence of a dimeric species, as depicted in Scheme 6, which, in MCH, is stable by 40 kJ mol−1 when compared with the two isolated monomers but unstable by 50 kJ mol−1 in THF (the absolute values of stabilization energy should be taken cautiously because they may be hampered by basis set superposition errors). In the gas phase, the localized molecular orbital energy decomposition analysis was used for estimation of basis set superposition errors using the Boys and Bernardi counterpoise method.35 The interaction energy drops from 52 to 33 kJ mol−1. If these results are transposed to MCH (which is a non-polar solvent) by applying a similar scaling factor, the 40 kJ mol−1 stabilization energy would drop to 25 kJ mol−1.
C bond would provide access to a CI as a channel for deactivation to the ground state (Scheme 4). This mechanism is in fact observed for all systems in polar solvents as well as in NCnInd with alkyl chains longer than or equal to n = 3, failing for the two shortest chain compounds NC1Ind and NC2Ind. With the two shortest members of the series, DFT calculations are compatible with the existence of a dimeric species, as depicted in Scheme 6, which, in MCH, is stable by 40 kJ mol−1 when compared with the two isolated monomers but unstable by 50 kJ mol−1 in THF (the absolute values of stabilization energy should be taken cautiously because they may be hampered by basis set superposition errors). In the gas phase, the localized molecular orbital energy decomposition analysis was used for estimation of basis set superposition errors using the Boys and Bernardi counterpoise method.35 The interaction energy drops from 52 to 33 kJ mol−1. If these results are transposed to MCH (which is a non-polar solvent) by applying a similar scaling factor, the 40 kJ mol−1 stabilization energy would drop to 25 kJ mol−1.
The dimeric species may experimentally be pre-formed during the crystal dissolution process or by equilibration from monomers. This process is favorable in non-polar solvents when the polar groups are hidden from the non-polar solvent molecules.
After excitation the dimer becomes unstable towards dismutation (disproportionation), producing the conjugated base (A−) and conjugated acid (AH+) (Scheme 6). This acid/base pair is a CI S0/S1 providing the deactivation channel that regenerates the ground state dimer, without the need for rotation around the central C![[double bond, length as m-dash]](https://www.rsc.org/images/entities/char_e001.gif) C bond. With longer alkyl chains, either by stereochemical hindrance or entropic factors, the formation of the dimers is precluded.
C bond. With longer alkyl chains, either by stereochemical hindrance or entropic factors, the formation of the dimers is precluded.
Experimentally the existence of these dimers could be confirmed by transient absorption since they exhibit a strong peak at 655 nm (see Fig. SI4 in the ESI†) and emission at 673 nm. Unfortunately, these values are close to the ones observed for the monomeric species and cannot be deconvoluted from the experimental values.
Time-resolved femtosecond transient difference absorption (fs-TA) spectra. The time-resolved femtosecond transient difference absorption (fs-TA) spectra for NC1Ind and NC2Ind were recorded in the 450–800 nm range in aerated solutions with solvents of different viscosities and dielectric constants with excitation at 550 nm. The fs-TA data for NC1Ind in 2MeTHF (Table 4 and Fig. SI4†) show that the spectrum is dominated by positive broad transient absorption bands in the 560–700 nm range corresponding to the excited state absorption (ESA), accompanied by a negative feature at longer wavelength (700–800 nm range), which is attributed to stimulated emission (SE). Similar transient difference absorption bands were found for NC1Ind and NC2Ind in the other investigated solvents.
From Table 4 it can be seen that the decay components (τ1 and τ2) of NC1Ind and NC2Ind in 2MeTHF are in good agreement from time resolved measurements, mirroring the presence of the keto and enol forms. As with the ps time resolved data, fs-TA for NC1Ind and NC2Ind in n-dodecane is mono-exponential. In the case of indigo carmine (indigo-5,5′-disulfonic acid disodium salt), Iwakura et al. showed, using a sub 5-fs laser pulse, that in methanol ultrafast single ESPT was essentially completed after 270 fs,36–38 a study that was further recently complemented by Fleming and co-workers showing that in protic solvents intermolecular H-bonds with indigo carmine enable ESPT, generating an unstable intermediate (enol form) that immediately reverts back to the ground state through a CI.33 In the present work, the CI location is almost the conjugated A−/AH+ pair in S1, which is just 0.16 eV above S0.
In our experiments, the time resolution does not allow us to observe the very short proton transfer lifetime, due to the time window limited by the instrument response function (250 fs). The fast lifetime (keto tautomer) could not be observed, but is evidenced (grounded in experimental work and in the TDDFT calculations) to occur in a time scale shorter than this value.
ps-time resolved fluorescence. Fluorescence decays for the N,N′-dialkyl indigo derivatives collected at different emission wavelengths – along the emission band – revealed that in n-dodecane and MCH, with the exception of N,N′C1Ind (where a single-exponential fluorescence decay is observed, Fig. 5A), all of their decays fit to a sum of two exponentials (Table SI7†). Yet, in 2MeTHF the decays are single-exponential (Fig. 5B).
As mentioned, N,N′-substituted indigo derivatives can undergo trans–cis photoisomerization; rotation around the central carbon–carbon bond can lead to the possible formation of conformers with different stabilities in the ground and excited states.39 In the case of N,N′C2Ind to N,N′C18Ind, the observed bi-exponential fluorescence decays (Fig. 5C), together with the observed match between the excitation and absorption spectra (Fig. SI5–SI8†), show that the two components are formed in the excited state.
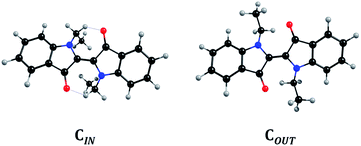
DFT/TDDFT calculations indicate that for N,N′C1Ind only one conformer exists; yet, for longer alkyl chains two different conformers are found to be possible and, depending on the chain conformation, with differences in the energy in the S1 PES that allow us to consider them as independent conformers. Fig. 6 shows the structures, here denoted as CIN and COUT. In the gas phase, CIN and COUT are energetically separated by 0.4 kJ mol−1 which reflects a near 50![[thin space (1/6-em)]](https://www.rsc.org/images/entities/char_2009.gif) :
:![[thin space (1/6-em)]](https://www.rsc.org/images/entities/char_2009.gif) 50 relative abundance. Introducing a solvent field changes the relative stability of the two conformers, which deepens with the solvent polarity. In MCH the energy difference between CIN and COUT rises to 1.3 kJ mol−1, corresponding to a 1
50 relative abundance. Introducing a solvent field changes the relative stability of the two conformers, which deepens with the solvent polarity. In MCH the energy difference between CIN and COUT rises to 1.3 kJ mol−1, corresponding to a 1![[thin space (1/6-em)]](https://www.rsc.org/images/entities/char_2009.gif) :
:![[thin space (1/6-em)]](https://www.rsc.org/images/entities/char_2009.gif) 2 relative abundance, roughly mimicking the trend expected by the analysis of the pre-exponential factors of the two decay components (Table SI7† and Fig. 5C). In THF the energy separation now rises to 3.9 kJ mol−1, which corresponds to an 85% abundance of CIN, making it the only detectable conformer in the time resolved decays (Fig. 5B).
2 relative abundance, roughly mimicking the trend expected by the analysis of the pre-exponential factors of the two decay components (Table SI7† and Fig. 5C). In THF the energy separation now rises to 3.9 kJ mol−1, which corresponds to an 85% abundance of CIN, making it the only detectable conformer in the time resolved decays (Fig. 5B).
Time-resolved femtosecond transient difference absorption (fs-TA) spectra. Time-resolved fs-TA spectra for N,N′C1Ind and N,N′C2Ind in n-dodecane and 2MeTHF were obtained with excitation at 550 nm and recorded in the 450–800 nm range. The fs-TA spectrum of N,N′C1Ind in 2MeTHF (Fig. SI9†) presents positive broad transient absorption bands in the 640–750 nm range with maxima at ∼685 nm that are attributed to the excited singlet state absorption (ESA). In the 570–650 nm range, bleaching of the ground-state absorption (GSA) is observed. Similar transient difference absorption bands were found for N,N′C1Ind and N,N′C2Ind in the other solvent investigated. The best fit results of the characteristic fs-TA data are presented in Table 5.
| Compound | Solvent | fs-TA | TCSPC | ||
|---|---|---|---|---|---|
| τ 1 (ps) | τ 2 (ps) | τ 1 (ps) | τ 2 (ps) | ||
| NC1Ind | n-Dodecane | 2387 | 31.6 | ||
| 2MeTHF | 1.3 | 76.0 | 10.8 | 66.1 | |
| NC2Ind | n-Dodecane | 129.9 | 1078 | 309 | 1064 |
| 2MeTHF | 51.0 | 62.4 | |||
The fs-TA data show that the decay components are, within experimental error, consistent with the decay time values obtained by the ps-TCSPC technique (Table 5). Moreover, the additional (in fs-TA) fast decay component observed for N,N′C1Ind in 2MeTHF (τ1 = 1.3 ps) is consistent with the solvation dynamics reported for this solvent (τ = 0.94 ps).40
Conclusions
A comprehensive study on the excited state behaviour of monosubstituted (NCnInd) and disubstituted (N,N′CnInd) indigo derivatives, with n = 1–18, has been undertaken. Several peculiarities have been found in these systems as a consequence of the solvent polarity, substitution degree and size of the alkyl chain. Excited State Proton Transfer (ESPT) is ultrafast (less than 1 ps) for NC1,2Ind in MCH and n-dodecane, indicating that with short chain length monosubstituted indigo derivatives the ESPT process is ultrafast. The excited state deactivation involves a deactivation mechanism in which after the ESPT takes place in S1, rotation around the central carbon–carbon bond provides access to a CI to the ground state. This is found for all NCnInd derivatives in polar solvents as well as n ≥ 3 in non-polar solvents, except for NC1Ind and NC2Ind.With the disubstituted N,N′C1Ind the decays are single-exponential, corroborating the TDDFT calculation of the presence of a major single conformer, while with the remaining N,N′CnInd (n ≥ 2) derivatives, time-resolved studies (ps fluorescence and fs transient absorption) showed the decays to be bi-exponential, in agreement with the existence of two different conformers (CIN and COUT) in the excited state, which from TDDFT in MCH have an energetic difference of 1.3 kJ mol−1 with a 1![[thin space (1/6-em)]](https://www.rsc.org/images/entities/char_2009.gif) :
:![[thin space (1/6-em)]](https://www.rsc.org/images/entities/char_2009.gif) 2 relative abundance roughly mirrored by the time-resolved fluorescence data. The solvents used showed that with the NCnInd the ESPT is intramolecular, although NC1Ind and NC2Ind DFT calculations are compatible with the existence of a dimer involving the interaction between N–H and C
2 relative abundance roughly mirrored by the time-resolved fluorescence data. The solvents used showed that with the NCnInd the ESPT is intramolecular, although NC1Ind and NC2Ind DFT calculations are compatible with the existence of a dimer involving the interaction between N–H and C![[double bond, length as m-dash]](https://www.rsc.org/images/entities/char_e001.gif) O groups of two different molecules.
O groups of two different molecules.
Experimental
Materials
Indigo (95%) and sodium hydride (60% dispersion in mineral oil stored in a dry box) were obtained from Sigma-Aldrich. The alkyl halides (R–I) were also obtained from commercial sources (Alfa Aesar and Sigma-Aldrich). All reagents used for the synthesis of the compounds were used without further purification. For the synthetic procedures, the solvents were of commercial pro analysis (P.A.) grade. For the spectral and photophysical determinations the solvents used were of spectroscopic or equivalent grade.Equipment and methods
Microwave (MW)-assisted reactions were performed in a CEM Discover S-Class single-mode microwave reactor, featuring continuous temperature, pressure and microwave power monitoring.Analytical thin-layer chromatography (TLC) was performed on Macherey-Nagel ALUGRAM Xtra silica gel plates with a UV254 indicator. Visualization was accomplished by using an ultraviolet lamp. Silica gel column chromatography was carried out with silica gel (230–400 mesh).
Nuclear Magnetic Resonance (NMR) spectra were recorded at room temperature in CDCl3 solutions on a Bruker Avance III spectrometer and a Bruker DRX-400 spectrometer, both operating at 400.13 MHz for 1H and 100.61 MHz for 13C. Chemical shifts for 1H and 13C are expressed in ppm, relative to an internal standard of TMS (tetramethylsilane). Chemical shifts (δ) and coupling constants (J) are indicated in ppm and Hz, respectively.
Gas Chromatography-Mass Spectrometry (GC-MS) analyses were performed on a Hewlett-Packard 5973 MSD spectrometer, using electron ionization (EI) (70 eV), coupled with a Hewlett-Packard Agilent 6890 chromatography system, equipped with an HP-5 MS column (30 m × 0.25 mm × 0.25 μm) and high-purity helium as a carrier gas. The initial temperature of 70 °C was increased to 250 °C at a 15 °C min−1 rate, and held for 10 min. Then the temperature was increased to 290 °C at a 5 °C min−1 rate and held for 2 min, giving a total run time of 32 min. The flow of the carrier gas was maintained at 1.33 mL min−1. The injector port was set at 250 °C.
High Resolution Mass Spectrometry (HRMS) was performed on a Bruker microTOF-Focus mass spectrometer equipped with an electrospray ionization time-of-flight (ESI-TOF) source.
Absorption and fluorescence spectra were recorded on Cary 5000 UV-vis-NIR and Horiba Fluoromax 4 spectrometers, respectively. Fluorescence spectra were corrected for the wavelength response of the system.
The fluorescence quantum yields (ϕF) at room temperature (T = 293 K) for the N-alkyl indigo derivatives in the different solvents were measured using indigo (ϕF = 0.0023) in DMF9 as a standard and the equation below (eqn (2)):
 | (2) |
 is the integrated area under the emission spectra of the compound (cp) solutions and
  is for the reference (ref) solution, ncp2 and nref2 are the refractive indices of the solvents in which the compounds and the reference were respectively dissolved and ϕFref is the fluorescence quantum yield of the standard. The fluorescence quantum yields (ϕF) at T = 293 K for N,N′-dialkyl indigo derivatives in the different solvents were also obtained by the comparative method (eqn (2)) using the fluorescence quantum yields (ϕF) of N-alkyl indigo derivatives in the different solvents as standards.
Fluorescence decays were measured using a home-built picosecond time-correlated single photon counting (ps-TCSPC) apparatus described elsewhere.41 The excitation source consists of a tunable picosecond Spectra-Physics mode-lock Tsunami laser (Ti:sapphire) model 3950 (80 MHz repetition rate, tuning range 700–1000 nm), pumped by a 532 nm continuous wave Spectra-Physics Millennia Pro-10s laser. The excitation wavelength (λexc = 433 nm) was obtained with a Spectra-Physics harmonic generator, model GWU-23PS. Alternatively, a PicoQuant PicoLED model LDH-P-C-450B with wavelength λexc = 451 nm was also used as an excitation source. To eliminate stray light from the light source, an RG530 filter was placed between the sample holder and the emission monochromator. The fluorescence decay curves were deconvoluted using the experimental instrument response function signal collected with a scattering solution (aqueous Ludox solution). The deconvolution procedure was performed using the modulation function method, as implemented by G. Striker in the SAND program, and previously reported in the literature.42
The experimental setup for the ultrafast spectroscopic and kinetics measurements consisted of a broadband (350–1600 nm) HELIOS pump–probe femtosecond transient absorption spectrometer from Ultrafast Systems, pumped by an amplified femtosecond Spectra-Physics Solstice-100F laser (800 nm central wavelength, 128 fs pulse width and 1 kHz repetition rate) and coupled with a Spectra-Physics TOPAS Prime F optical parametric amplifier (195–22![[thin space (1/6-em)]](https://www.rsc.org/images/entities/char_2009.gif) 000 nm tuning range). The probe light in the UV range was generated by passing a small portion of the 800 nm light from the Solstice-100F laser through a computerized optical delay (with a time window of up to 8 ns) and then focusing it on a vertical translating CaF2 crystal to generate a white-light continuum (350–750 nm). All the measurements were obtained in a 2 mm quartz cuvette, with absorptions of ∼0.3 at the pump excitation wavelength. To avoid photodegradation, the solutions were stirred during the experiments or kept in movement with a frequency lower than that of the laser using a motorized translating sample holder. Background signals from impurities or unwanted coherent effects were ruled out by scans of the neat solvent. The spectral chirp of the data was corrected using the Surface Xplorer PRO program from Ultrafast Systems. Global analysis of the data (using a sequential model) was performed using Glotaran software.43
000 nm tuning range). The probe light in the UV range was generated by passing a small portion of the 800 nm light from the Solstice-100F laser through a computerized optical delay (with a time window of up to 8 ns) and then focusing it on a vertical translating CaF2 crystal to generate a white-light continuum (350–750 nm). All the measurements were obtained in a 2 mm quartz cuvette, with absorptions of ∼0.3 at the pump excitation wavelength. To avoid photodegradation, the solutions were stirred during the experiments or kept in movement with a frequency lower than that of the laser using a motorized translating sample holder. Background signals from impurities or unwanted coherent effects were ruled out by scans of the neat solvent. The spectral chirp of the data was corrected using the Surface Xplorer PRO program from Ultrafast Systems. Global analysis of the data (using a sequential model) was performed using Glotaran software.43
Computational details
All theoretical calculations were of the density functional theory (DFT) type, carried out using GAMESS-US version R3.44 A range corrected LC-BPBE (ω = 0.2 au−1) functional, as implemented in GAMESS-US,45 was used in both ground- and excited-state calculations. TDDFT calculations, with similar functionals, were used to probe the excited-state potential energy surface (PES). The solvent was included using the polarizable continuum model with the solvation model density to add corrections for cavitation, dispersion, and solvent structure. In the TDDFT calculation of FC (Franck–Condon) excitations the dielectric constant of the solvent was split into a “bulk” component and a fast component, which is essentially the square of the refractive index.46 Under “adiabatic” conditions only the static dielectric constant is used. A 6-31G** basis set was used in either DFT or TDDFT calculations. Fast probing of Sn Potential Energy Surfaces (PESs), for location of critical points, was carried out using SBKJC ECPs (Stevens–Basch–Krauss–Jasien–Cundari Effective Core Potentials for non-valence electrons with a split-31G for valence electrons),47–49 although when photophysical properties were evaluated the preliminary results were recalculated using the more extensive 6-31G** basis set.Probing of the potential energy surface to locate the conical intersection (CI) was based on the anchor points defined by the trans and cis S1 optimized structures connected to the apex of the isomerization barrier by an IRC (internal reaction coordinate). By using Hessians along this IRC path we identified possible reactive normal modes, parallel to the IRC, that could correspond to the branching space of the CI and, along them, minimized ΔE = E(S1) − E(S0) until a predefined threshold of 0.05 eV (or less) was observed.50,51
Conflicts of interest
The authors declare that there are no conflicts to declare.Acknowledgements
This work was supported by Project “Hylight” (no. 031625) 02/SAICT/2017, PTDC/QUI-QFI/31625/2017, which is funded by the Portuguese Science Foundation and Compete Centro 2020, Project Suprasol (LISBOA-01-0145-FEDER-028365 – PTDC/QUI-QOR/28365/2017), funded by Fundo Europeu de Desenvolvimento Regional (FEDER), through Programa Operacional Regional LISBOA (LISBOA2020), financially supported by project “SunStorage – Harvesting and storage of solar energy”, reference POCI-01-0145-FEDER-016387, funded by FEDER, through COMPETE 2020 – Operational Programme for Competitiveness and Internationalization (OPCI), and by national funds, through Fundação para a Ciência e a Tecnologia (FCT), the Portuguese Agency for Scientific Research. We acknowledge funding by Fundo Europeu de Desenvolvimento Regional (FEDER) through Programa Operacional Factores de Competitividade (COMPETE). The Coimbra Chemistry Centre is supported by the FCT, through Projects UIDB/00313/2020 and UIDP/00313/2020 and CQE is supported by the FCT through project UID/QUI/00100/2019. The FCT is also gratefully acknowledged for a PhD grant to D. Pinheiro (ref. SFRH/BD/74351/2010). D. Pinheiro also acknowledges the project “SunStorage – Harvesting and storage of solar energy” for a research grant.References
- N. Gaboriaud-Kolar, S. Nam and A.-L. Skaltsounis, Progress In The Chemistry of Organic Natural Products, Springer, 2014 Search PubMed.
- J. S. Seixas de Melo, in Photochemistry: Volume 45, The Royal Society of Chemistry, 2018, vol. 45, pp. 68–100 Search PubMed.
- J. S. Seixas de Melo, in Photochemistry, ed. A. Albini and S. Prodi, RSC, London, 2020, vol. 47, pp. 196–216 Search PubMed.
- C. Fang and B. Durbeej, J. Phys. Chem. A, 2019, 123, 8485–8495 CrossRef CAS.
- J. Pina, D. Sarmento, M. Accoto, P. L. Gentili, L. Vaccaro, A. Galvão and J. S. Seixas de Melo, J. Phys. Chem. B, 2017, 121, 2308–2318 CrossRef CAS.
- A. L. Costa, A. C. Gomes, M. Pillinger, I. S. Gonçalves and J. S. Seixas de Melo, Chem.–Eur. J., 2015, 21, 12069–12078 CrossRef CAS.
- G. Cui and W. Thiel, Phys. Chem. Chem. Phys., 2012, 14, 12378–12384 RSC.
- R. Rondão, J. S. Seixas de Melo, F. A. Schaberle and G. Voss, Phys. Chem. Chem. Phys., 2012, 14, 1778–1783 RSC.
- J. S. Seixas de Melo, R. Rondão, H. D. Burrows, M. J. Melo, S. Navaratnam, R. Edge and G. Voss, ChemPhysChem, 2006, 7, 2303–2311 CrossRef CAS.
- S. Yamazaki, A. L. Sobolewski and W. Domcke, Phys. Chem. Chem. Phys., 2011, 13, 1618–1628 RSC.
- J. S. Seixas de Melo, R. Rondão, H. D. Burrows, M. J. Melo, S. Navaratnam, R. Edge and G. Voss, J. Phys. Chem. A, 2006, 110, 13653–13661 CrossRef CAS.
- C. Ma, H. Li, Y. Yang, D. Li and Y. Liu, Chem. Phys. Lett., 2015, 638, 72–77 CrossRef CAS.
- D. Jacquemin, J. Preat, V. Wathelet, M. Fontaine and E. A. Perpète, J. Am. Chem. Soc., 2006, 128, 2072–2083 CrossRef CAS.
- C.-Y. Huang, A. Bonasera, L. Hristov, Y. Garmshausen, B. M. Schmidt, D. Jacquemin and S. Hecht, J. Am. Chem. Soc., 2017, 139, 15205–15211 CrossRef CAS.
- H. Nakagawa, A. Matsumoto, A. Daicho, Y. Ozaki, C. Ota and Y. Nagasawa, J. Photochem. Photobiol., A, 2017, 358, 308–314 CrossRef.
- E. C. Nicholls-Allison, G. Nawn, B. O. Patrick and R. G. Hicks, Chem. Commun., 2015, 51, 12482–12485 RSC.
- J. Pouliquen, V. Wintgens, V. Toscano and J. Kossanyi, Dyes Pigm., 1985, 6, 163–175 CrossRef CAS.
- Y. Omote, S. Imada, R. Matsuzaki, K. Fujiki, T. Nishio and C. Kashima, Bull. Chem. Soc. Jpn., 1979, 52, 3397–3399 CrossRef CAS.
- J. Blanc and D. L. Ross, J. Phys. Chem., 1968, 72, 2817–2824 CrossRef CAS.
- J. Weinstein and G. M. Wyman, J. Am. Chem. Soc., 1956, 78, 4007–4010 CrossRef CAS.
- D. Jacquemin, J. Preat, V. Wathelet and E. A. Perpète, J. Chem. Phys., 2006, 124, 0741041–07410412 Search PubMed.
- E. A. Perpète, J. Preat, J.-M. André and D. Jacquemin, J. Phys. Chem. A, 2006, 110, 5629–5635 CrossRef.
- G. M. Wyman and B. M. Zarnegar, J. Phys. Chem., 1973, 77, 1204–1207 CrossRef CAS.
- G. M. Wyman and B. M. Zarnegar, J. Phys. Chem., 1973, 77, 831–837 CrossRef CAS.
- C. Giuliano, L. Hess and J. Margerum, J. Am. Chem. Soc., 1968, 90, 587–594 CrossRef CAS.
- J.-I. Setsune, J. Synth. Org. Chem., Jpn., 1988, 681–692 CrossRef CAS.
- P. Brandão, D. Pinheiro, J. S. Seixas de Melo and M. Pineiro, Dyes Pigm., 2020, 173, 107935 CrossRef.
- P. Zhou, M. R. Hoffmann, K. Han and G. He, J. Phys. Chem. B, 2015, 119, 2125–2131 CrossRef CAS.
- G.-Y. Li, G.-J. Zhao, Y.-H. Liu, K.-L. Han and G.-Z. He, J. Comput. Chem., 2010, 31, 1759–1765 CrossRef CAS.
- S. Chai, G.-J. Zhao, P. Song, S.-Q. Yang, J.-Y. Liu and K.-L. Han, Phys. Chem. Chem. Phys., 2009, 11, 4385–4390 RSC.
- W. R. Laws and L. Brand, J. Phys. Chem., 1979, 83, 795–802 CrossRef CAS.
- M. J. Melo, J. L. Ferreira, A. J. Parola and J. S. Seixas de Melo, Applied Photochemistry:When Light Meets Molecules, Springer International Publishing, Switzerland, 2016 Search PubMed.
- P. P. Roy, J. Shee, E. A. Arsenault, Y. Yoneda, K. Feuling, M. Head-Gordon and G. R. Fleming, J. Phys. Chem. Lett., 2020, 11, 4156–4162 CrossRef CAS.
- Y. Nagasawa, R. Taguri, H. Matsuda, M. Murakami, M. Ohama, T. Okada and H. Miyasaka, Phys. Chem. Chem. Phys., 2004, 6, 5370–5378 RSC.
- P. Su and H. Li, J. Chem. Phys., 2009, 131, 014102 CrossRef.
- I. Iwakura, A. Yabushita and T. Kobayashi, Bull. Chem. Soc. Jpn., 2011, 84, 164–171 CrossRef CAS.
- I. Iwakura, A. Yabushita and T. Kobayashi, Chem. Phys. Lett., 2010, 484, 354–357 CrossRef CAS.
- I. Iwakura, A. Yabushita and T. Kobayashi, Chem. Lett., 2009, 38, 1020–1021 CrossRef CAS.
- D. C. Nobre, C. Cunha, A. Porciello, F. Valentini, A. Marrocchi, L. Vaccaro, A. M. Galvão and J. S. Seixas de Melo, Dyes Pigm., 2020, 176, 108197 CrossRef CAS.
- M. L. Horng, J. A. Gardecki, A. Papazyan and M. Maroncelli, J. Phys. Chem., 1995, 99, 17311–17337 CrossRef CAS.
- J. Pina, J. S. Seixas de Melo, H. D. Burrows, A. L. Maçanita, F. Galbrecht, T. Bünnagel and U. Scherf, Macromolecules, 2009, 42, 1710–1719 CrossRef CAS.
- G. Striker, V. Subramaniam, C. A. M. Seidel and A. Volkmer, J. Phys. Chem. B, 1999, 103, 8612–8617 CrossRef CAS.
- J. J. Snellenburg, S. Laptenok, R. Seger, K. M. Mullen and I. H. M. Van Stokkum, J. Stat. Softw., 2012, 49, 1–22 Search PubMed.
- M. W. Schmidt, K. K. Baldridge, J. A. Boatz, S. T. Elbert, M. S. Gordon, J. H. Jensen, S. Koseki, N. Matsunaga, K. A. Nguyen, S. Su, T. L. Windus, M. Dupuis and J. A. Montgomery Jr, J. Comput. Chem., 1993, 14, 1347–1363 CrossRef CAS.
- T. Yanai, D. P. Tew and N. C. Handy, Chem. Phys. Lett., 2004, 393, 51–57 CrossRef CAS.
- M. Cossi and V. Barone, J. Chem. Phys., 2001, 115, 4708–4717 CrossRef CAS.
- T. R. Cundari and W. J. Stevens, J. Chem. Phys., 1993, 98, 5555–5565 CrossRef CAS.
- W. J. Stevens, M. Krauss, H. Basch and P. G. Jasien, Can. J. Chem., 1992, 70, 612–630 CrossRef CAS.
- W. J. Stevens, H. Basch and M. Krauss, J. Chem. Phys., 1984, 81, 6026–6033 CrossRef.
- A. M. Galvão, J. Photochem. Photobiol., A, 2014, 289, 66–72 CrossRef.
- B. Dick, Y. Haas and S. Zilberg, Chem. Phys., 2008, 347, 65–77 CrossRef CAS.
Footnote |
| † Electronic supplementary information (ESI) available: Fig. SI1 to SI9 and Tables SI1 to SI7. See DOI: 10.1039/d0sc04958a |
| This journal is © The Royal Society of Chemistry 2021 |

