 Open Access Article
A combined computational and experimental study of methane activation during oxidative coupling of methane (OCM) by surface metal oxide catalysts†
Daniyal
Kiani
 ,
Sagar
Sourav
 ,
Israel E.
Wachs
 * and
Jonas
Baltrusaitis
 *
*
Department of Chemical and Biomolecular Engineering, Lehigh University, B336 Iacocca Hall, 111 Research Drive, Bethlehem, PA 18015, USA. E-mail: job314@lehigh.edu; iew0@lehigh.edu
First published on 5th October 2021
Abstract
The experimentally validated computational models developed herein, for the first time, show that Mn-promotion does not enhance the activity of the surface Na2WO4 catalytic active sites for CH4 heterolytic dissociation during OCM. Contrary to previous understanding, it is demonstrated that Mn-promotion poisons the surface WO4 catalytic active sites resulting in surface WO5 sites with retarded kinetics for C–H scission. On the other hand, dimeric Mn2O5 surface sites, identified and studied via ab initio molecular dynamics and thermodynamics, were found to be more efficient in activating CH4 than the poisoned surface WO5 sites or the original WO4 sites. However, the surface reaction intermediates formed from CH4 activation over the Mn2O5 surface sites are more stable than those formed over the Na2WO4 surface sites. The higher stability of the surface intermediates makes their desorption unfavorable, increasing the likelihood of over-oxidation to COx, in agreement with the experimental findings in the literature on Mn-promoted catalysts. Consequently, the Mn-promoter does not appear to have an essential positive role in synergistically tuning the structure of the Na2WO4 surface sites towards CH4 activation but can yield MnOx surface sites that activate CH4 faster than Na2WO4 surface sites, but unselectively.
1. Introduction
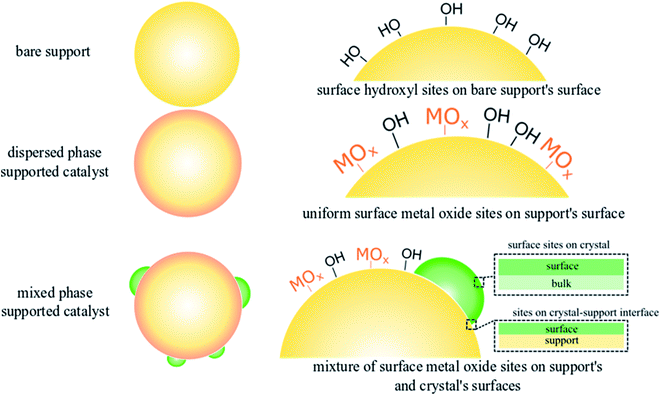
Methane (CH4) the main component of natural gas, is a sustainable energy vector and an emerging building block for synthesis of chemicals and fuels.1–5 Direct CH4 conversion to ethylene (C2H4) via oxidative coupling of methane (OCM) remains an active research frontier with ongoing studies in both catalysis science and reaction engineering.6–9 Despite continued interest, the lack of the fundamental understanding of the structure–function relationships in the state-of-the-art OCM catalysts has prohibited industrial-scale application of OCM.2,10,11 Recent work on selective OCM catalyst development chiefly focuses on the combinatorial screening of multicomponent mixed-phase catalyst systems as well as scrutinizing developed catalyst libraries using data science methods.7,12–14 The structure–activity relationships of any catalyst, however, are the foundation for rational design and optimization of heterogeneous catalysts.15–17 Under typical OCM reaction conditions (CH4 + O2 and high temperatures of up to 850 °C), the catalytic active sites are not mere static geometric forms obtained on calcined supports but undergo dynamic rearrangement dictated by thermodynamics.18,19 Therefore, well-defined catalysts under reaction conditions should be investigated in order to understand the fundamental OCM catalyst structure–activity relationships.Dispersed phase catalysts offer key advantages over catalysts containing a mixture of dispersed and crystalline phases,16,20–23 since dispersed phase catalysts consist of atomically dispersed sites with well-defined molecular and electronic structure that can be tuned via the addition of promoters. Such control of the nature and the structure of catalytic active sites remains challenging in the presence of a crystalline phase in supported mixed phase catalysts, which exhibit an ensemble distribution of the catalytic active sites distributed in the various phases, hence complicating the structure–activity analysis. This difference in dispersed vs. mixed phase catalysts is illustrated in Fig. 1 using silica (SiO2) supported metal oxide (MOx) catalysts, such as those used for OCM, with well-defined active sites found in dispersed phase catalysts allowing systematic analysis for structure–activity relationships, and supported mixed oxide phase catalysts resulting in an variety of various types of sites.
The structure–activity relationships for the state-of-the-art supported Mn–Na2WO4/SiO2 tri-metal oxide OCM catalyst have remained elusive not only due to the demanding reaction conditions, but also due to the mixed-oxide phase nature of this catalyst.24 While dispersed phase tri-metal oxide catalysts, i.e., containing all three metal oxides (W, Na, Mn), have not been studied to date, the structure–activity relationships of active sites in dispersed phase bi-metal oxide catalysts (Na–WOx/SiO2, Mn–WOx/SiO2) for OCM have been recently reported.22,25 It was shown that the distorted surface WO4 sites are present at elevated temperatures (673 K) on the amorphous SiO2 surface in unpromoted, supported WOx/SiO2 catalysts.22 Upon Na-promotion, the extent of distortion of the WO4 surface site diminishes.22,25 The dispersed-phase Na-coordinated WO4 surface sites (Na–WO4) with Na/W molar ratio less than 2 were shown to be significantly more selective to C2 products than the unpromoted, surface WO4 sites and the corresponding mixed-oxide phase catalysts containing crystalline phase Na2WO4 (Na/W ∼ 2).22,25 Moreover, the promotion with Mn i.e Mn–WOx/SiO2, did not have a significant impact on the molecular structure and OCM C2 selectivity of the WO4 surface sites in comparison to unpromoted WO4 surface sites.25 Thus, the role of Mn for the OCM catalytic reaction remains unclear.
Older studies of mixed-phase tri-metal oxide catalysts under/near OCM reaction conditions revealed that Mn3+ reduces to Mn2+ during CH4 activation, which can then be re-oxidized to Mn3+ during the second half of the OCM reaction redox cycle.26 Based on the proposed Mn3+ → Mn2+ → Mn3+ redox cycle, multiple reaction models suggesting Mn sites as the catalytic active site during OCM have been put forth in the literature.26–29 Note that the observed redox cycle, however, was purely based on transitions observed in the crystalline phases of manganese oxide (Mn2O3 and Mn3O4) and the redox behavior of the dispersed phase manganese oxide surface sites (MnOx) in the catalyst are still not known. More recently, an operando synchrotron μ-XRF/XRD/absorption-computed tomography investigation of the mixed-phase tri-metal oxide catalyst found that during phase transformations occurring in the crystalline manganese oxide phases (Mn2O3, Mn7SiO12 and MnWO4), product distribution did not change. Hence, it was concluded that such manganese oxide phases did not have a critical role in the catalytic OCM reaction.30 It was further concluded that dispersed phase MnOx surface sites present on the SiO2 support in the mixed-phase tri-metal oxide catalyst, which bulk X-ray based techniques such as XRD, XAS, XRF cannot effectively monitor, may be involved in the OCM catalytic cycle.30
Herein, we provide the first in silico framework validated with in situ spectroscopy measurements to study the structure–activity relationship of metal oxide sites in model tri-metal oxide OCM catalysts containing Mn, W, Na metal oxides on a SiO2 support. In particular, the nature and structure of the tri-metal oxide surface sites (Mn–Na2WO4/SiO2) was elucidated and contrasted with the bi-metal oxide surface sites (Na2WO4) via ab initio molecular dynamics (AIMD) and periodic density functional theory (DFT). Na2WO4 surface sites are used as the base for this comparison as these surface sites were shown to be the selective active sites for CH4 activation during OCM.19,22,25 The DFT predicted molecular and electronic structures of the dispersed phase surface sites in bi- and tri-metal oxide OCM catalyst prior to CH4 activation were also validated by in situ Raman and in situ UV-Vis diffused reflectance (UV-VisDR) spectroscopies at dehydrated oxidative conditions (400 °C, 10% O2/inert), respectively. Intrinsic kinetics of CH4 dissociation over surface sites in dispersed phase bi-metal oxide and tri-metal oxide case were calculated and contrasted. Results herein provide molecular-level insights on the nature of surface sites, and their activity towards heterolytic CH4 dissociation during OCM, providing structure–function relationships for this OCM catalyst.
2. Experimental
(a) Computational modelling
The periodic calculations have been performed with the Vienna Ab Initio Simulation package (VASP) using the Perdew and Wang (PW91) generalized gradient approximation exchange–correlation functional. PW91 exchange–correlation functional is used as model used herein are adapted from prior models of supported WOx catalysts published in the literature.25,31,32 The valence electrons are treated explicitly and their interactions with the ionic cores are described by the Projector Augmented-Wave method (PAW), which allows using low energy cut off equal to 400 eV for the plane-wave basis. A sampling of the Brillouin zone with 2 × 2 × 1 mesh was applied for all models in this work. The positions of the two top-most layer surface slab atoms, as well as the active (un)coordinated WOx site, in the supercell, were relaxed until the total energy differences decrease below 10−6 eV (forces acting on atoms fall below 0.005 eV Å−1). The details of the model of the hydroxylated β-cristobalite slab can be found elsewhere.25Vibrational modes have been calculated for the selected surface species within the harmonic approximation. Only the tungsten active center and its 1st and 2nd neighbors (O–Si and OH groups) were considered in the Hessian matrix. This matrix was computed by the finite difference method followed by a diagonalization procedure. The eigenvalues of the resulting matrix led to frequency values. The assignment of the vibrational modes was done by inspection of the corresponding eigenvectors. Static (NSW = 0, IBRION = −1) self-consistent calculations were performed to compute DOS (ISMEAR = 0, Sigma = 0.02), and the resulting vasprun.xml files were visualized using P4Vasp33,34 to extract local and total density of states (LDOS, total DOS).
Ab initio molecular dynamics (AIMD) calculations were performed using Anderson thermostat (1700 K, 2 fs steps) to provide sufficient kinetic energy to the simulated catalyst surface for the atoms to rearrange so the global minima for the total energy can be calculated. The antiferromagnetic configuration in dimeric Mn2Ox cases was consistently lower in energy than ferromagnetic configurations, so all dimeric Mn2Ox studied here were treated as antiferromagnetic. Typically, ∼8000 fs AIMD simulations resulted in 3–4 lowest energy structures, which were then extracted and further optimized by periodic DFT before subsequent calculations were conducted for frequencies, Bader35 charges and transition states (from nudged elastic band (NEB)36,37) on the lowest energy structure amongst the 3–4 selected from AIMD. Ab initio thermodynamics (AITD) were calculated according to the framework described in the recent literature.13,38–40 Specifically, the relative stability of various possible surface MnaOb clusters were computed in reference to the bulk α-Mn2O3 phase (unit cell: 32Mn atoms, 48O atoms),41 which is typically reported to be stable under OCM relevant conditions (T = 1000 K, PO2 = 0.33–0.1).42 The Mn2O3 atom positions and cell parameters were relaxed with high precision and cutoff energy of 520 eV to minimize any Pulay stress. Given the unit cell of α-Mn2O3 containing 32Mn and 48O atoms, the general governing stoichiometric equation can be written as (1)
 | (1) |
 | (2) |
In this method, the PV contributions of solids were neglected,13,38–40 and the Gibbs free energies of solids were approximated as their respective electronic energies computed by DFT with thermal corrections in accordance with the methodology described in the literature,43 as shown in eqn (3)
| μ(solid) = EDFT0K(solid) + Gvib(T). | (3) |
The chemical potential of the gas phase O2 depends on the temperature (T) and the corresponding partial pressure (P). At arbitrary T and P, μO2 can then be written as:
 | (4) |
![[thin space (1/6-em)]](https://www.rsc.org/images/entities/char_2009.gif) 325 Pa; P/P° = 1) is the reference pressure. Δμ(T, P°) were taken from JANAF tables.44
325 Pa; P/P° = 1) is the reference pressure. Δμ(T, P°) were taken from JANAF tables.44 was the DFT calculated energy of −9.81 eV and
  value is 0.098 eV.45μO (i.e. ½μO2) values calculated as a function of T and P are tabulated and plotted in Table S1 and Fig. S1,† respectively, and agree with those reported in the literature.46,47 Thus, Gibbs free energy of formation (Gform) for a specific case can be written as eqn (2), where μ(Na2WO4/SiO2), μ(MnaOb + Na2WO4/SiO2), and μ(Mn2O3) are chemical potentials of the solid phases calculated according to eqn (3), while μO is the oxygen chemical potential calculated according to eqn (4).
For example, using the general eqn (1), the Mn1O1–Na2WO4/SiO2 system was calculated as:
 | (5) |
 | (6) |
Using eqn (1), the comprehensive MnaOb chemical potential landscape was computed for various mono-atomic (Mn, MnO, MnO2, MnO3) and di-atomic (Mn2O, Mn2O2, Mn2O3, Mn2O4, Mn2O5 compositions to compare their respective thermodynamic stability given OCM relevant conditions of 1000 K and PO2/P° of 0.1–0.33. A higher degree of oligomerization for surface MnaOb compositions was not considered due to the complexity of the possible structures in tri- and tetra-atomic cases such as straight 2D-chain vs. 3D-clusters.
Lastly, intrinsic rate constant  of C–H dissociation in CH4 was calculated using the DFT-computed E0 values of transition states identified via NEB method, according to equation:
 | (7) |
(b) Non-stoichiometric catalyst synthesis
The SiO2 support (Cabot CAB-O-SIL® EH5 with a surface area of ∼332 m2 g−1) was first treated with water, then allowed to dry overnight at room temperature before final calcination at 500 °C for 4 hours under flowing air. This treatment increases the density and surface hydroxyls of the SiO2 support. The dried SiO2 obtained after calcination was then crushed into a fine powder. The resulting pore volume of the SiO2 powder was determined to be ∼0.8 mL g−1 and was utilized for all catalyst preparation steps via incipient-wetness impregnation (IWI) of the metal oxide aqueous solutions unless mentioned otherwise. A NaOH aqueous solution corresponding to the pore-volume equivalent of ∼0.8 mL g−1 was impregnated onto the SiO2 support and the sample was initially dried overnight, then at 120 °C in an oven under flowing air for 2 hours, and finally calcined at 700 °C under airflow for 2 hours. The resultant supported Na/SiO2 sample, with pore volume equivalent of ∼0.7 mL g−1, was subsequently impregnated with the desired aqueous concentration of W in the form of AMT ((NH4)xW12O28; Alfa Aesar, #44792) and Mn in the form of Mn(NO3)2 (Alfa Aesar, #10806-09). The resultant solid was dried overnight, then at 120 °C for 2 hours in airflow and finally calcined at 500 °C for 4 hours under flowing air. The final catalysts were denoted as 8%W/0.4%Na/SiO2 (Na/W = 0.4)22 in the bi-metal oxide case and 0.5%Mn–8%W/0.4%Na/SiO2 (Na/W = 0.4, Mn/W = 0.2) in the tri-metal oxide case. Samples calcined at 500 °C calcination did not undergo sintering typical of higher temperature calcination, enabling easier characterization of the surface metal oxide sites, which becomes challenging in low surface area sintered materials.(c) In situ Raman spectroscopy
The in situ Raman spectra of the Na coordinated WOx/SiO2 supported catalysts were obtained with Horiba–Jobin Yvon LabRam HR instrument equipped with three laser excitations (532, 442, and 325 nm) and liquid N2-cooled CCD detector (Horiba–Jobin Yvon CCD-3000 V). The 442 nm laser was chosen for spectral accumulation since it minimizes sample fluorescence from the SiO2 supported catalysts. The wavenumber calibration was checked using a standard silicon wafer with a Raman vibration at 520.7 cm−1. A confocal microscope with a 50× objective (Olympus BX-30-LWD) was utilized for focusing the laser on the catalysts. Typically, the spectra were collected for 60 s per scan for a total of three scans with a 1000 μm hole with a spectral resolution of ∼1 cm−1. Approximately 15–20 mg of each catalyst in powder form (100–150 μm size range) was loaded into an environmental cell (Linkam CCR-1000) with a quartz window with O-ring seals, which was kept cool by circulating cooling water. The in situ Raman spectra of the catalysts were collected at 400 °C after dehydration in 10% O2/Ar (∼30 cc min−1) for 60 min to elucidate the initial molecular structure of the representative bi- and tri-metal oxide surface sites to validate the DFT-optimized structures before reaction with CH4.(d) In situ UV-Vis DR spectroscopy
The in situ UV-Vis spectra of the catalysts were obtained using a Varian Cary 5E UV-Vis-NIR spectrophotometer with a Harrick Praying Mantis accessory. Approximately 15–20 mg of each catalyst in powder form was loaded into an in situ Harrick HVCDR2 environmental cell. The UV-Vis spectra of the catalyst samples were collected at 400 °C in the 200–800 nm wavelength range after dehydration (10% O2/Ar, ∼30 cc min−1) for 60 min, using a scan rate of 15 nm min−1 and a signal averaging time of 0.6 s. MgO was used as a standard for obtaining the background absorbance and was subtracted from the sample absorbance. Kubelka–Munk function F(R∞) was calculated from the background-subtracted absorbance data of the UV-Vis spectrum of each sample. The edge energy (Eg), or bandgap, was determined by finding the intercept of the straight line for the low-energy rise of a plot of [F(R∞)hν]2versus hν, where hν is the incident photon energy. The in situ UV-Vis spectra of the catalysts at 400 °C after dehydration in 10% O2/Ar were used to elucidate the initial electronic structure of the representative bi- and tri-metal oxide surface sites to validate the DFT-optimized structures before reaction with CH4.3. Results and discussion
(a) Thermodynamic stability of MnaOb–Na2WO4/SiO2 catalysts under OCM relevant conditions
The Gibbs free energies of formation (ΔG(T, P) further referred to as ΔGform) of MnaOb surface sites in Na2WO4/SiO2 catalysts were computed as a function of oxygen partial pressure according to eqn (2) with respect to the bulk Mn2O3 phase. In an oxygen containing reaction mixture, the surface MnaOb sites are expected to be oxidized depending on the partial pressure of the oxygen. Therefore, as a starting point, ΔGform was computed for four possible mono-atomic Mn1Ob cases Mn, MnO, MnO2, and MnO3, where b is 0, 1, 2 and 3, respectively. As shown in the heat maps in Fig. 2a–d, the redder tones signify positive values of ΔGform and bluer tones signify negative ΔGform. Positive ΔGform imply that formation of that cluster is endergonic with respect to bulk Mn2O3, while negative values imply that the formation of that cluster is exergonic with respect to bulk Mn2O3. Fig. 2a–d show that the formation of isolated Mn, MnO, MnO3 surface sites are clearly endergonic in comparison to bulk Mn2O3 under OCM conditions (∼973–1173 K, PO2/P = 0.20–0.33). However, the isolated MnO2 formation is barely endergonic relative to bulk Mn2O3 under OCM conditions and in fact becomes exergonic at high PO2 and low temperatures. Likewise, five stoichiometries possible considered for the di-atomic Mn2Ob are Mn2O, Mn2O2, Mn2O3, Mn2O4, and Mn2O5 where b is 1, 2, 3, 4, and 5 respectively. The computed ΔGform for each case are shown as heat maps in Fig. 2e–i. At OCM conditions, besides Mn2O5, the formation of di-atomic sites (Mn2O, Mn2O2, Mn2O3, Mn2O4) is endergonic in reference to the bulk Mn2O3 and thus unfavorable. Therefore, under OCM conditions, formation of Mn2O5 sites yielding Mn2O5–Na2WO4/SiO2 catalyst the most thermodynamically favorable from an AITD standpoint.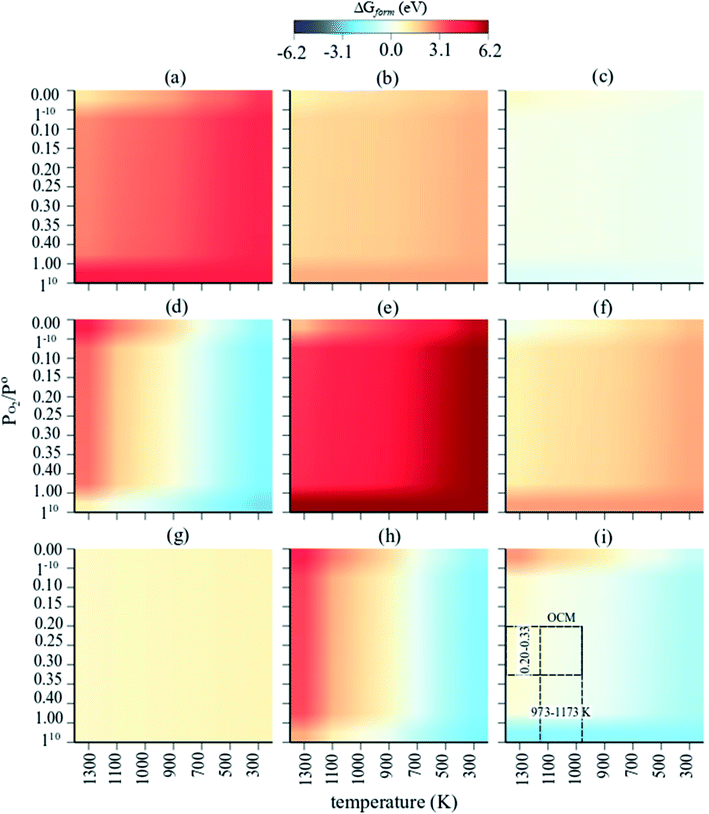 | ||
| Fig. 2 Individual heat maps of computed Gibbs free energy of formation for (MnaOb–Na2WO4)/SiO2 as a function of T (300–1300 K) and PO2/P = 0–1 (ref. 10) for (a) Mn, (b) MnO, (c) MnO2, (d) MnO3, (e) Mn2O, (f) Mn2O2, (g) Mn2O3, (h) Mn2O4, (i) Mn2O5. The dashed rectangle in (i) signifies the OCM relevant conditions. | ||
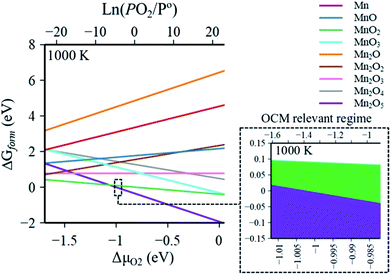
In a comparison shown in Fig. 3, the entire catalyst structure space of MnaOb–Na2WO4/SiO2 was compared to ascertain the most thermodynamically stable stoichiometry of surface MnaOb sites in MnaOb–Na2WO4/SiO2 catalysts under OCM relevant PO2/P° of 0.2–0.33, and temperature of 1000 K. Under these conditions, the formation of Mn2O5 dimeric sites is evidently thermodynamically favorable (i.e. most exergonic) with reference to bulk Mn2O3, especially towards PO2/P° values ∼0.30–0.33 that represent the OCM reaction stoichiometry i.e. CH4![[thin space (1/6-em)]](https://www.rsc.org/images/entities/char_2009.gif) :
:![[thin space (1/6-em)]](https://www.rsc.org/images/entities/char_2009.gif) O2 = 2
O2 = 2![[thin space (1/6-em)]](https://www.rsc.org/images/entities/char_2009.gif) :
:![[thin space (1/6-em)]](https://www.rsc.org/images/entities/char_2009.gif) 1. For instance, as the PO2/P° values increase from 0.25 to 0.35, the ΔGform of Mn2O5 sites decreases from −0.002 eV (−0.20 kJ mol−1) to −0.031 eV (−3.00 kJ mol−1). Note that since the Gibbs energy difference is so small between MnO2 and Mn2O5, a minor presence of MnO2 sites cannot be precluded under OCM conditions in the catalyst. However, for simplicity, the Mn2O5–Na2WO4/SiO2 catalyst was chosen for further study presented in the next sections. Specifically, the molecular and electronic structure of the surface sites in Mn2O5–Na2WO4/SiO2 catalyst are calculated and compared against the base case of unpromoted Na2WO4/SiO2 to ascertain the effect of Mn promotion. The base case i.e. Na2WO4/SiO2 contains Na-coordinated WO4 surface sites that have been shown to be the selective active sites for OCM in such bi-metal oxide catalysts.22,25 Moreover, the molecular and electronic structures of DFT-optimized structures are also validated against experimental in situ characterization data to ensure agreement. Lastly, CH4 activation pathways and intrinsic kinetics are also compared in each case to elucidate the role of surface Mn sites in OCM.
1. For instance, as the PO2/P° values increase from 0.25 to 0.35, the ΔGform of Mn2O5 sites decreases from −0.002 eV (−0.20 kJ mol−1) to −0.031 eV (−3.00 kJ mol−1). Note that since the Gibbs energy difference is so small between MnO2 and Mn2O5, a minor presence of MnO2 sites cannot be precluded under OCM conditions in the catalyst. However, for simplicity, the Mn2O5–Na2WO4/SiO2 catalyst was chosen for further study presented in the next sections. Specifically, the molecular and electronic structure of the surface sites in Mn2O5–Na2WO4/SiO2 catalyst are calculated and compared against the base case of unpromoted Na2WO4/SiO2 to ascertain the effect of Mn promotion. The base case i.e. Na2WO4/SiO2 contains Na-coordinated WO4 surface sites that have been shown to be the selective active sites for OCM in such bi-metal oxide catalysts.22,25 Moreover, the molecular and electronic structures of DFT-optimized structures are also validated against experimental in situ characterization data to ensure agreement. Lastly, CH4 activation pathways and intrinsic kinetics are also compared in each case to elucidate the role of surface Mn sites in OCM.
(b) Molecular structure of surface sites in Na2WO4/SiO2 and Mn2O5–Na2WO4/SiO2
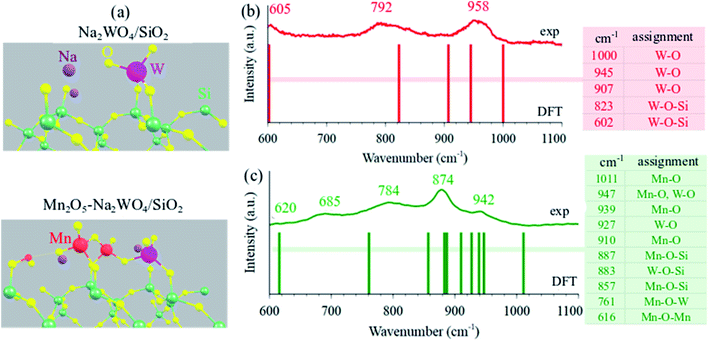
The DFT-optimized molecular structure of surface sites in Na2WO4/SiO2 and Mn2O5–Na2WO4/SiO2 are shown in Fig. 4a. In the case of Na2WO4/SiO2, bi-grafted, dioxo WO4 surface site is present in a distorted Td geometry, in agreement with experimental and computational work previously reported in the literature.22,25 On the other hand, the molecular structure of Mn2O5–Na2WO4/SiO2 contains surface WOx site that changes dramatically in terms of its molecular structure due to interaction with the surface Mn2O5 dimer. In this case, the bi-grafted, di-oxo WOx is coordinated to the adjacent Mn2O5 site via a single W–O–Mn bond, and so can be regarded as WO5. The Mn2O5 is present as a dimer bridged via a single Mn–O–Mn bond with both MnO4 units present as distorted pseudo tetrahedral (Td).Fundamental frequencies for each case were computed and contrasted with experimental in situ Raman spectra of representative dehydrated catalysts to validate the computational model against experimentally observed structures, as shown in Fig. 4b and c. In each case, the computed fundamental modes are assigned in the color-coded tables in Fig. 4b and c and the solid bars are the DFT-calculated frequencies. In both cases, general agreement is observed between computed frequencies and experimentally measured Raman bands, validating the DFT-optimized structural models. From this comparison, it is inferred that W![[double bond, length as m-dash]](https://www.rsc.org/images/entities/char_e001.gif) O bonds are the shortest, given they vibrate in the 945–1000 cm−1 range. Likewise, support-grafting bonds like W–O–Si and Mn–O–Si are significantly longer, given they vibrate in the 800–900 cm−1 range. Lastly, bridging bonds like Mn–O–Mn and Mn–O–W are the longest (weakest), since they vibrate at 616 and 761 cm−1, respectively. It should be noted that we infer a small presence of poorly crystalline nanoclusters/nanoparticles of MnWO4 and Mn-contaminated WO3 in the experimental Raman spectrum of the tri-metal oxide catalyst shown in Fig. 4c, which exhibit Raman bands in the same region as dispersed phase sites. However, since operando/in situ characterization studies in the literature suggest that crystalline MnWO4 is not critical to OCM,29,30 and because the nature (size, shape, surface structure, defect density) of these nanoparticles is not known presently, the nanoparticles have been excluded from this computational model and only the dispersed phase surface sites were studied for structure–function relationships towards CH4 activation. Interested readers are directed to a recent, fully experimental study, where further detailed experimental characterization including UV-VisDRS, Raman at 400 °C, Raman during OCM at 900 °C, TPSR, etc. of several model OCM catalysts including the two catalysts compared in Fig. 4b and c can be found.48
O bonds are the shortest, given they vibrate in the 945–1000 cm−1 range. Likewise, support-grafting bonds like W–O–Si and Mn–O–Si are significantly longer, given they vibrate in the 800–900 cm−1 range. Lastly, bridging bonds like Mn–O–Mn and Mn–O–W are the longest (weakest), since they vibrate at 616 and 761 cm−1, respectively. It should be noted that we infer a small presence of poorly crystalline nanoclusters/nanoparticles of MnWO4 and Mn-contaminated WO3 in the experimental Raman spectrum of the tri-metal oxide catalyst shown in Fig. 4c, which exhibit Raman bands in the same region as dispersed phase sites. However, since operando/in situ characterization studies in the literature suggest that crystalline MnWO4 is not critical to OCM,29,30 and because the nature (size, shape, surface structure, defect density) of these nanoparticles is not known presently, the nanoparticles have been excluded from this computational model and only the dispersed phase surface sites were studied for structure–function relationships towards CH4 activation. Interested readers are directed to a recent, fully experimental study, where further detailed experimental characterization including UV-VisDRS, Raman at 400 °C, Raman during OCM at 900 °C, TPSR, etc. of several model OCM catalysts including the two catalysts compared in Fig. 4b and c can be found.48
(c) Electronic structure of surface sites in Na2WO4/SiO2 and Mn2O5–Na2WO4/SiO2
Next, the electronic structure of the DFT-optimized models is studied. The calculated Bader charges as well as the bond lengths are shown in Fig. 5a and b for Na2WO4/SiO2 and Mn2O5–Na2WO4/SiO2 cases, respectively. In both cases, the W centers have an identical Bader charge of +2.51, which corresponds to an oxidation state of +6 according to the calibration curves shown in Fig. S2,† generated according to literature reported methodology.49 On the other hand, the calculated Bader charges for the two Mn atoms in Mn2O5–Na2WO4/SiO2 catalyst were +1.66 and +1.63, respectively, corresponding to an oxidation state of ∼+3 (Fig. S2†), which agrees well with the literature reported Mn oxidation state of +3 under oxidative conditions (i.e. no CH4 at elevated temperatures).26 Experimental in situ UV-Vis DRS was conducted on two representative samples, namely bi-metal oxide Na–WOx/SiO2 with Na/W = 0.4, and tri-metal oxide Mn–Na–WOx/SiO2 with Na/W = 0.4, Mn/W = 0.5 as shown in Fig. 5d. In both cases, ligand to metal charge transfer energies (∼240 nm or 5.1 eV) indicate that W centers were indeed fully oxidized, i.e. +6, in agreement with the DFT results.22,50,51 The edge energy (Eg), indicative of the degree of polymerization of surface sites was ∼4.2 eV for Na–WOx/SiO2 catalyst, but decreased to 4.0 eV upon Mn-promotion of Na–WOx sites, suggesting Mn-promotion increases polymerization in surface sites. The oxidation state of Mn atoms, on the other hand, cannot be determined from UV-vis DRS as UV-Vis DRS due to the low concentration of Mn in the Mn–Na–WOx/SiO2 representative sample and the lower extinction coefficient of MnOxvs. WOx, the LMCT and d–d bands from Mn centers are masked by the absorbance of W sites.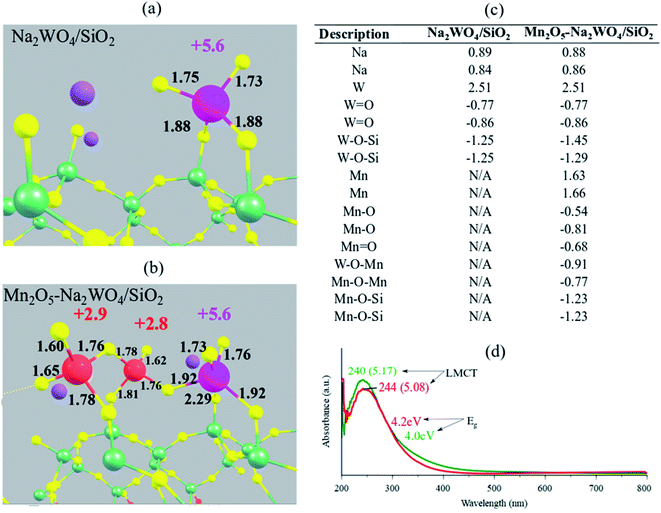 | ||
| Fig. 5 Structural visualization of (a) Na2WO4/SiO2 and (b) Mn2O5–Na2WO4/SiO2 with calculated oxidation states mentioned next to the transition metal atoms in corresponding colors (Mn: red, W: pink). Oxidation states were calculated using a calibrated-fit for Bader charges, shown in Fig. S2 in the ESI section.† Calculated Bader charges for the surface sites in each case are summarized in table (c). (d) In situ dehydrated UV-Vis DRS of Na–WOx/SiO2(red) and Mn–Na–WOx/SiO2(green) catalysts, with Eg values and LMCT positions marked. | ||
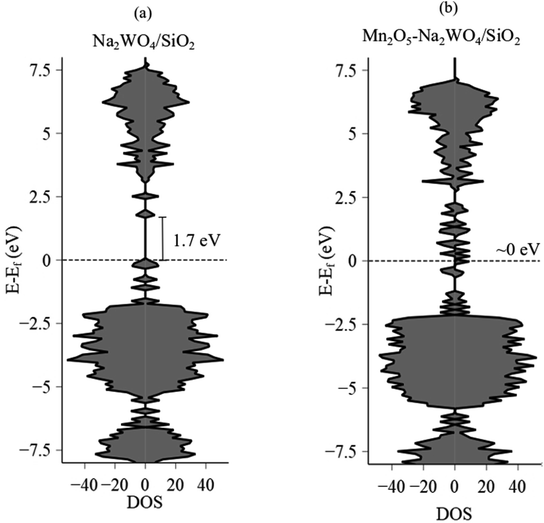
The Eg value after Mn-promotion of Na–WOx sites is lower than the Eg value in the Na–WOx case (Fig. 5d), which can be further understood via density of states (DOS) analysis of DFT-optimized structures. Total DOS plots are shown in Fig. 6a and b for Na2WO4/SiO2 and Mn2O5–Na2WO4/SiO2, respectively. For the Na2WO4/SiO2 case, the valence band is primarily composed of occupied O 2p and W 5d states, while the conductance band of empty W 5d states. The energy gap between the top of the valence edge and the bottom of the conduction edge is ∼1.7 eV. However, in the Mn2O5–Na2WO4/SiO2 case, the valence and conductance bands are primarily composed of Mn 3d states, with some contribution from occupied O 2p states in the valence band. In this case, the lowest part of the conductance band lowers due to low-lying unoccupied Mn 3d states, reducing the bandgap to ∼0 eV. The DOS analysis shows that Mn-addition fundamentally changes the electronic structure of the surface sites by introducing low-lying vacant Mn 3d states above the Fermi level, which will have strong implications for the catalytic CH4 activation. Elsewhere, it has been found that low-lying empty d states in a transition metal like Pt can act an acceptor for σ-donation from the C–H bond of CH4 and lead to facile C–H scission.52 Thus, it suffices to conclude at this point that experimental in situ UV-Vis DRS and computational DOS analysis are in qualitative agreement evidencing that Mn-promotion of Na2WO4 surface sites will lower the Eg values due to the introduction of low-lying empty Mn 3d states above the Fermi level, that Mn is present in its +3 oxidation state, and that W is present in its fully oxidized +6 state.
(d) Reaction kinetics of CH4 dissociation over Mn2O5–Na2WO4/SiO2vs. Na2WO4/SiO2
AITD analysis identified Mn2O5–Na2WO4 as the most stable species under OCM relevant temperature and oxygen partial pressure. Therefore, the intrinsic activity of Na2WO4/SiO2vs. Mn2O5–Na2WO4/SiO2 surface sites for CH4 dissociation were studied, where the C–H bond dissociation is the most kinetically relevant elementary step in the OCM mechanism.19,53 To enhance readability and comprehension, the various possible reaction pathways for heterolytic C–H scission of CH4 are grouped based on the type of surface intermediate formed in the forward step. Specifically,| CH4 + MOx → M–O–CH3 (methoxy) + M–OH (hydroxy) | (8) |
| CH4 + MOx → M–O–CH3 + M–H (hydride) | (9) |
| CH4 + MOx → M–CH3 (methyl) + M–OH | (10) |
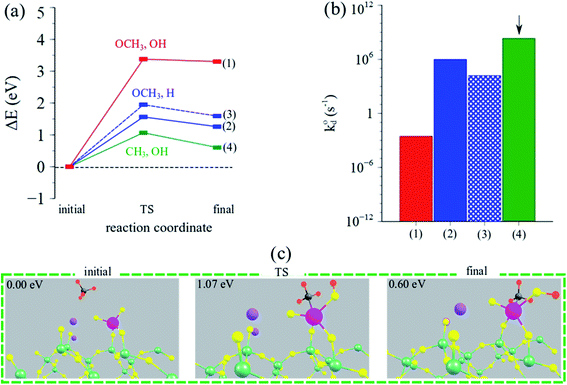 | ||
| Fig. 7 (a) Reaction coordinate vs. ΔEDFT (eV) and (b) calculated intrinsic rate constants (log-scale) for CH4 dissociation for the three possible pathways over the Na2WO4/SiO2 catalyst. Arrow indicates the dominant (fastest) pathway. (c) Structural depictions of the initial, TS and final states during CH4 dissociation over Na2WO4/SiO2 catalysts yielding methyl-hydroxy (CH3, OH) intermediates. Pictorial summary for other pathways can be found in Table S3.† | ||
CH4 dissociation over Na2WO4 surface sites was studied as a function of the possible pathways listed above, and as a function of various active oxygen atoms. The results are summarized in Fig. 7a–c, highlighting the activation barriers associated with various possible pathways over the Na2WO4/SiO2 catalyst. According to the computed energy barriers summarized in Fig. 7a, the highest energy barrier was for the pathway yielding OCH3, OH surface intermediates (3.4 eV), indicating that CH4 dissociation turnover frequency for this pathway will be lower than other pathways with smaller transition state barriers. The two pathways with OCH3, H intermediates formation differ in terms of the oxygen atom of the WO4 where C–H scission occurs, and consequently have slightly varying TS barriers (1.6, 1.9 eV). Lastly, the pathway yielding CH3, OH surface intermediates exhibited the lowest energy barrier of 1.1 eV, suggesting that this is the dominant reaction pathway for CH4 dissociation over Na-coordinated WO4 surface sites in the Na2WO4/SiO2 catalysts. The resulting intrinsic rate constants, calculated according to eqn (7) are plotted in Fig. 7b, suggesting that the intrinsic rate constant for the CH3, OH pathway is 2–3 orders of magnitude higher than other pathways making this the dominant pathway. Lastly, the initial, transition state (TS) and final structures for CH4 activation over Na2WO4 surface sites via the dominant reaction pathway are shown in Fig. 7c, showing the formation of W–CH3 and W–O–H intermediates. Importantly, these results show that Na2WO4 surface sites can effectively dissociate CH4 in the absence of Mn-promoter in agreement with a recently published report,22 as opposed to Lunsford19 reaction model where Na–O–Mn sites are assumed to be the critical active sites for CH4 dissociation.
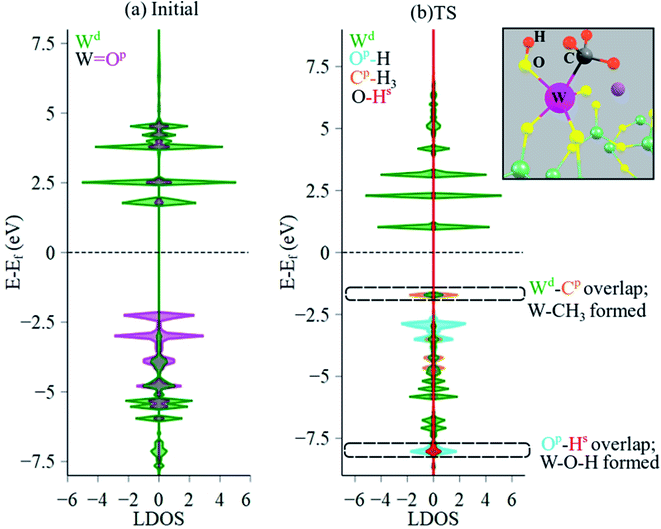
Local DOS (LDOS) analysis was conducted to elucidate the changes in electronic structure of initial versus the TS structure during CH4 dissociation over the Na2WO4 surface sites. LDOS for W 5d states and O 2p states of the initial Na2WO4 structure are shown in Fig. 8a. The valence band (below the Fermi level, EF) is comprised largely of occupied 2p states from the double-bonded oxygen i.e. W![[double bond, length as m-dash]](https://www.rsc.org/images/entities/char_e001.gif) O, while the conductance band is comprised largely of unoccupied W 5d states with a minor contribution from unoccupied O 2p states of W
O, while the conductance band is comprised largely of unoccupied W 5d states with a minor contribution from unoccupied O 2p states of W![[double bond, length as m-dash]](https://www.rsc.org/images/entities/char_e001.gif) O. Upon CH4 dissociation, the lowest part of the conductance band lowers in energy as the unoccupied O 2p states get filled. Moreover, significant overlap of occupied states is observed for W 5d and C 2p states near the top of the valence edge at ca. −1.7 eV, signifying W–C bond formation as in the W–CH3 surface intermediate. Lastly, occupied H 1s states and occupied O 2p states also overlap in the lower part of the valence edge, confirming O–H bond formation i.e. W–O–H intermediate. The Bader charge for W barely decreases; it changes from +2.51 in initial structure to +2.48 in the TS structure, indicating minimal reduction of the W center. The partial reduction of W center instead of a full reduction to +5 or to +4 might be the reason that reduced W centers could not be observed during OCM in SQUID-EPR experimentally.26 Interestingly, a similar CH4 dissociation pathway yielding CH3, OH surface intermediates was also proposed for La2O3-based catalysts, where La–CH3 and La–O–H intermediates formed upon heterolytic dissociation of CH4.54 Likewise, CH4 dissociation over Al2O3 was also shown to proceed via Al–CH3 and Al–O–H formation.55
O. Upon CH4 dissociation, the lowest part of the conductance band lowers in energy as the unoccupied O 2p states get filled. Moreover, significant overlap of occupied states is observed for W 5d and C 2p states near the top of the valence edge at ca. −1.7 eV, signifying W–C bond formation as in the W–CH3 surface intermediate. Lastly, occupied H 1s states and occupied O 2p states also overlap in the lower part of the valence edge, confirming O–H bond formation i.e. W–O–H intermediate. The Bader charge for W barely decreases; it changes from +2.51 in initial structure to +2.48 in the TS structure, indicating minimal reduction of the W center. The partial reduction of W center instead of a full reduction to +5 or to +4 might be the reason that reduced W centers could not be observed during OCM in SQUID-EPR experimentally.26 Interestingly, a similar CH4 dissociation pathway yielding CH3, OH surface intermediates was also proposed for La2O3-based catalysts, where La–CH3 and La–O–H intermediates formed upon heterolytic dissociation of CH4.54 Likewise, CH4 dissociation over Al2O3 was also shown to proceed via Al–CH3 and Al–O–H formation.55
Next, intrinsic kinetics of CH4 dissociation over Mn2O5–Na2WO4/SiO2 catalyst were studied to ascertain if CH4 still dissociated over the WOx like it did in the case of Na2WO4/SiO2 catalyst. Once again, the color-coded pathways signify the unique surface intermediates produced. In this case however, CH4 dissociation was studied as a function of the moiety since three distinct moieties are present in the surface site i.e. WO5 moiety, W–O–Mn moiety, and Mn2O5 moiety. The motivation behind studying CH4 dissociation as a function of moieties is and to ascertain the affect of Mn2O5 promotion on the reaction pathway and intrinsic kinetics. If, CH4 dissociates preferentially over the Mn2O5 moiety, it would indicate that the effect of Mn-promotion in OCM catalysts is not to tune the WOx surface site but in fact to generate a second active site altogether. On the other hand, if it still activates over WO5 moiety, the role of Mn2O5 would be inferred as a structural/chemical promoter.
As shown in Fig. 9a, CH4 dissociation becomes energetically unfavorable over the WO5 moiety i.e. 2–4 eV TS barriers, in stark contrast to facile CH4 dissociation observed over WO4 site in Na2WO4/SiO2 without Mn2O5 promotion (1.1 eV). The higher TS barriers in the case of WO5 moiety in Mn2O5–Na2WO4/SiO2 catalyst in comparison to the pseudo-Td WO4 moiety in Na2WO4/SiO2 catalyst are likely due to the loss of Td geometry of the WOx center upon Mn2O5 promotion, where the Td WO4 serves as a reaction site. The Td geometry of the WO4 is often regarded as a critical requirement of the selective active site in OCM in various experimental studies,19,22,25,56–60 and that notion finds support from the DFT results herein.
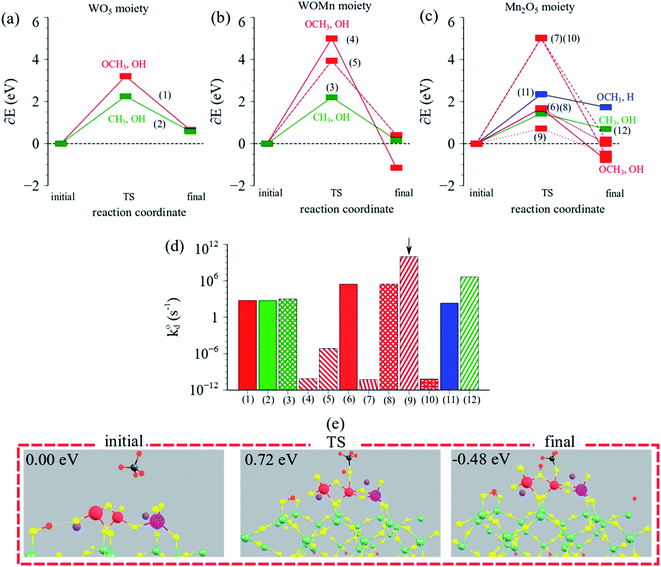 | ||
| Fig. 9 Reaction coordinate vs. ΔEDFT (eV) over (a) WO5 moiety, (b) W–O–Mn moiety, (c) Mn2O5 moiety in Mn2O5–Na2WO4/SiO2 catalyst. (d) Calculated intrinsic rate constants (log-scale) for CH4 dissociation for the possible pathways in Mn2O5–Na2WO4/SiO2 catalyst. Arrow indicates the dominant (lowest barrier) pathway. All numbered pathways 1–9 are described in ESI Table S4.† (e) Visualization of the dominant (lowest barrier) pathway for CH4 dissociation over the Mn2O5–Na2WO4/SiO2 catalyst, yielding methoxy–hydroxy (OCH3, OH) surface intermediates. | ||
On the other hand, CH4 can also dissociate over the W–O–Mn and Mn2O5 moieties via various pathways with TS barriers in the 1–5 eV range, shown in Fig. 9b and c. Overall, however, the lowest barrier pathway was the one yielding methoxy–hydroxy (OCH3, OH) intermediates, over the Mn2O5 moiety, with a TS barrier of 0.72 eV, which is 0.3 eV lower than the lowest TS barrier pathway for CH4 activation over Na2WO4/SiO2 in the absence of Mn-promoter. Fig. 9d compares the calculated intrinsic rate constants for CH4 dissociation across all moieties via various pathways studied, showing that the lowest TS barrier pathway indeed exhibits a rate constant orders of magnitude higher than other cases and hence is the dominant pathway. Lastly, initial, TS, and final structures for the dominant reaction pathway in this case are summarized in Fig. 9e, evidencing the involvement of Mn–O and Mn–O–Mn bonds in CH4 dissociation to yield Mn–O–CH3 and (Mn)2–O–H surface intermediates.
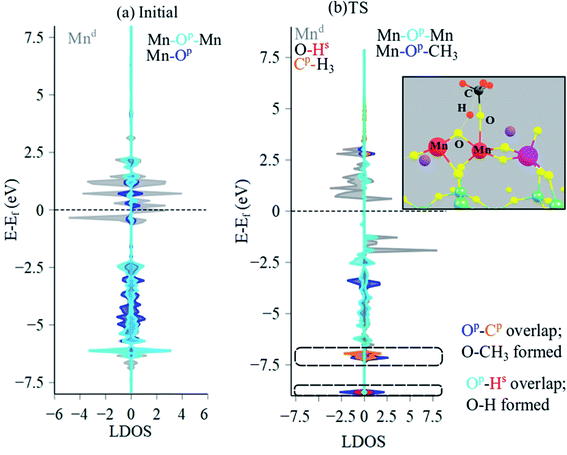
To ascertain the electronic structural dynamics of the surface sites during CH4 dissociation, LDOS analysis (Mn 3d, O 2p, C 2p, H 1s states) was conducted for the initial and TS structures of Mn2O5–Na2WO4/SiO2, shown in Fig. 10a and b, respectively. Initially, the valence edge is comprised of a mixture of occupied Mn 3d states and O 2p states from Mn–O–Mn and Mn–O bonds. The conductance edge is primarily made up of unoccupied Mn 3d states with some contribution from empty O 2p states. Upon CH4 dissociation and TS formation, the LDOS changes drastically. The upper part of the valence band lowers in energy, and occupied, spin-up Mn 3d states appear at −2.0 eV, which were not present in the initial structure. Moreover, overlapping O 2p and C 2p states as well as the O 2p and H 1s states confirm formation of Mn–O–CH3 and (Mn)2–O–H intermediates. In this case, the occupied C 2p states overlap with occupied O 2p states of Mn–O towards the bottom of the valence edge (−7.0 eV). Lastly, Mn Bader charge decreases from +1.63 to +1.55 from initial to TS structure, indicating reduction of the Mn centers from ∼+3 to ∼+2 in agreement with experimental literature.26,61
(e) C–H bond activation over surface metal oxide sites
The results presented so far point out that heterolytic dissociation of CH4 can occur over surface sites, either WO4 or Mn2O5, via the Mars–van Krevelen (MvK) mechanism (i.e., involvement of lattice oxygen instead of adsorbed O2, as inferred from general agreement between TS barriers estimated herein and apparent activation barriers reported in the broader OCM literature in the 100–150 kJ mol−1 range.19 The dissociation of CH4 over pseudo-Td WO4 sites in Na2WO4/SiO2 catalyst is found to be kinetically slower than that on Mn2O5 moiety in Mn2O5–Na2WO4/SiO2 catalyst, given that the value for C–H scission in CH4 over Mn2O5 sites is 3 orders of magnitude higher than over the surface Na2WO4 sites (Fig. 11). However, the formation of surface intermediates in the case of CH4 dissociation over Na2WO4 surface sites, namely W–CH3 and W–O–H is endothermic by 0.60 eV. On the other hand, the formation of surface intermediates due to CH4 dissociation over Mn2O5 moiety in Mn2O5–Na2WO4/SiO2, namely Mn–O–CH3 and Mn–O–H, is appreciably exothermic by −0.48 eV. The occupied C 2p states of the CH3 fragment in Mn–O–CH3 are more stabilized (i.e., lower in energy) when bound to Mn–O (−7.0 eV) vs. when bound to W as in W–CH3 (−1.7 eV), as shown in Fig. 8 and 10, which explains the enhanced stability of intermediates formed over Mn2O5. The higher stability of intermediates formed over Mn2O5 moiety increases their likelihood of staying adsorbed and further oxidizing to the unselective COx products instead of desorbing as methyl radicals into the gas-phase to form C2 products.62 It is known that the selectivity towards C2 products in OCM relies on the thermodynamics of adsorption of the methyl fragment (ion or radical) on the catalyst, which can lead to further oxidation to CO or CO2.63 Therefore, the energy of the adsorbed CH3 fragment effectively describes the selectivity to C2 hydrocarbons during the OCM process. Current results can be extrapolated to hypothesize slower kinetics of CH4 dissociation, but higher C2 selectivity for CH4 dissociation over Na2WO4 sites in Na2WO4/SiO2 catalysts in comparison to CH4 dissociation over Mn2O5 sites in Mn2O5–Na2WO4/SiO2. In agreement with the present hypothesis, experimental results evidence higher CH4 conversion, but lower C2 selectivity for Mn–Na2WO4/SiO2 (CH4 conversion 36%, C2 selectivity 54%) vs. Na2WO4/SiO2 (CH4 conversion 15%, C2 selectivity 62%) catalysts in OCM.64 A recent temporal analysis of products (TAP) reactor study of crystalline phase Mn–Na2WO4/SiO2 catalysts further elucidated that the Na2WO4/SiO2 catalyst (without Mn-oxide) possesses two distinct kinds of oxygen species at 800 °C: (i) a dissolved molecular O2 type species only released from the molten Na2WO4 phase and (ii) an atomic lattice O type species associated with surface Na–WO4 sites that can be removed by reduction with CH4.65 Both these oxygen species are catalytically active for the OCM reaction. On the other hand, the 1.2Mn/SiO2 catalyst (without Na2WO4) only provides molecular O2 type species associated with the Mn-oxide phase, and no atomic O type species. The O2 species associated with the Mn-oxide phase were found to highly unselective toward C2 product formation from CH4 activation.65 It would be interesting to conduct a similar TAP reactor study on model catalysts in the absence of crystalline oxide phases with only dispersed surface sites present to compare how such dispersed sites function versus the respective crystalline oxide phase.
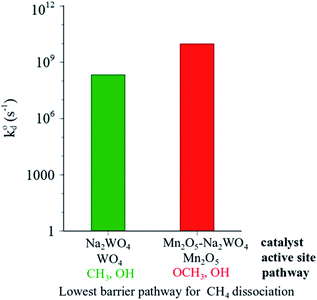 | ||
| Fig. 11 Comparison of calculated intrinsic rate constants for dominant (lowest barrier) pathways for CH4 dissociation over the Na2WO4/SiO2 (green) and Mn2O5–Na2WO4/SiO2 (red) catalysts. | ||
The faster intrinsic kinetics of heterolytic CH4 dissociation over the Mn2O5 sites versus the Na2WO4 surface sites are not surprising. In fact, DFT calculations have been used to correlate the C–H bond activation energy to the surface reducibility (oxygen vacancy formation energy, work function) in the literature.63 A linear correlation was found between the C–H activation energy and the oxygen vacancy formation energy of pure/doped metal-oxides, making surface reducibility a descriptor for predicting catalyst activity and selectivity for CH4 dissociation in OCM.63 Given that Mn-oxides are more reducible than W-oxides, the CH4 dissociation over surface Mn2O5 sites is expected to be faster than Na2WO4. Moreover, according to this correlation between C–H activation barrier and reducibility of the surface metal oxide site, one of the roles of Na-promotion is to increase the reducibility of surface WOx sites, as evidenced by lowering of peak temperature values during H2-TPR with Na-addition, reported in a recent study on Na–WOx/SiO2 model catalysts.22
It is known that MnOx-based catalysts form excellent partial and total oxidation catalysts owing to their enhanced reducibility. Examples of Mn-oxide based catalysts used for oxidation reactions include: Mn2O3 for complete oxidation of methane,61 Mn-oxide–CeO2 catalysts for formaldehyde oxidation,66 Spinel CoMn2O4 for toluene oxidation,67 mesoporous Mn-oxide catalysts for water oxidation,68 alkane oxidation over Mn-perovskites,69 CeO2-supported Mn-oxide for propane oxidation,70 In fact, analogous to the CH4 dissociation pathway over Mn2O5 moiety envisioned in the present study, operando FTIR spectroscopy elsewhere71 confirmed the formation of Mn–OH surface species by abstraction of hydrogen atoms by nucleophilic oxygen atoms (Mn–O–Mn) from propane during propane oxidation, providing support for the DFT modelling results and chemical insights presented herein.
Recent state-of-the-art understanding regarding the role of Mn- and Na-promoters in Mn2O3–Na2WO4/SiO2 OCM catalysts puts chemical insights provided in the present work in perspective. Specifically, it was recently shown via experimental CH4 + O2 temperature-programmed-surface-reaction of well-defined single site catalysts that Na2WO4 surface sites could effectively and selectively activate CH4 in absence of any Mn-promoter to form C2 products, making the role of Mn-promoter unclear.22 Further evidence of the dispersed phase Na–WO4 surface sites being the critical OCM active sites was provided in recent experimental studies48,72 where temporal analysis of products (TAP) reactor studies in conjunction with steady-state OCM reaction studies of Na2WO4/SiO2 catalysts (without Mn-oxide) demonstrated that the dispersed surface Na–WO4 sites were responsible for selectively activating CH4 to yield C2 and CO products, while molten Na2WO4 phase was found to be mainly responsible for the over-oxidation of CH4 to CO2, and oxidative dehydrogenation of C2H6 to C2H4.72 Likewise, Mn-containing phases including MnOx surface oligomers, MnWO4 and Mn–WO3 nanoparticles in Mn–Na–WOx/SiO2 tri-metal oxide model OCM catalyst were found to be primarily spectating during OCM under differential reaction conditions and when such Mn phases are present in small populations.48 An older model study had previously shown that Na-coordinated WO4 surface sites were more selective but slightly less active than Mn-coordinated WOx and uncoordinated WOx sites during OCM in a series of model bi-metal oxide OCM catalysts.25 Lastly, via operando synchrotron μ-XRF/XRD/absorption-computed tomography, it was shown that crystalline manganese oxide phases including Mn2O3, Mn7SiO12 and MnWO4 are not required components to yield an active catalyst,6 while no conclusion could be reached regarding the dispersed phase MnaOb surface sites that can be present on the SiO2.30
The current study, utilizing in situ spectroscopy, ab initio molecular dynamics, ab initio thermodynamics, and periodic-DFT modelling bridges the knowledge gap present in the literature and provides the following critical mechanistic insights, which suggest that Mn-promotion in fact is likely not essential for a yielding a selective-active OCM catalyst:
(1) CH4 heterolytically dissociates effectively over the Na2WO4 surface sites in absence of Mn-promoter, with a TS barrier of 1.07 eV forming W–CH3 and W–O–H surface intermediates. The surface intermediate formation is endothermic by 0.60 eV, indicative of their instability and likelihood of facile desorption.
(2) CH4 heterolytically dissociates over the WO5 moiety significantly slower when the Mn2O5–Na2WO4/SiO2 catalyst is studied due to structural changes incurred upon Mn2O5 coordination to the WO4 site forming the WO5. This shows that Mn-promotion can infact poison the otherwise pseudo-Td WO4 surface active sites, retarding the kinetics of CH4 dissociation over them.
(3) CH4 dissociates over the Mn2O5 moiety with a TS barrier of 0.72 eV forming Mn–O–CH3 and (Mn)2–O–H surface intermediates. The surface intermediates formation is appreciably exothermic (−0.48 eV), indicative of the high stability of the formed intermediates.
(4) The significantly higher stability of surface intermediates formed when CH4 dissociates over the Mn2O5 moiety in Mn2O5–Na2WO4/SiO2 catalyst versus the intermediates formed upon CH4 dissociation over the Na2WO4/SiO2 signifies the likelihood of the Mn–O–CH3, (Mn)2–O–H surface intermediates over-oxidizing to COx, in agreement with the higher CH4 conversion but lower C2 selectivity reported in the OCM literature for MnOx/SiO2 catalysts.64 Therefore, the selective-active sites for OCM are the Na-coordinated WO4 surface sites present in Na2WO4/SiO2 catalysts without Mn-promotion. Mn promotion can create a second set of Mn-based surface sites (like the surface Mn2O5 sites) that are more active for CH4 dissociation than the WO4-based sites, but less selective to C2 products due to the unfavorable desorption of the reaction intermediates formed over Mn2O5.
(5) Computational results herein also suggest that CH4 activation via the MvK mechanism where the oxygen species involved in the reaction originate in the solid phase catalytic active site is quite possible. The DFT-calculated intrinsic barriers of the MvK type reaction pathways are in general agreement with the experimental apparent activation energy values reported in the literature, providing qualitative support for the possibility of the MvK mechanism prevailing during catalytic OCM. However, we note that only the heterolytic CH4 activation pathway is studied herein and the homolytic CH4 activation pathway over these surface sites will be addressed in a future study. Literature studies have shown that both heterolytic and homolytic activation of CH4 occurs during OCM, where both pathways yield CH3 radicals in the gas-phase.73,74 Typically, homolytic pathways exhibit higher energy barriers than the heterolytic pathway55 due to the stabilization of the CH3 fragment from surface interactions in the heterolytic pathway.
4. Conclusions
The study herein utilized in situ spectroscopy, AIMD, AITD, and periodic-DFT to provide unprecedented chemical insights regarding CH4 activation over Na2WO4/SiO2versus Mn–Na2WO4/SiO2 catalysts. We report, for the first time, that Mn-promotion is not essential to tune the pseudo-Td WO4 surface sites known to be active for OCM. Contrary to previous understanding, we show that Mn-promotion poisons the pseudo-Td Na2WO4 surface site, with the resulting surface WO5 site exhibiting retarded kinetics for CH4 activation. With Mn-promotion, however, new Mn-based surface sites (Mn2O5 in this study) form that can activate CH4 faster than the WO4-based surface sites. The surface intermediates formed during CH4 dissociation over the Mn2O5 sites (Mn–O–CH3, (Mn)2–OH) are more stable than those formed via CH4 dissociation over the Na2WO4 site (W–CH3, W–O–H), and prone to over-oxidation to COx due to the unfavorable desorption. Considering these insights that agree with recent state-of-the-art in situ and operando characterization studies, it is proposed that the addition of MnOx does not promote the pseudo-Td, Na-coordinated WO4 sites where CH4 activates selectively (i.e., essential selective active sites for OCM). The Mn-promotion likely creates a second set of active MnOx surface sites that are more active for CH4 activation, but less C2 selective than the Na–WO4 surface sites. These findings contradict Lunsford's OCM model, where the Na–O–Mn sites are hypothesized to be critically involved in the redox mechanism during OCM.75 The results herein also do not completely agree with Li's OCM model, as W6+ is barely seen to reduce during CH4 dissociation step, while Li proposed that W reduces from +6 to +5/+4 during the CH4 dissociation step, and Mn2O3 provides electron-coupled oxygen-spillover to re-oxidize the reduced W sites back to +6 oxidation state.76 Lastly, note that the findings herein do not account for the crystalline nanoclusters/nanoparticles (<2–3 nm) of MnWO4 or Mn-contaminated WO3 which are present in the tri-metal oxide model catalyst studied herein. The exact nature of these nanoclusters/nanoparticles is not understood presently and they can only be modelled accurately to generate structure–function relationships for OCM when their size, shape, surface composition, vacancy/defect density, etc. are well-characterized. It suffices to note here that crystalline MnWO4, even when present, does not contribute significantly to OCM.29,30Future investigations on the role of surface MnOx sites during CH4 activation in well-defined catalysts should include CH4 + O2 temperature-programmed surface reaction, steady state performance tests, isotope-switch experiments in temporal analysis of products (TAP) reactor, and computational analysis of the homolytic pathway for CH4 activation over the catalyst models generated in this study.
Data availability
Relevant data is present in the ESI file.†Author contributions
DK and JB conducted all theoretical work. DK and SS conducted spectroscopy experiments. DK, JB, and IEW wrote the manuscript. All authors have agreed to the publication of this manuscript.Conflicts of interest
The authors declare no competing interests.Acknowledgements
This work is supported by NSF CBET 1706581. DK also gratefully acknowledges John C. Chen endowed fellowship for financial support. This work used the Extreme Science and Engineering Discovery Environment (XSEDE) (Comet cluster), which is supported by National Science Foundation grant number ACI-1548562, under allocation ID TG-CTS150038 with XSEDE.77References
- X. Li, J. Xie, H. Rao, C. Wang and J. Tang, Angew. Chem., Int. Ed., 2020, 59, 19702–19707 CrossRef CAS PubMed.
- A. M. Arinaga, M. C. Ziegelski and T. J. Marks, Angew. Chem., Int. Ed., 2021, 60, 10502 CrossRef CAS PubMed.
- V. Paunović, G. Zichittella, M. Moser, A. P. Amrute and J. Pérez-Ramírez, Nat. Chem., 2016, 8, 803–809 CrossRef PubMed.
- M. Moser, L. Rodríguez-García, A. P. Amrute and J. Pérez-Ramírez, ChemCatChem, 2013, 5, 3520–3523 CrossRef CAS.
- A. Caballero and P. J. Perez, Chem. Soc. Rev., 2013, 42, 8809–8820 RSC.
- M.-S. Salehi, M. Askarishahi, H. R. Godini, O. Görke and G. Wozny, Ind. Eng. Chem. Res., 2016, 55, 3287–3299 CrossRef CAS.
- T. N. Nguyen, T. T. P. Nhat, K. Takimoto, A. Thakur, S. Nishimura, J. Ohyama, I. Miyazato, L. Takahashi, J. Fujima, K. Takahashi and T. Taniike, ACS Catal., 2020, 10, 921–932 CrossRef CAS.
- Z. Cheng, D. S. Baser, S. G. Nadgouda, L. Qin, J. A. Fan and L.-S. Fan, ACS Energy Lett., 2018, 3, 1730–1736 CrossRef CAS.
- S. Parishan, P. Littlewood, A. Arinchtein, V. Fleischer and R. Schomäcker, Catal. Today, 2018, 311, 40–47 CrossRef CAS.
- A. L. Tonkovich, R. W. Carr and R. Aris, Science, 1993, 262, 221 CrossRef CAS PubMed.
- X. Guo, G. Fang, G. Li, H. Ma, H. Fan, L. Yu, C. Ma, X. Wu, D. Deng, M. Wei, D. Tan, R. Si, S. Zhang, J. Li, L. Sun, Z. Tang, X. Pan and X. Bao, Science, 2014, 344, 616–619 CrossRef CAS PubMed.
- K. Takahashi, L. Takahashi, T. N. Nguyen, A. Thakur and T. Taniike, J. Phys. Chem. Lett., 2020, 11, 6819–6826 CrossRef CAS PubMed.
- L. Grajciar, C. J. Heard, A. A. Bondarenko, M. V. Polynski, J. Meeprasert, E. A. Pidko and P. Nachtigall, Chem. Soc. Rev., 2018, 47, 8307–8348 RSC.
- P. Schlexer Lamoureux, K. T. Winther, J. A. Garrido Torres, V. Streibel, M. Zhao, M. Bajdich, F. Abild-Pedersen and T. Bligaard, ChemCatChem, 2019, 11, 3581–3601 CrossRef CAS.
- J. A. Labinger, Science, 1995, 269, 1833 CrossRef CAS PubMed.
- D. Kiani, S. Sourav, Y. Tang, J. Baltrusaitis and I. E. Wachs, Chem. Soc. Rev., 2021, 50, 1251–1268 RSC.
- D. Kiani, G. Belletti, P. Quaino, F. Tielens and J. Baltrusaitis, J. Phys. Chem. C, 2018, 122, 24190–24201 CrossRef CAS.
- R. K. Grasselli and A. W. Sleight, in Studies in Surface Science and Catalysis, ed. R. K. Grasselli and A. W. Sleight, Elsevier, 1991, vol. 67, p. ix Search PubMed.
- D. Kiani, S. Sourav, J. Baltrusaitis and I. E. Wachs, ACS Catal., 2019, 9, 5912–5928 CrossRef CAS.
- Z. Li, S. Ji, Y. Liu, X. Cao, S. Tian, Y. Chen, Z. Niu and Y. Li, Chem. Rev., 2020, 120, 623–682 CrossRef CAS PubMed.
- L. Zhang, M. Zhou, A. Wang and T. Zhang, Chem. Rev., 2020, 120, 683–733 CrossRef CAS PubMed.
- D. Kiani, S. Sourav, I. E. Wachs and J. Baltrusaitis, Catal. Sci. Technol., 2020, 10, 3334–3345 RSC.
- I. E. Wachs and K. Routray, ACS Catal., 2012, 2, 1235–1246 CrossRef CAS.
- S. Arndt, T. Otremba, U. Simon, M. Yildiz, H. Schubert and R. Schomäcker, Appl. Catal., A, 2012, 425–426, 53–61 CrossRef CAS.
- D. Kiani, S. Sourav, W. Taifan, M. Calatayud, F. Tielens, I. E. Wachs, J. Baltrusaitis, I. E. Wachs and J. Baltrusaitis, ACS Catal., 2020, 10, 4580–4592 CrossRef CAS.
- W. Riedel, L. Thum, J. Möser, V. Fleischer, U. Simon, K. Siemensmeyer, A. Schnegg, R. Schomäcker, T. Risse and K.-P. Dinse, J. Phys. Chem. C, 2018, 122, 22605–22614 CrossRef CAS.
- W. Pengwei, Z. Guofeng, Y. Wang, L. Yong, P. Wang, G. Zhao, Y. Wang and Y. Lu, Sci. Adv., 2017, 3, 1–10 Search PubMed.
- P. Wang, G. Zhao, Y. Liu and Y. Lu, Appl. Catal., A, 2017, 544, 77–83 CrossRef CAS.
- M. J. Werny, Y. Wang, F. Girgsdies, R. Schlögl and A. Trunschke, Angew. Chem., Int. Ed., 2020, 59, 14921 CrossRef CAS PubMed.
- A. Vamvakeros, D. Matras, S. D. M. Jacques, M. di Michiel, S. W. T. Price, P. Senecal, M. A. Aran, V. Middelkoop, G. B. G. Stenning, J. F. W. Mosselmans, I. Z. Ismagilov and A. M. Beale, J. Catal., 2020, 386, 39–52 CrossRef CAS.
- H. Guesmi, R. Grybos, J. Handzlik and F. Tielens, RSC Adv., 2016, 6, 39424–39432 RSC.
- K. Kurleto, F. Tielens and J. Handzlik, J. Phys. Chem. C, 2020, 124(5), 3002–3013 CrossRef CAS.
- M. Lahti, A. Chaudhuri, K. Pussi, D. Hesp, I. M. McLeod, V. R. Dhanak, M. O. King, M. Kadodwala and D. A. MacLaren, Surf. Sci., 2014, 622, 35–43 CrossRef CAS.
- http://www.p4vasp.at/, 2021.
- M. Yu and D. R. Trinkle, J. Chem. Phys., 2011, 134, 064111 CrossRef PubMed.
- G. Henkelman, B. P. Uberuaga and H. Jónsson, J. Chem. Phys., 2000, 113, 9901–9904 CrossRef CAS.
- G. Henkelman and H. Jónsson, J. Chem. Phys., 2000, 113, 9978–9985 CrossRef CAS.
- G. Li, P. Vassilev, M. Sanchez-Sanchez, J. A. Lercher, E. J. M. Hensen and E. A. Pidko, J. Catal., 2016, 338, 305–312 CrossRef CAS.
- N. Kosinov, A. S. G. Wijpkema, E. Uslamin, R. Rohling, F. J. A. G. Coumans, B. Mezari, A. Parastaev, A. S. Poryvaev, M. V. Fedin, E. A. Pidko and E. J. M. Hensen, Angew. Chem., 2018, 130, 1028–1032 CrossRef.
- G. Li, I. Vollmer, C. Liu, J. Gascon and E. A. Pidko, ACS Catal., 2019, 9, 8731–8737 CrossRef CAS.
- The Materials Project, Materials Data on Mn2O3 by Materials Project, United States, 2014, DOI:10.17188/1272415.
- Y.-B. Kang and I.-H. Jung, Metall. Mater. Trans. E, 2016, 3, 156–170 CAS.
- W. E. W. E. Taifan, T. Bučko and J. Baltrusaitis, J. Catal., 2017, 346, 78–91 CrossRef CAS.
- M. W. Chase Jr, NIST-JANAF thermochemical tables, American Chemical Society, American Institute of Physics for the National Institute of Standards and Technology, Washington, DC, New York, 4th edn, 1998 Search PubMed.
- K. K. Irikura, J. Phys. Chem. Ref. Data, 2007, 36, 389–397 CrossRef CAS.
- K. Reuter and M. Scheffler, Phys. Rev. B, 2001, 65, 035406 CrossRef.
- R. Jutta and K. Reuter, Max-Planck-Gesellschaft Zur Foerderung Der Wissenschaften ev Berlin (GERMANY FR), Fritz-Haber-INST, 2006 Search PubMed.
- D. Kiani, S. Sourav, J. Baltrusaitis and I. E. Wachs, ACS Catal., 2021, 11, 10131–10137 CrossRef CAS.
- F. Yang, J. Graciani, J. Evans, P. Liu, J. Hrbek, J. F. Sanz and J. A. Rodriguez, J. Am. Chem. Soc., 2011, 133, 3444–3451 CrossRef CAS PubMed.
- E. I. Ross-medgaarden and I. E. Wachs, J. Phys. Chem. C, 2007, 111, 15089–15099 CrossRef CAS.
- S. Lwin, Y. Li, A. I. Frenkel and I. E. Wachs, ACS Catal., 2016, 6, 3061–3071 CrossRef CAS.
- Q. Wan, V. Fung, S. Lin, Z. Wu and D.-e. Jiang, J. Mater. Chem. A, 2020, 8, 4362–4368 RSC.
- K. Takanabe and E. Iglesia, J. Phys. Chem. C, 2009, 113, 10131–10145 CrossRef CAS.
- Z. Liu, J. P. Ho Li, E. Vovk, Y. Zhu, S. Li, S. Wang, A. P. van Bavel and Y. Yang, ACS Catal., 2018, 8, 11761–11772 CrossRef CAS.
- M. C. Cholewinski, M. Dixit and G. Mpourmpakis, ACS Omega, 2018, 3, 18242–18250 CrossRef CAS PubMed.
- J. Wu, S. Li, J. Niu and X. Fang, Appl. Catal., A, 1995, 124, 9–18 CrossRef CAS.
- S.-f. Ji, T.-c. Xiao, S. S.-B. B. Li, C.-z. Xu, R.-l. Hou, K. S. Coleman, M. L. H. Green, J. Wu, S. S.-B. B. Li, Z. C. Jiang, C. J. Yu, X. P. Fang, S. S.-B. B. Li, H. L. Wang, J. Wu, S. S.-B. B. Li, J. Niu, X. P. Fang, D. J. Wang, M. P. Rosynek, J. H. Lunsford, S. S.-B. B. Li, A. Palermo, J. Pedro, H. Vazquez and R. M. Lambert, Appl. Catal., A, 1995, 68, 191–196 Search PubMed.
- J. Wu and S. Li, J. Phys. Chem., 1995, 99, 4566–4568 CrossRef CAS.
- S. Ji, T. Xiao, S. Li, L. Chou, B. Zhang, C. Xu, R. Hou, A. P. E. E. York and M. L. H. H. Green, J. Catal., 2003, 220, 47–56 CrossRef CAS.
- S. Li, J. Nat. Gas Chem., 2003, 12, 1–9 Search PubMed.
- Y.-F. Han, K. Ramesh, L. Chen, E. Widjaja, S. Chilukoti and F. Chen, J. Phys. Chem. C, 2007, 111, 2830–2833 CrossRef CAS.
- M. J. Capitan, J. A. Odriozola, A. Marquez and J. F. Sanz, J. Catal., 1995, 156, 273–278 CrossRef CAS.
- G. Kumar, S. L. J. Lau, M. D. Krcha and M. J. Janik, ACS Catal., 2016, 6, 1812–1821 CrossRef CAS.
- S. Hou, Y. Cao, W. Xiong, H. Liu and Y. Kou, Ind. Eng. Chem. Res., 2006, 45, 7077–7083 CrossRef CAS.
- S. Sourav, Y. Wang, D. Kiani, J. Baltrusaitis, R. R. Fushimi and I. E. Wachs, ACS Catal., 2021, 11, 10288–10293 CrossRef CAS.
- J. Quiroz, J.-M. Giraudon, A. Gervasini, C. Dujardin, C. Lancelot, M. Trentesaux and J.-F. Lamonier, ACS Catal., 2015, 5, 2260–2269 CrossRef CAS.
- C. Dong, Z. Qu, Y. Qin, Q. Fu, H. Sun and X. Duan, ACS Catal., 2019, 9, 6698–6710 CrossRef CAS.
- C.-H. Kuo, I. M. Mosa, A. S. Poyraz, S. Biswas, A. M. El-Sawy, W. Song, Z. Luo, S.-Y. Chen, J. F. Rusling, J. He and S. L. Suib, ACS Catal., 2015, 5, 1693–1699 CrossRef CAS.
- G. Koch, M. Hävecker, D. Teschner, S. J. Carey, Y. Wang, P. Kube, W. Hetaba, T. Lunkenbein, G. Auffermann, O. Timpe, F. Rosowski, R. Schlögl and A. Trunschke, ACS Catal., 2020, 10, 7007–7020 CrossRef CAS.
- H. Wang, H. Zhou, S. Li, X. Ge, L. Wang, Z. Jin, C. Wang, J. Ma, X. Chu, X. Meng, W. Zhang and F.-S. Xiao, ACS Catal., 2020, 10, 10559–10569 CrossRef CAS.
- X. Li, D. Teschner, V. Streibel, T. Lunkenbein, L. Masliuk, T. Fu, Y. Wang, T. Jones, F. Seitz, F. Girgsdies, F. Rosowski, R. Schlögl and A. Trunschke, Chem. Sci., 2019, 10, 2429–2443 RSC.
- S. Sourav, Y. Wang, D. Kiani, J. Baltrusaitis, R. R. Fushimi and I. E. Wachs, Angew. Chem., Int. Ed., 2021, 60, 21502 CrossRef CAS PubMed.
- J. H. Lunsford, Angew. Chem., Int. Ed. Engl., 1995, 34, 970–980 CrossRef CAS.
- D. Dissanayake, J. H. Lunsford and M. P. Rosynek, J. Catal., 1994, 146, 613–615 CrossRef CAS.
- D. J. Wang, M. P. Rosynek and J. H. Lunsford, J. Catal., 1995, 155, 390–402 CrossRef CAS.
- S. Li, J. Nat. Gas Chem., 2003, 12, 1–9 Search PubMed.
- J. Towns, T. Cockerill, M. Dahan, I. Foster, K. Gaither, A. Grimshaw, V. Hazlewood, S. Lathrop, D. Lifka, G. D. Peterson, R. Roskies, J. R. Scott and N. Wilkins-Diehr, Comput. Sci. Eng., 2014, 16, 62–74 Search PubMed.
Footnote |
| † Electronic supplementary information (ESI) available. See DOI: 10.1039/d1sc02174e |
| This journal is © The Royal Society of Chemistry 2021 |

