 Open Access Article
The excited-state dynamics of the radical anions of cyanoanthracenes†
Joseph S.
Beckwith‡
 ,
Alexander
Aster§
and
Eric
Vauthey
 *
*
Department of Physical Chemistry, University of Geneva, 30 Quai Ernest-Ansermet, CH-1211 Geneva 4, Switzerland. E-mail: eric.vauthey@unige.ch
First published on 2nd December 2021
Abstract
The radical anion of 9,10-dicyanoanthracene (DCA) has been suggested to be a promising chromophore for photoredox chemistry, due to its nanosecond excited-state lifetime determined from indirect measurements. Here, we investigate the excited-state dynamics of the radical anion of three cyanoanthracenes, including DCA˙−, produced by photoinduced electron transfer in liquid using both pump–probe and pump–pump probe transient electronic absorption spectroscopy. All three excited radical ions are characterised by a 3–5 ps lifetime, due to efficient non-radiative deactivation to the ground state. The decay pathway most probably involves D1/D0 conical intersection(s), whose presence is favoured by the enhanced flexibility of the radical anions relative to their neutral counterparts. The origin of the discrepancy with the nanosecond lifetime of DCA˙−* reported previously is discussed. These very short lifetimes limit, but do not preclude, photochemical applications of the cyanoanthracene anions.
1 Introduction
Over the past few decades, open-shell ions in an electronic excited state have been drawing increasing attention in various areas of molecular sciences. Synthetic chemists have realised the enhanced chemical reactivity gained upon photoexcitation of radical ions, allowing for the reduction or oxidation of almost electrochemically inert compounds.1–7 In astrochemistry, fluorescence from radical cations of aromatic hydrocarbons has been suggested to be at the origin of emissive diffuse interstellar bands.8–11 In photoredox chemistry, the observation that bimolecular electron transfer (ET) between two neutral reactants is diffusion controlled even at driving forces at which Marcus inverted region is predicted, was explained by the formation of the ion-pair product in an electronic excited state.12–15Despite the relevance of photoexcited open-shell ions, not much is known about their dynamics. A large fraction of the radical cations investigated so far in liquids were found to have a very short excited-state lifetime, <50 ps.4,16–26 This was explained by the presence of easily accessible conical intersections between D1, the lowest electronic excited state, and D0, the ground state.25,27–30 By contrast, nanosecond excited-state lifetimes were reported for several radical anions in liquids.31–34 However, these lifetimes were either deduced from indirect measurements or obtained from time-resolved fluorescence experiments, which are more sensitive to the presence of impurities and follow-up reaction products. To the best of our knowledge, the longest unambiguous excited-state lifetime determined so far amounts to 530 ps and was measured with the radical anion of a perylene monoimide derivative produced electrochemically.35 However, most radical anions investigated until now in liquids have a significantly shorter excited-state lifetime.35–39
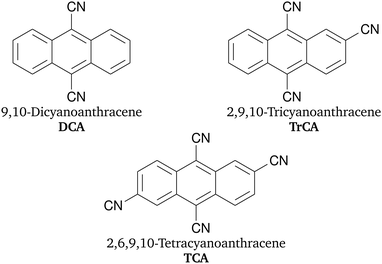
We report here on our investigation of the excited-state dynamics of the radical anion of three cyanoanthracenes (Fig. 1) in liquids using electronic transient absorption (TA) spectroscopy. These compounds were selected for their widespread use as electron-accepting chromophores in bimolecular ET studies.40–47 Combined with a strong electron donor, such as tetramethylphenylenediamine (TMPD), high ET driving forces, at which Marcus inverted region is expected,48 can be achieved. As the ET fluorescence quenching of these cyanoanthracenes by TMPD was found to be diffusion limited,45 it could possibly involve the electronic excited states of the ensuing radical ions. The radical cation of TMPD has been shown to have an excited-state lifetime between 200 and 300 fs.25 Consequently, the cyanoanthracene radical anions might be better candidates for the detection of excited ionic product in a bimolecular ET process.
The radical anion of DCA produced electrochemically was initially reported to fluoresce in the 500–600 nm region with a 13.5 ns lifetime.32,49 This emission was later on shown to be due to a follow-up reaction product.50 A 4 ns excited-state lifetime was then deduced from bimolecular quenching measurements of DCA˙−* generated upon pulse radiolysis and subsequent photoexcitation with a 5 ns laser pulse.33 However, observation from our group that the photoexcitation of DCA˙− produced upon bimolecular ET does not affect the free ion yield, suggests a significantly shorter excited-state lifetime.17
Here, stable solutions of DCA˙−, TrCA˙− and TCA˙− in acetonitrile were generated via a photoinduced ET reaction coupled with a scavenger counterion. Additionally, DCA˙− and TrCA˙− were also produced transiently upon photoinduced ET without a scavenger, and their excited-state dynamics were investigated using pump–pump–probe (PPP) TA.
The results presented here reveal unambiguously that the excited-state dynamics of all three radical anions is ultrafast, limiting their use in two-photon redox chemistry and complicating their detection in highly exergonic ET reactions.
2 Experimental
2.1 Samples
9,10-Dicyanoanthracene (DCA) was purchased from Kodak and recrystallised before use. 2,9,10-Tricyanoanthracene (TrCA) and 2,6,9,10-tetracyanoanthracene (TCA) were synthesised as described previously.51 All measurements were performed in acetonitrile (ACN) (Roth, Rotidry, ≥99.9%), except one that was carried out in N,N-dimethylformamide (DMF, Sigma-Aldrich, puriss.).The radical anions were generated upon photoinduced ET between the cyanoanthracenes and triethylamine (TEA, Fluka) in the presence of tetra-n-butylammonium dihydrogen phosphate (TBADHP, Alfa Aesar) in ACN (Section S1, ESI†).52 TEA was distilled before use and kept under argon. The principle of this procedure, whilst not fully established,52 appears to rest on the stabilisation of the radical anion via association with a large organic salt (i.e. TBADHP). The radical anions of DCA and TrCA were also generated upon ET quenching with either 1,2,6-trimethylbenzene (TMB, Fluka, puriss.) or mesitylene (MES, Fluka, puriss.) in ACN or DMF.
2.2 Transient absorption spectroscopy
Transient absorption (TA) measurements were performed with a setup described in ref. 53 and based on an amplified Ti:Sapphire system (Solstice Ace, Spectra-Physics), producing 35 fs pulses centred at 800 nm with a 5 kHz repetition rate (Section S2, ESI†). In brief, the pump pulses were produced by a TOPAS-Prime combined with a NirUVis module (Light Conversion), and were compressed to 60–100 fs at the sample position. The pump intensity on the sample was ∼0.15–0.75 mJ cm−2. Probing was achieved from about 320 to 750 nm using white light pulses generated in a 3 mm CaF2 plate. The polarisation of the pump pulses was at magic angle with respect to that of the probe pulses. The sample cell was 1 mm thick and the instrument response function had a full width at half maximum varying between 80 and 350 fs, depending on the probe wavelength.The principle of the pump–pump–probe (PPP) experiment used for investigating the excited-state dynamics of DCA˙− is described in ref. 54. The setup was the same as that used for the TA measurement except for the use of a first pump pulse at 400 nm, produced by frequency doubling part of the output pulses of the Ti:Sapphire amplifier. This actinic pulse was used to excite DCA and trigger the ET between DCA* and an electron donor. Further details can be found in ref. 54.
2.3 Quantum-chemical calculations
All calculations were carried out at the density functional theory (DFT) or time-dependent (TD) DFT level in the gas phase, using both the long-range corrected hybrid CAM-B3LYP functional55 with the augmented cc-pVDZ basis set and the B3LYP functional56 with the 6-31+G* basis set, as implemented in the Gaussian16 (Rev. B) software.57 Both approaches gave qualitatively similar results.3 Results
3.1 Stationary spectroscopy
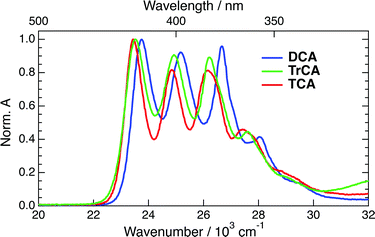
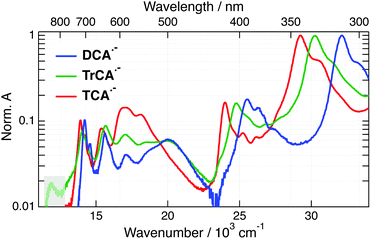
The absorption spectra of DCA, TrCA and TCA in ACN are shown in Fig. 2.Upon addition of TEA + TBADHP and irradiation at 405 nm, the absorption bands of the anions appear in the electronic spectrum. Fig. 3 shows the absorption spectra of all three anions obtained after about 1 h irradiation and after subtraction of the residual absorption band of the neutrals. The absorption spectra of DCA˙− and TCA˙− coincide with those published previously.33,58,59 The similarity of the spectrum obtained with TrCA to the DCA˙− and TCA˙− spectra gives good confidence that it originates from TrCA˙−. The minor feature at 12![[thin space (1/6-em)]](https://www.rsc.org/images/entities/char_2009.gif) 000 cm−1 is attributed to an artefact as its amplitude relative to the other bands is not constant during irradiation (Section S3, ESI†).
000 cm−1 is attributed to an artefact as its amplitude relative to the other bands is not constant during irradiation (Section S3, ESI†).
The absorption spectra of the three radical ions present a similar shape, with all bands shifting to lower energy upon increasing the number of cyano groups. For DCA˙−, a molar absorption coefficient of 8.1 × 10³ M−1 cm−1 at 14![[thin space (1/6-em)]](https://www.rsc.org/images/entities/char_2009.gif) 100 cm−1 (705 nm) was reported.58,60 Given the similarity in the shapes the radical anion spectra, the molar absorption coefficients at the peaks around 14
100 cm−1 (705 nm) was reported.58,60 Given the similarity in the shapes the radical anion spectra, the molar absorption coefficients at the peaks around 14![[thin space (1/6-em)]](https://www.rsc.org/images/entities/char_2009.gif) 000 cm−1 should not differ very significantly for TrCA˙− and TCA˙−. This coefficient corresponds to a transition dipole moment of ∼1.7 D and an oscillator strength of 0.02 (Section S3, ESI†).
000 cm−1 should not differ very significantly for TrCA˙− and TCA˙−. This coefficient corresponds to a transition dipole moment of ∼1.7 D and an oscillator strength of 0.02 (Section S3, ESI†).
The lowest energy absorption predicted from TD-DFT calculations is around 2 eV (620 nm) for all three anions with an oscillator strength between 0.02 and 0.06 (Section S4†). This absorption corresponds to the D1 ← D0 transition for DCA˙− and TrCA˙−, and to the D2 ← D0 transition for TCA˙−. For the latter, the calculated D1 ← D0 transition has no oscillator strength and its energy is less than 0.1 eV below D2 ← D0. In the case of DCA˙−, a forbidden D2 ← D0 transition less than 0.2 eV above D1 ← D0 is predicted. For TrCA˙−, this second transition is also close to D1 ← D0 but is allowed. This difference can be explained by the lower symmetry of TrCA˙−, i.e. the lack of a centre of inversion, compared to DCA˙− and TCA˙−, in agreement with the Laporte rules.61,62 As illustrated in Fig. S3 (ESI†), these calculated transitions are in reasonably good agreement with the experiment.
3.2 Transient absorption spectroscopy
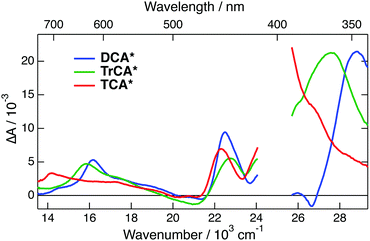
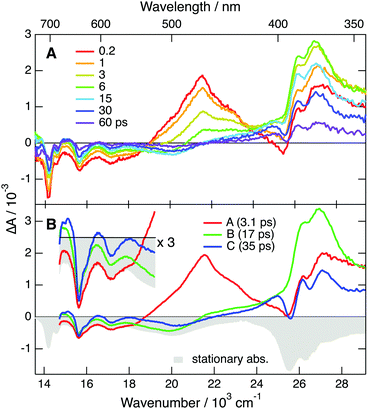
TA spectra measured 10 ps after 400 nm excitation of all three neutrals in ACN are shown in Fig. 4. The transient spectra of the cyanoanthracenes are relatively similar and consist mainly of three excited-state absorption bands. The stimulated S1 → S0 emission appears as a weak negative band around 475 nm, and the bleach of the S1 ← S0 absorption is only visible around 380 nm with DCA. The relative weakness of the bleach points to a large absorption coefficient of the overlapping ESA band. These TA data were analysed globally assuming a series of successive exponential steps with increasing time constants.63,64 The resulting evolution-associated difference absorption spectra (EADS) and the corresponding time constants are shown in Fig. S6 (ESI†). Apart from minor spectral shifts during the first 20 ps, which can be assigned to vibrational/solvent relaxation, the dynamics are dominated by the nanosecond decay of the excited-state population.
In principle, this band could also arise from a follow-up species produced upon reaction between DCA˙−* with TEA or TBADHP. As shown in Fig. S8 (ESI†), the excited-state dynamics of DCA˙− is independent of the concentration of TEA, ruling out the quenching of DCA˙−* by TEA.
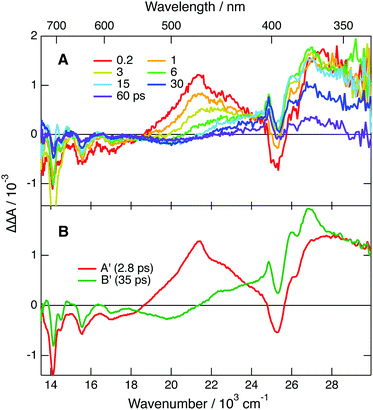
To further explore occurrence of follow-up reactions, DCA˙− was produced by photoinduced ET with a different electron donor, 1,2,6-trimethylbenzene (TMB), and without TBADHP. Due to the absence of the scavenger TBADHP, the ion population decays on the microsecond timescale by homogeneous recombination.77 Therefore, the excited-state dynamics of DCA˙− was measured by PPP TA. The TA spectra obtained at different time delays after 400 nm excitation of DCA with 1 M TMB in ACN (Fig. S9, ESI†) show distinctly the transformation of DCA* into DCA˙−. For the PPP measurements, a second pump pulse at 710 nm was applied 1 ns after the first pump pulse at 400 nm, to excite DCA˙−, and probing was performed at different time delays, Δt23, after the second pump pulse. The resulting PPP spectra correspond to the difference absorption spectra with and without the second pump pulse. Consequently, they can be readily compared with the conventional pump–probe spectra of DCA˙− depicted in Fig. 5. Fig. 6 illustrates resulting PPP spectra as well as the EADS and corresponding time constants obtained from a global analysis of the PPP data. Because of the small transient absorbance at 710 nm induced by the first pump pulse, the PPP signal is weak and, consequently, two successive exponential steps (A′ → B′→C′, C′ being D0) are sufficient to reproduce the data.
The first EADS, A′, is very similar to EADS A (Fig. 5B) with the presence of the 460 nm band, and decays with a similar time constant of 2.8 ps. On the other hand, EADS B′ contains features present in both EADS B and C and decays in 36 ps. The signal-to-noise ratio of these PPP TA data is not sufficient to resolve the intermediate B → C step with a 19 ps time constant. The similarity of the EADS and time constants obtained from the pump–probe and PPP TA measurements reveals that the excited-state dynamics of DCA˙− depends neither on the nature of the electron donor and nor on the presence of the TBADHP scavenger.
According to ref. 5, the oxidation potential of the DCA/DCA˙−* couple amounts to −3.2 V vs. SCE. Given the reduction potential of liquid acetonitrile of −2.8 V vs. SCE,78 an ET from to the solvent should be considered. To explore this possibility, PPP measurements were repeated in DMF, whose reduction potential amounts to −3.0 V vs. SCE.78 As shown in Fig. S13 (ESI†), the lifetime of the 460 nm band is exactly the same in both ACN and DMF, ruling out ET quenching of by the solvent. In fact, the −3.2 V oxidation potential of reported in ref. 5 was calculated assuming an excited-state energy of 2.4 eV, itself taken from the absorption and emission spectra presented in ref. 49, that were later on shown to be associated with a follow-up reaction product of DCA˙−. With a D1 state energy of 1.75 eV, deduced from the absorption spectrum shown in Fig. 3, the oxidation potential of the DCA/DCA˙−* couple is only about −2.6 V vs. SCE. This is insufficient for DCA˙−* to undergo ET with ACN and DMF, in agreement with the PPP results. Therefore, the 375 nm TA band cannot be assigned to a follow-up reaction product of DCA˙−*.
The quantum-chemical calculations in the gas phase predict that the D2 state of DCA˙− at the ground-state geometry is less than 0.2 eV above the D1 state (Fig. S5, ESI†). Given this small difference of energy, one cannot exclude that these two states are actually inverted, and that optical excitation populates the D2 state, as the D1 ← D0 transition is forbidden. In this case, the EADS A and B could be attributed to the D2 and D1 state, respectively. According to this scenario, the 2.8 ps A → B step would correspond to the D2 → D1 internal conversion and the D1 state lifetime would amount to 19 ps. Although this hypothesis cannot be totally ruled out, it is quite improbable since it would imply a surprisingly slow D2 → D1 internal conversion. Based on this, the above hypothesis with the lifetime of the D1 state amounting to about 3 ps seems the most plausible. This assignment of EADS B and C to the hot D0 state is further supported by the spectra measured with TrCA˙− and TCA˙− discussed below with which these hot ground state features are clearer.
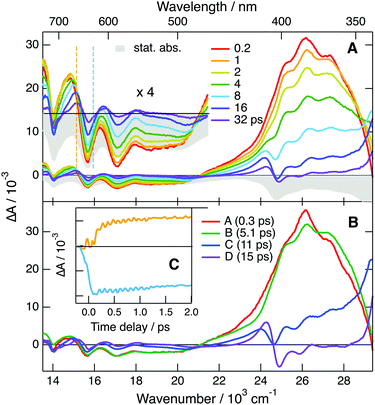
All positive features in EADS C and D are located on the low-energy side of bleaches. Based on this and on the associated time constants, these spectra can be safely assigned to the hot ground state. The positive band at 380 nm, dominating EADS A and B, is also on the red side of the bleach at 330 nm, and could thus also originate from the hot ground state, but at an earlier stage of thermal equilibration. However, the area of this band is larger than that expected for the 330 nm bleach (Fig. S11, ESI†). If this band were really due to the hot ground state, this would imply that the oscillator strength of this transition increases very significantly with the vibrational temperature of the molecule. While not totally impossible, such an effect would be a violation of the Condon approximation.79 Therefore, the assignment of this band to a Dn ← D1 absorption seems more plausible. In this case, the A → B and B → C steps mostly reflect the equilibration of the Franck–Condon D1 state and the decay of the D1 state by internal conversion, respectively. The excited-state lifetime of TrCA˙− amounts, thus, to ∼5 ps.
Additionally, the time dependence of the TA intensity above 550 nm exhibits a distinct oscillation during the first ps after excitation (Fig. 7C). As illustrated by the contour plot in Fig. S15 (ESI†), a node can be observed at ∼640 nm, the maximum of the second lowest-energy absorption band of TrCA˙−. One can thus conclude that this oscillation arises from a coherent vibrational wavepacket in the D0 state produced via a stimulated Raman process.80–82 Fourier transformation of the oscillation points to a vibrational mode at 317 cm−1 (Fig. S16, ESI†). Quantum-chemical calculations of TrCA˙− in the ground state predict a Raman active vibrational mode at 329 cm−1, which is associated with an in-plane distortion of the anthracene core (Fig. S17, ESI†).
Very similar dynamics were observed upon PPP TA measurements, where TrCA˙− was generated upon photoinduced ET between TrCA in the S1 state and 1 M MES in ACN (Fig. S12 and S14A, ESI†). The PPP data were analysed assuming two successive exponential steps (A′ → B′ → C′). The resulting EADS A′ resembles those of A and B shown in Fig. 7B, whereas EADS B′ shows the characteristic feature of the hot ground state (Fig. S14B, ESI†).
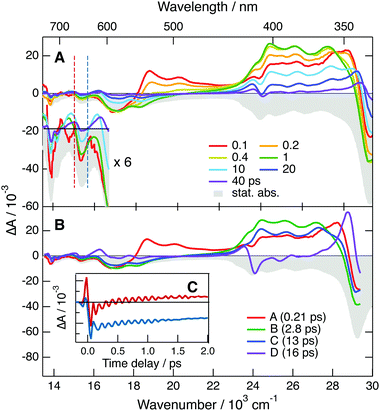
The quantum-chemical calculations performed with TCA˙− predict that optical excitation in the lowest-energy absorption band populates the D2 state, because the D1 ← D0 transition has no oscillator strength. Based on this, the 535 nm band observed at the earliest time delays can be attributed to the D2 state. Consequently, the 210 fs time constant obtained from the global analysis can be assigned to the D2 → D1 internal conversion. The order of magnitude of this time constant agrees with that expected for the excited-state lifetime of an upper-excited state. Whereas EADS A is mostly due to the D2 state, EADS B, which is dominated by the positive band with a maximum at 410 nm, should correspond to the D1 state. However, given that this band is located on the red side of the strong bleach at 340 nm, it is not clear whether it can really be interpreted as a Dn ← D1 transition or it is dominated by hot-ground state absorption. The first interpretation implies that the lifetime of the D1 state amounts to 2.8 ps. According to the second interpretation, the D1 → D0 internal conversion is significantly faster and this time constants reflects mostly the early stage of vibrational relaxation. However, the fact that the ground-state bleach features do not decrease significantly, during the A → B step is rather in favour of the first interpretation. Additionally, the relatively large area of the 410 nm band does not point to an entirely hot ground state feature. As stated above, non-equilibrium and, thus, non-exponential dynamics can be expected for processes occurring on this timescale. Consequently, additionally to the D1 state, EADS B could also contain a non-negligible contribution from the hot ground state. On the other hand, the last two steps, C → D → E, can unambiguously be attributed to the equilibration of the hot ground state.
Similarly to TrCA˙− an oscillation can also be observed at early time in the TA data above 550 nm (Fig. 8C). Here, the node is at 650 nm, the maximum of the second lowest-energy absorption band of TCA˙− (Fig. S18, ESI†). This oscillation can thus also be attributed to a coherent vibrational wavepacket in the D0 state. This oscillation is at 307 cm−1 (Fig. S19, ESI†), whereas quantum-chemical calculations of TCA˙− in the ground state predict a Raman active vibrational mode at 300 cm−1, which is also associated with in-plane distortion of the anthracene core (Fig. S20, ESI†). The slightly lower frequency of this mode in TCA˙− relative to TrCA˙− can be explained by the presence of the C![[triple bond, length as m-dash]](https://www.rsc.org/images/entities/char_e002.gif) N group in 6 position instead of a H atom. Because of the absence of C
N group in 6 position instead of a H atom. Because of the absence of C![[triple bond, length as m-dash]](https://www.rsc.org/images/entities/char_e002.gif) N groups in the 2 and 6 positions, this normal mode is lacking in DCA˙−. For this anion, the calculations predict a Raman-active vibration at 358 cm−1. This corresponds to a vibrational period of 90 fs, which is probably just too short to be properly resolved with the instrument response function of the TA setup. The absence of vibrational coherence in the TA data measured with DCA˙− is, thus, not surprising.
N groups in the 2 and 6 positions, this normal mode is lacking in DCA˙−. For this anion, the calculations predict a Raman-active vibration at 358 cm−1. This corresponds to a vibrational period of 90 fs, which is probably just too short to be properly resolved with the instrument response function of the TA setup. The absence of vibrational coherence in the TA data measured with DCA˙− is, thus, not surprising.
4 Discussion
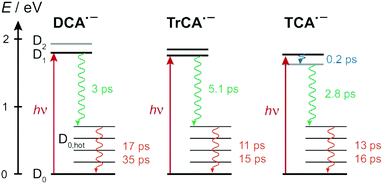
Fig. 9 summarises the most probable deactivation pathways following photoexcitation of the three radical anions, based on the above-described interpretation of the TA data. For DCA˙− and TrCA˙−, the D1 state is directly populated upon 710 nm excitation. As the D1 ← D0 transition is predicted to be forbidden for TCA˙−, the D1 state is populated upon internal conversion from the D2 state with a ∼200 fs time constant. The D1 state of all three radical anions is characterised by a very short lifetime, between 3 and 5 ps, due to the existence of very efficient non-radiative decay channel(s). As this internal conversion is faster than vibrational relaxation, the decay of the ground-state bleach features occurs on a slower timescale through the equilibration of the molecular temperature with that of the environment. For all three anions, time constant ranging between 10 and 20 ps are found for this vibrational cooling. A slower 35 ps component is present with DCA˙−. This less efficient equilibration of DCA˙− could be related to absence of C![[triple bond, length as m-dash]](https://www.rsc.org/images/entities/char_e002.gif) N substituents in 2 and 6 positions, which leads to distinct vibrational modes for this anion compared to the other two. It should be noted that the solute and solvent dependence of intermolecular vibrational energy relaxation is still not fully understood.
N substituents in 2 and 6 positions, which leads to distinct vibrational modes for this anion compared to the other two. It should be noted that the solute and solvent dependence of intermolecular vibrational energy relaxation is still not fully understood.
These very short excited-state lifetimes are consistent with most of those reported previously with other open-shell ions in liquids.4,16–26,35–39 They are usually explained by the presence of conical intersection(s) between the D1 and D0 states that could be readily reached from the Franck–Condon D1 state.25,27–30 TD-DFT calculations predict that, whereas the D2–D1 gap is less than 0.2 eV at the D0 equilibrium geometry, it increases to about 0.7 eV when going to the D1 geometry (Fig. S5, ESI†). They also predict that, at the D2 equilibrium geometry, D2 becomes the lowest excited state. This points to the presence of D2/D1 conical intersection(s) along the relaxation pathway of D2. According to these calculations, the energy of the D0 state at the D2 and D1 equilibrium geometries is only about 0.15 to 0.2 eV above that at the D0 equilibrium geometry. However, these results do not preclude the existence of D1/D0 conical intersections, which remains the most probable origin of the very short excited-state lifetime of these anions. It should be noted that the presence of an electron in a anti-bonding molecular orbital makes these anions structurally more flexible than their neutral counterparts. According to the TD-DFT calculations, the D1 ← D0 excitation involves electronic displacement from bonding to anti-bonding molecular orbitals (Section S4, ESI†) and should, thus, lead to an enhanced flexibility of the excited anion, easing access to conical intersections. Proper detection of such intersections requires high-level quantum-chemical calculations that would go beyond the scope of this investigation.
The excited-state lifetime of DCA˙− is much shorter than the 4 ns value deduced from quenching measurements of DCA˙−* produced by photoexcitation with a 5 ns pulse.33 This lifetime was estimated from the decrease of the DCA˙− bleach signal in the presence of an electron acceptor and by assuming a diffusion-controlled quenching. However, at the high acceptor concentrations used in these experiment, up to 0.5 M, quenching is much more efficient than predicted assuming a pseudo-first order kinetics with the rate constant of diffusion.44,59,83 This is due to the contributions of the static and non-stationary stages of the quenching, which do not involve very significant diffusion of the reactants, and occur on a sub-ps to few tens ps timescales in non-viscous solvents. As these two non-equilibrium stages of quenching are dominant at such high concentrations, their neglect can lead to a strong overestimation of the lifetime of the excited reactant.
The very short excited-state lifetime of the radical anion of these cyanoanthracenes does not make them ideal systems for multiphoton photoredox catalysis. However, if the species to be reduced is at sufficiently high concentration, typically above ∼0.3 M, and if the driving force is sufficiently large, typically above 0.2 eV, the process could still occur relatively efficiently thanks to the static and non-stationary quenching regimes discussed above.
These lifetimes do not make the cyanoanthracenes very good candidates to detect the formation of excited ions upon highly exergonic photoinduced bimolecular ET, and thus to explain the discrepancy between the Weller experiment and Marcus theory. Among them, DCA˙− is probably the best candidate as its D1 state exhibits a distinct absorption band around 460 nm. Although DCA is the weakest electron acceptor, the ET quenching of its S1 state by a strong electron donor like TMPD should be just exergonic enough to produce.
5 Conclusions
DCA˙− has been suggested to be a well-suited radical anion for multi-photon redox catalysis based on a nanosecond excited-state lifetime determined from indirect measurements. Our results reveal unambiguously that the excited-state lifetime of DCA˙− and the radical anion of other cyanoanthracenes is shorter by three orders of magnitude. This is due to the presence of very efficient non-radiative pathway(s) to the D0 ground state. In this respect, these radical anions do not differ from most other organic open-shell ions, which are also characterised by very short excited-state lifetimes in room-temperature liquids. The ultrafast dynamics of these excited cyanoanthracene anions is most likely due to the presence of conical intersection(s) between the D1 and D0 states that are accessible from the Franck–Condon excited state, as found for many other radical ions. This property, which seems to be more a rule than an exception, most probably stems from the reduced rigidity of photoexcited radical ions compared to their neutral counterparts. This limits the choice of radical ions for multi-photon redox chemistry or at least imposes constraints on the experimental conditions. However, intermolecular photochemistry with cyanoanthracene radical anions should still be feasible if the quenching occurs in the static and non-stationary regimes. Further work is needed to confirm the viability of this approach.Data availability
All data can be downloaded from https://doi.org/10.26037/yareta:foqfztykprfwfalyhtksm56brq.Conflicts of interest
There are no conflicts to declare.Acknowledgements
The authors thank the Swiss National Science Foundation (grant 200020-184607) and the University of Geneva for financial support.Notes and references
- J.-C. Moutet and G. Reverdy, Nouv. J. Chem., 1983, 7, 105 CAS.
- I. Ghosh, T. Ghosh, J. I. Bardagi and B. König, Science, 2014, 346, 725–728 CrossRef CAS PubMed.
- M. Fujitsuka and T. Majima, J. Photochem. Photobiol., C, 2018, 35, 25–37 CrossRef CAS.
- J. A. Christensen, B. T. Phelan, S. Chaudhuri, A. Acharya, V. S. Batista and M. R. Wasielewski, J. Am. Chem. Soc., 2018, 140, 5290–5299 CrossRef CAS PubMed.
- J. P. Barham and B. König, Angew. Chem., Int. Ed., 2020, 59, 11732–11747 CrossRef CAS PubMed.
- H. Kim, H. Kim, T. H. Lambert and S. Lin, J. Am. Chem. Soc., 2020, 142, 2087–2092 CrossRef CAS PubMed.
- F. Glaser, C. Kerzig and O. S. Wenger, Angew. Chem., Int. Ed., 2020, 59, 10266–10284 CrossRef CAS PubMed.
- D. K. Bohme, Chem. Rev., 1992, 92, 1487 CrossRef CAS.
- T. Snow, V. L. Page, Y. Keheyan and V. Bierbaum, Nature, 1998, 391, 259–260 CrossRef CAS PubMed.
- P. J. Sarre, J. Mol. Spectrosc., 2006, 238, 1–10 CrossRef CAS.
- G. Wenzel, C. Joblin, A. Giuliani, S. Rodriguez Castillo, G. Mulas, M. Ji, H. Sabbah, S. Quiroga, D. Peña and L. Nahon, Astron. Astrophys., 2020, 641, A98 CrossRef CAS PubMed.
- D. Rehm and A. Weller, Isr. J. Chem., 1970, 8, 259–271 CrossRef CAS.
- M. Koch, A. Rosspeintner, K. Adamczyk, B. Lang, J. Dreyer, E. T. J. Nibbering and E. Vauthey, J. Am. Chem. Soc., 2013, 135, 9843–9848 CrossRef CAS PubMed.
- A. I. Burshtein and A. I. Ivanov, Phys. Chem. Chem. Phys., 2007, 9, 396–400 RSC.
- R. A. Holroyd and J. R. Miller, J. Phys. Chem. B, 2019, 123, 9206–9211 CrossRef CAS PubMed.
- Y. Huang and J. B. Hopkins, J. Phys. Chem., 1996, 100, 9585–9591 CrossRef CAS.
- J.-C. Gumy and E. Vauthey, J. Phys. Chem. A, 1997, 101, 8575–8580 CrossRef CAS.
- P. Brodard, A. Sarbach, J.-C. Gumy, T. Bally and E. Vauthey, J. Phys. Chem. A, 2001, 105, 6594–6601 CrossRef CAS.
- T. Häupl, R. Lomoth and L. Hammarström, J. Phys. Chem. A, 2003, 107, 435–438 CrossRef.
- L. Zhao, R. Lian, I. Shkrob, R. Crowell, S. Pommeret, E. Chronister, A. Liu and A. Trifunac, J. Phys. Chem., 2004, 108, 25–31 CrossRef CAS.
- A. N. Okhrimenko, A. V. Gusev and M. A. J. Rodgers, J. Phys. Chem. A, 2005, 109, 7653–7656 CrossRef CAS PubMed.
- S. Pagès, B. Lang and E. Vauthey, J. Phys. Chem. A, 2006, 110, 7547–7553 CrossRef PubMed.
- S. Samori, M. Fujitsuka and T. Majima, J. Phys. Chem. A, 2008, 112, 11312–11318 CrossRef CAS PubMed.
- S. Amarie, U. Förster, N. Gildenhoff, A. Dreuw and J. Wachtveitl, Chem. Phys., 2010, 373, 8–14 CrossRef CAS.
- J. Grilj, E. N. Laricheva, M. Olivucci and E. Vauthey, Angew. Chem., Int. Ed., 2011, 50, 4496–4498 CrossRef CAS PubMed.
- J. Grilj, P. Buchgraber and E. Vauthey, J. Phys. Chem. A, 2012, 116, 7516–7522 CrossRef CAS PubMed.
- K. F. Hall, M. Boggio-Pasqua, M. J. Bearpark and M. A. Robb, J. Phys. Chem. A, 2006, 110, 13591–13599 CrossRef CAS PubMed.
- A. M. Tokmachev, M. Boggio-Pasqua, M. J. Bearpark and M. A. Robb, J. Phys. Chem. A, 2008, 112, 10881–10886 CrossRef CAS PubMed.
- A. M. Tokmachev, M. Boggio-Pasqua, D. Mendive-Tapia, M. J. Bearpark and M. A. Robb, J. Chem. Phys., 2010, 132, 044306 CrossRef PubMed.
- K. S. Zinchenko, F. Ardana-Lamas, I. Seidu, S. P. Neville, J. van der Veen, V. U. Lanfaloni, M. S. Schuurman and H. J. Wörner, Science, 2021, 371, 489 CrossRef CAS PubMed.
- J. Eriksen and C. S. Foote, J. Phys. Chem., 1978, 82, 2659–2662 CrossRef CAS.
- J. Eriksen, K. A. Joergensen, J. Linderberg and H. Lund, J. Am. Chem. Soc., 1984, 106, 5083–5087 CrossRef CAS.
- M. Fujita, A. Ishida, T. Majima and S. Takamuku, J. Phys. Chem., 1996, 100, 5382–5387 CrossRef CAS.
- A. R. Cook, L. A. Curtiss and J. R. Miller, J. Am. Chem. Soc., 1997, 119, 5729–5734 CrossRef CAS.
- D. Gosztola, M. P. Niemczik, W. Svec, A. S. Lukas and M. R. Wasielewski, J. Phys. Chem. A, 2000, 104, 6545–6551 CrossRef CAS.
- M. J. Hope, M. P. Higlett, D. L. Andrews, S. R. Meech, I. D. Hands, J. L. Dunn and C. A. Bates, Chem. Phys. Lett., 2009, 474, 112–114 CrossRef CAS.
- M. Fujitsuka, T. Ohsaka and T. Majima, Phys. Chem. Chem. Phys., 2015, 17, 31030–31038 RSC.
- C. Lu, M. Fujitsuka, A. Sugimoto and T. Majima, J. Phys. Chem. C, 2016, 120, 12734–12741 CrossRef CAS.
- C. Lu, M. Fujitsuka, A. Sugimoto and T. Majima, J. Phys. Chem. C, 2017, 121, 4558–4563 CrossRef CAS.
- C. Foote and J. Ericksen, J. Phys. Chem., 1978, 82, 2659–2882 CrossRef.
- I. Gould, D. Ege, J. Moser and S. Farid, J. Am. Chem. Soc., 1990, 112, 4290 CrossRef CAS.
- E. Vauthey, J. Phys. Chem. A, 2001, 105, 340–348 CrossRef CAS.
- R. C. Vieira and D. E. Falvey, J. Phys. Chem. B, 2007, 111, 5023–5029 CrossRef CAS PubMed.
- M. Liang, A. Kaintz, G. A. Baker and M. Maroncelli, J. Phys. Chem. B, 2011, 116, 1370–1384 CrossRef PubMed.
- A. Rosspeintner, G. Angulo and E. Vauthey, J. Am. Chem. Soc., 2014, 136, 2026–2032 CrossRef CAS PubMed.
- B. Wu, M. Liang, N. Zmich, J. Hatcher, S. I. Lall-Ramnarine, J. F. Wishart, M. Maroncelli and E. W. Castner, J. Phys. Chem. B, 2018, 122, 2379–2388 CrossRef CAS PubMed.
- A. J. Orr-Ewing, Struct. Dyn., 2019, 6, 010901 CrossRef PubMed.
- R. A. Marcus and N. Sutin, Biochim. Biophys. Acta, Proteins Proteomics, 1985, 811, 265–322 CAS.
- J. Eriksen, H. Lund and A. Nyvad, Acta Chem. Scand., 1983, B37, 459 CrossRef CAS.
- D. T. Breslin and M. A. Fox, J. Phys. Chem., 1994, 98, 408–411 CrossRef CAS.
- S. L. Mattes and S. Farid, J. Am. Chem. Soc., 1982, 104, 1454–1456 CrossRef CAS.
- M. A. Kellett, D. G. Whitten, I. R. Gould and W. R. Bergmark, J. Am. Chem. Soc., 1991, 113, 358–359 CrossRef CAS.
- A. Aster, G. Licari, F. Zinna, E. Brun, T. Kumpulainen, E. Tajkhorshid, J. Lacour and E. Vauthey, Chem. Sci., 2019, 10, 10629–10639 RSC.
- J. S. Beckwith, B. Lang, J. Grilj and E. Vauthey, J. Phys. Chem. Lett., 2019, 10, 3688–3693 CrossRef CAS PubMed.
- T. Yanai, D. P. Tew and N. C. Handy, Chem. Phys. Lett., 2004, 393, 51–57 CrossRef CAS.
- C. Lee, W. Yang and R. G. Parr, Phys. Rev. B: Condens. Matter Mater. Phys., 1988, 37, 785–789 CrossRef CAS PubMed.
- M. J. Frisch, G. W. Trucks, H. B. Schlegel, G. E. Scuseria, M. A. Robb, J. R. Cheeseman, G. Scalmani, V. Barone, G. A. Petersson, H. Nakatsuji, X. Li, M. Caricato, A. V. Marenich, J. Bloino, B. G. Janesko, R. Gomperts, B. Mennucci, H. P. Hratchian, J. V. Ortiz, A. F. Izmaylov, J. L. Sonnenberg, D. Williams-Young, F. Ding, F. Lipparini, F. Egidi, J. Goings, B. Peng, A. Petrone, T. Henderson, D. Ranasinghe, V. G. Zakrzewski, J. Gao, N. Rega, G. Zheng, W. Liang, M. Hada, M. Ehara, K. Toyota, R. Fukuda, J. Hasegawa, M. Ishida, T. Nakajima, Y. Honda, O. Kitao, H. Nakai, T. Vreven, K. Throssell, J. A. Montgomery, Jr., J. E. Peralta, F. Ogliaro, M. J. Bearpark, J. J. Heyd, E. N. Brothers, K. N. Kudin, V. N. Staroverov, T. A. Keith, R. Kobayashi, J. Normand, K. Raghavachari, A. P. Rendell, J. C. Burant, S. S. Iyengar, J. Tomasi, M. Cossi, J. M. Millam, M. Klene, C. Adamo, R. Cammi, J. W. Ochterski, R. L. Martin, K. Morokuma, O. Farkas, J. B. Foresman and D. J. Fox, Gaussian-16 Revision C.01, Gaussian Inc., Wallingford CT, 2016 Search PubMed.
- S. U. Pedersen, T. B. Christensen, T. Thomasen and K. Daasbjerg, J. Electroanal. Chem., 1998, 454, 123–143 CrossRef CAS.
- A. Rosspeintner, M. Koch, G. Angulo and E. Vauthey, J. Am. Chem. Soc., 2012, 134, 11396–11399 CrossRef CAS PubMed.
- K. Kikuchi, M. Hoshi, T. Niwa, Y. Takahashi and T. Miyashi, J. Phys. Chem., 1991, 95, 38–42 CrossRef CAS.
- O. Laporte and W. F. Meggers, J. Opt. Soc. Am., 1925, 11, 459 CrossRef CAS.
- Z. Szakács and E. Vauthey, J. Phys. Chem. Lett., 2021, 12, 4067–4071 CrossRef PubMed.
- I. H. M. van Stokkum, D. S. Larsen and R. van Grondelle, Biochim. Biophys. Acta, Proteins Proteomics, 2004, 1657, 82–104 CAS.
- J. S. Beckwith, C. A. Rumble and E. Vauthey, Int. Rev. Phys. Chem., 2020, 39, 135–216 Search PubMed.
- A. Rosspeintner, B. Lang and E. Vauthey, Annu. Rev. Phys. Chem., 2013, 64, 247–271 CrossRef CAS PubMed.
- S. V. Feskov, V. A. Mikhailova and A. I. Ivanov, J. Photochem. Photobiol., C, 2016, 29, 48–72 CrossRef CAS.
- S. A. Kovalenko, R. Schanz, H. Hennig and N. Ernsting, J. Chem. Phys., 2001, 115, 3256–3274 CrossRef CAS.
- C. Weinert, B. Wezisla, J. Lindner and P. Vöhringer, Phys. Chem. Chem. Phys., 2015, 17, 13659–13671 RSC.
- R. G. Fedunov, A. V. Plotnikova, A. I. Ivanov and E. Vauthey, J. Phys. Chem. A, 2017, 121, 471–481 CrossRef CAS PubMed.
- D. J. Nesbitt and R. W. Field, J. Phys. Chem., 1996, 100, 12735–12756 CrossRef CAS.
- J. Assmann, A. Charvat, D. Schwarzer, C. Kappel, K. Luther and B. Abel, J. Phys. Chem. A, 2002, 106, 5197 CrossRef CAS.
- C. G. Elles and F. F. Crim, Annu. Rev. Phys. Chem., 2006, 57, 273–302 CrossRef CAS PubMed.
- J.-M. L. Pecourt, J. Peon and B. Kohler, J. Am. Chem. Soc., 2001, 123, 10370–10378 CrossRef CAS PubMed.
- A. Pigliucci, G. Duvanel, L. M. L. Daku and E. Vauthey, J. Phys. Chem. A, 2007, 111, 6135–6145 CrossRef CAS PubMed.
- C. T. Middleton, B. Cohen and B. Kohler, J. Phys. Chem. A, 2007, 111, 10460–10467 CrossRef CAS PubMed.
- O. Braem, T. J. Penfold, A. Cannizzo and M. Chergui, Phys. Chem. Chem. Phys., 2012, 14, 3513–3519 RSC.
- A. Weller, Pure Appl. Chem., 1982, 54, 1885–1888 CAS.
- M. Ue, K. Ida and S. Mori, J. Electrochem. Soc., 1994, 141, 2989–2996 CrossRef CAS.
- E. U. Condon, Phys. Rev., 1928, 32, 858–872 CrossRef CAS.
- H. L. Fragnito, J.-Y. Bigot, P. C. Becker and C. V. Shank, Chem. Phys. Lett., 1989, 160, 101 CrossRef CAS.
- D. M. Jonas, S. E. Bradforth, S. A. Passino and G. R. Fleming, J. Phys. Chem., 1995, 99, 2594–2608 CrossRef CAS.
- L. Monacelli, G. Batignani, G. Fumero, C. Ferrante, S. Mukamel and T. Scopigno, J. Phys. Chem. Lett., 2017, 8, 966–974 CrossRef CAS PubMed.
- M. Koch, A. Rosspeintner, G. Angulo and E. Vauthey, J. Am. Chem. Soc., 2012, 134, 3729–3736 CrossRef CAS PubMed.
Footnotes |
| † Electronic supplementary information (ESI) available: Experimental details, quantum-chemical calculations, and additional TA spectra. See DOI: 10.1039/d1cp04014f. |
| ‡ Present address: Department of Chemistry, Princeton University, Princeton, New Jersey 08544, USA. |
| § Present address: Solvias AG, Römerpark 2, 4303 Kaiseraugst, Switzerland. |
| This journal is © the Owner Societies 2022 |

