
The glass-like structure of iron–nickel nanochains produced by the magnetic-field-induced reduction reaction with sodium borohydride†
Marcin
Krajewski
 *a,
Sz-Chian
Liou
b,
Karolina
Jurkiewicz
c,
Katarzyna
Brzózka
d,
Wen-An
Chiou
b,
Jerzy
Kubacki
c and
Andrzej
Burian
c
*a,
Sz-Chian
Liou
b,
Karolina
Jurkiewicz
c,
Katarzyna
Brzózka
d,
Wen-An
Chiou
b,
Jerzy
Kubacki
c and
Andrzej
Burian
c
aInstitute of Fundamental Technological Research, Polish Academy of Sciences, Pawińskiego 5B, 02-106 Warsaw, Poland. E-mail: mkraj@ippt.pan.pl
bAdvanced Imaging and Microscopy Laboratory, Maryland Nano Center, Institute for Research in Electronics and Applied Physics, University of Maryland, College Park, MD 20742-2831, USA
cFaculty of Science and Technology, Institute of Physics, University of Silesia in Katowice, 75 Pułku Piechoty 1, 41-500 Chorzów, Poland
dDepartment of Physics, Faculty of Mechanical Engineering, University of Technology and Humanities, Stasieckiego 54, 26-600 Radom, Poland
First published on 26th November 2021
Abstract
Preparation and detailed structural characterization of iron–nickel wire-like nanochains with Fe0.75Ni0.25, Fe0.50Ni0.50, and Fe0.25Ni0.75 compositions are reported. The investigated nanomaterials were produced by the novel template-free magnetic-field-induced reduction reaction with NaBH4 as the reducing agent. It is demonstrated that this method leads to the formation of Fe–Ni nanochains composed of spherical nanoparticles with an average diameter of 50–70 nm and with a very high degree of atomic disorder manifested as the lack of clearly developed bcc and fcc phases, which are usually observed for nano- and polycrystalline Fe–Ni species. The recorded wide-angle X-ray scattering data for the obtained Fe–Ni nanochains exhibit a strong resemblance to those obtained for bulk metallic glasses. The atomic scale structure of the investigated nanochains has been studied using pair distribution function analysis of the recorded total scattering data. The best fits to the experimental pair distribution functions have been achieved assuming two-phase models of hcp and bcc networks with the size of coherently scattering regions of about 2.5 nm in diameter, for each Fe–Ni composition. The transmission electron microscopy images indicate that the glass-like bimetallic alloy cores are covered by amorphous oxide/hydroxide shells with their thickness ranging from 2 to 5 nm. Moreover, electron energy loss spectroscopy, X-ray photoelectron spectroscopy, and Mössbauer spectroscopy results confirm the core–shell structure of the Fe–Ni nanochains and the complex character of the shell layer which consists of several iron- and nickel-containing phases.
1 Introduction
The increasing demand for various nanomaterials in many areas covering chemistry, physics, materials science, electronics and biotechnology encourages researchers to search for their newer, cheaper, safer and higher-yield synthesis procedures.1–4 This trend is associated with the fact that nanomaterials usually exhibit significantly different chemical, physical and mechanical properties than their counterparts in larger sizes.3,4 Moreover, these properties can be easily controlled by changing their sizes, shapes and/or chemical compositions.1In general, plenty of chemical and physical synthesis processes leading to nanomaterial formation have been proposed so far. The most prominent way of their production is the so-called wet chemistry, i.e., solution-based techniques. These methods usually allow manufacturing a great amount of materials during one run of synthesis. At the same time, they are relatively inexpensive. Therefore, they can be considered for industrial-scale production. Wet chemical methods are associated with the chemical reduction of liquid or semi-liquid precursors (gels) using various reducing agents such as hydrazine (N2H4),5–7 sodium borohydride (NaBH4),8–11 sodium hypophosphite (NaH2PO2),12 ethylene glycol,13,14 oleylamine (C18H37N),15,16etc. Among them, sodium borohydride is one of the commonly chosen agents to produce inorganic nanoparticles due to its strength, availability and safety.17,18 On the other hand, it is well known that nanomaterials synthesized with NaBH4 often exhibit a disordered, amorphous-like nature.18–26
The reduction reaction performed with NaBH4 usually leads to the formation of the simplest form among nanomaterials, i.e., nanoparticles. Nevertheless, it has been shown that the addition of an external magnetic field during the synthesis of magnetically active particles, i.e., Fe, Ni, and Co and their mixtures, causes their alignment in the form of wire-like chains.25–28 This approach is commonly referred as the magnetic-field-assisted (MFA) or magnetic-field-induced (MFI) synthesis. It should be added that the preparation of bi- or multi-metallic wire-like nanoalloys through the MFI process is possible but is still a challenging task mainly due to their unpredictable growth.29
It is also important to add that all the transition metals mentioned above, i.e., Fe, Ni, Co, and their alloys, reveal excellent properties as electrocatalyst agents.30 On the other hand, they tend to be oxidized in the presence of oxygen.18,31 This process is called spontaneous oxidation and leads to the formation of a core–shell structure which comprises a metallic core and an oxide shell with a nanocrystalline or amorphous nature.18,20,21,24,26,27 The structure of the metallic core may be very complex and composed of various phases exhibiting atomic disorder. Bi- or multi-metallic systems are even more complicated and their precise structural characterization is highly challenging. In turn, their structural features directly influence the chemical, physical and mechanical properties of the nanostructures. A good example may be the case of recently developed Fe39Ni39B12.82Si2.75Nb2.3P4.13 materials with glass-like structures, which exhibit the highest toughness value among Fe-based metallic glasses.32 The origin of the enormous toughness was attributed to the high degree of the atomic scale disorder. Following this argument, the detailed structural investigations of novel iron–nickel wire-like nanochains synthesized in the MFI reduction reaction are presented in this work. These materials are very interesting in terms of numerous potential applications, including the removal of contaminants from water,33 catalysis,34 sensors,35 absorbing systems,36 and many more.
2 Experimental
2.1 Materials
All chemicals were of analytical grade and used without further purification. Iron(II) chloride hydrate (FeCl2·xH2O; purity of 98%), nickel(II) chloride hexahydrate (NiCl2·6H2O; purity of 97%), sodium borohydride (NaBH4; purity of 97%) and acetone (purity of 99.5%) were purchased from Carl Roth GmbH, whereas ethanol (purity of 99.8%) and anhydrous ethanol (purity of 99.9%) were supplied by Avantor (POCH) and Pharmco, respectively.2.2 Synthesis of iron–nickel wire-like nanostructures
Iron–nickel wire-like nanochains with Fe0.75Ni0.25, Fe0.50Ni0.50, and Fe0.25Ni0.75 compositions were synthesized according to the previously described MFI method.26,27 Appropriate amounts of FeCl2·xH2O and NiCl2·6H2O were dissolved in 300 mL of deionized water. These mixtures acted as reaction precursors. In turn, 1.4 g of NaBH4 dissolved in 175 mL of deionized water was used as a reducing agent and was dropped to the previously prepared precursor solutions. This process was carried out in an inert argon gas atmosphere (>99%, BialGaz Company) and in an average external magnetic field of about 0.05 T induced by two parallel neodymium magnets.The as-prepared nanomaterials were rinsed three times with ethanol and then three times with acetone in order to separate the pure powder products from other by-products. After that, they were dried at 50 °C in a vacuum for 2 hours.
2.3 Characterization of iron–nickel wire-like nanostructures
The morphologies and structural features of the as-prepared nanostructures were determined with a Hitachi SU8000 scanning electron microscope (SEM) equipped with a Thermo Scientific energy dispersive X-ray spectrometer (EDS), and a JEOL 2100 FEG high-resolution transmission electron microscope (HRTEM) equipped with an Oxford EDS and a Gatan Image Filter (GIF, Tridiem 863 linked with an electron energy loss spectrometer (EELS) function). The SEM and HRTEM measurements were performed at 3 and 200 kV of accelerating voltage, respectively. Before the SEM investigations, each sample was added to acetone and mixed in an ultrasonic bath for 5 minutes. One drop of the mixture was placed onto an alumina holder covered by carbon tape. In the case of HRTEM measurements, the samples were suspended in absolute anhydrous ethanol, and sonicated for 2 minutes. Then, small drops of the suspensions were pipetted onto a TEM grid coated with holey carbon films (Ted Pella Inc.) and air-dried.The surface chemical composition of the investigated Fe–Ni samples was examined using an X-ray photoelectron spectroscopy (XPS) system equipped with an Al anode which provided a monochromatic X-ray source with an energy of 1486.6 eV. The samples were mounted with the use of carbon tape on a standard PREVAC sample holder. All the photoemission spectra were calibrated against the peaks of Au 4f7/2 at 83.98 eV, Ag 3d5/2 at 368.27 eV and Cu 2p3/2 at 932.67 eV of binding energy. The survey spectra and core lines of Ni 2p, Fe 2p, and O 1s as well as the valence band for all the investigated Fe–Ni nanomaterials were collected. Moreover, the evolution of the Ni 2p3/2, Fe 2p lines and valence bands was performed for the Fe0.50Ni0.50 sample using an Ar+ ion gun with an energy beam of 1 keV. The calculation of atomic concentration as well as the fitting of the shapes of photoemission lines was conducted with MultiPak software provided by Physical Electronics.
The wide-angle X-ray scattering (WAXS) measurements were performed using a laboratory Rigaku Denki D/Max Rapid II-R diffractometer attached with a rotating Ag anode, an incident beam graphite monochromator and an image plate detector. The powder samples were measured in borosilicate glass capillaries of 1.5 mm diameter at room temperature. Background scattering from the empty capillary was subtracted, and the two-dimensional diffraction patterns were converted to the function of the scattered intensity versus the scattering vector, Q = 4π(sin![[thin space (1/6-em)]](https://www.rsc.org/images/entities/char_2009.gif) θ)/λ, where λ = 0.5608 Å is the wavelength of the incident beam. After that, the data were corrected for polarization, absorption, and Compton scattering, and normalized to electron units using a procedure developed for high-energy X-rays.37 The diffraction data for disordered materials are usually presented as the structure factor, S(Q) = 1 + [I(Q) − 〈f2〉]/〈f2〉2, where I(Q) is the coherently scattered intensity, normalized to electron units, where
θ)/λ, where λ = 0.5608 Å is the wavelength of the incident beam. After that, the data were corrected for polarization, absorption, and Compton scattering, and normalized to electron units using a procedure developed for high-energy X-rays.37 The diffraction data for disordered materials are usually presented as the structure factor, S(Q) = 1 + [I(Q) − 〈f2〉]/〈f2〉2, where I(Q) is the coherently scattered intensity, normalized to electron units, where 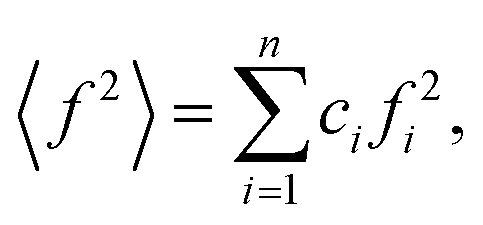
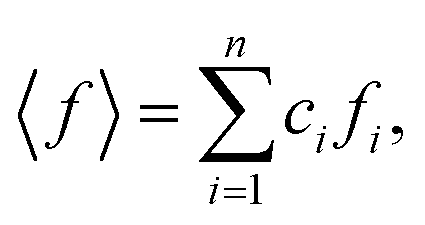 ci and fi are the concentration and the atomic scattering factor of the i-th atomic species, respectively, and n is the number of atomic species in the sample. More details on the experimental setup and data processing are described in reference.38. In the next step, the WAXS data in the form of the structure factor were converted to a real space representation – the pair distribution function,
 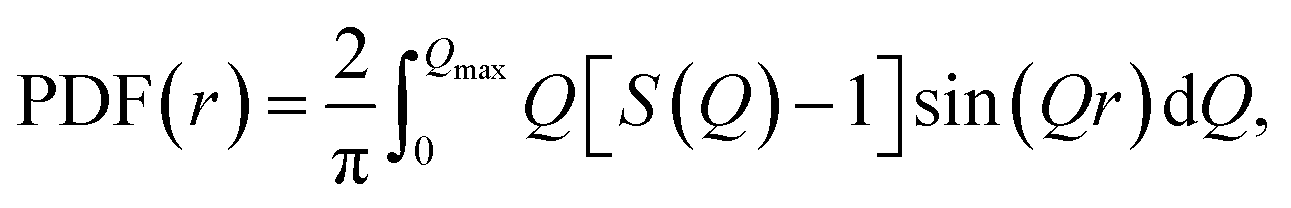 where Qmax = 20 Å−1 is the maximum value of Q reached in the measurement and r is the inter-atomic distance.
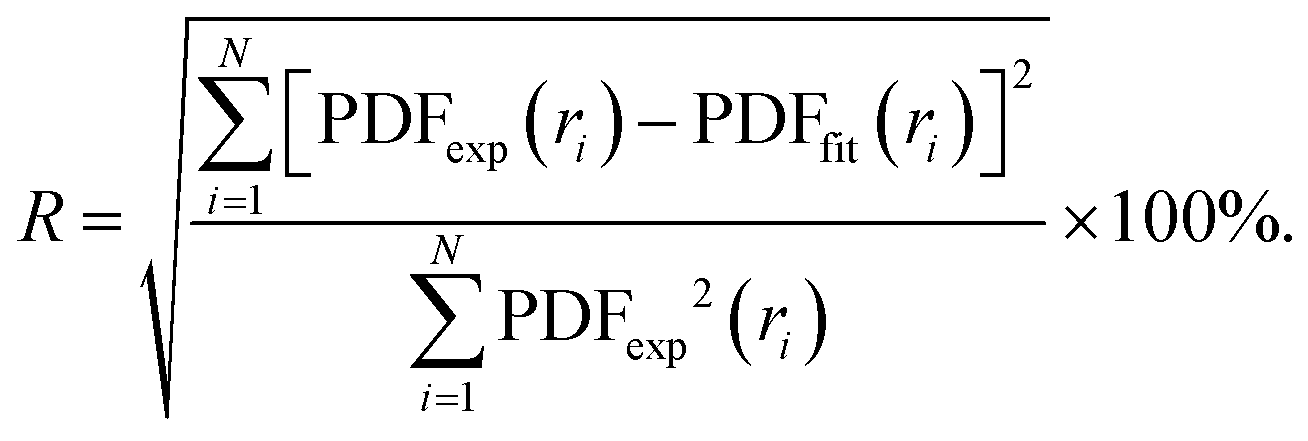
In order to characterise the atomic scale structure of the Fe–Ni nanochains, the refinement of the PDF data using PDFgui software was performed.39 The starting models of the atomic structure were created assuming that the studied Fe–Ni materials form alloys of crystalline body-centred cubic (bcc), face-centred cubic (fcc) or hexagonal close-packed (hcp) structures. The occupancy of the atomic sites in each phase was set adopting the expected composition of the synthesized materials: Fe0.75Ni0.25, Fe0.50Ni0.50, and Fe0.25Ni0.75. The refined parameters included the lattice parameters (i.e., a, b, c), scale factor, low-r to high-r peak ratio correction due to the correlated motions of bonded atoms (sratio), coefficient for 1/r contribution to peak sharpening (delta1), and atomic displacement parameters (uij, ij = (11, 22, 33)). The diameter of the particles (spdiameter) was refined and constrained to an identical value of 22 Å for each phase. The Qdamp parameter (i.e., Gaussian dampening envelope due to limited Q-resolution) was refined for the Si diffraction standard sample and fixed to 0.03. The agreement between the fitted (PDFfit) and experimental (PDFexp) functions was quantified using the discrepancy factor defined as:
 | (1) |
Transmission Mössbauer spectroscopy (TMS) was used to study the structural features and hyperfine magnetic fields of iron-bearing phases present in the investigated Fe–Ni samples. The measurements were carried out at room temperature using a 57Co(Rh) gamma radiation source and a conventional POLON Mössbauer spectrometer operating in a vertical geometry. To modify the energy of the incident gamma photons (due to the Doppler effect), the source was placed on a vibrator head moving longitudinally in a constant acceleration mode. The Mössbauer spectra were analysed using the specialized NORMOS program.
3 Results and discussion
Fig. 1 presents the SEM images of the as-prepared iron–nickel nanomaterials. One can see that all the samples are composed of spherical nanoparticles aligned in nearly straight chains. The diameters of the nanoparticles are not uniform and vary between 20 and 130 nm. The average diameters are 68, 72, and 49 nm for the Fe0.75Ni0.25, Fe0.50Ni0.50, and Fe0.25Ni0.75 compositions, respectively. In turn, the lengths of the chains seem to be more homogeneous. Their values are in the range between 1 and 2 μm. However, slightly longer chains are found for the Fe0.25Ni0.75 sample. This phenomenon can be explained by the fact that longer chains have shorter diameters and vice versa because the amount of reagents taken for all syntheses is roughly the same.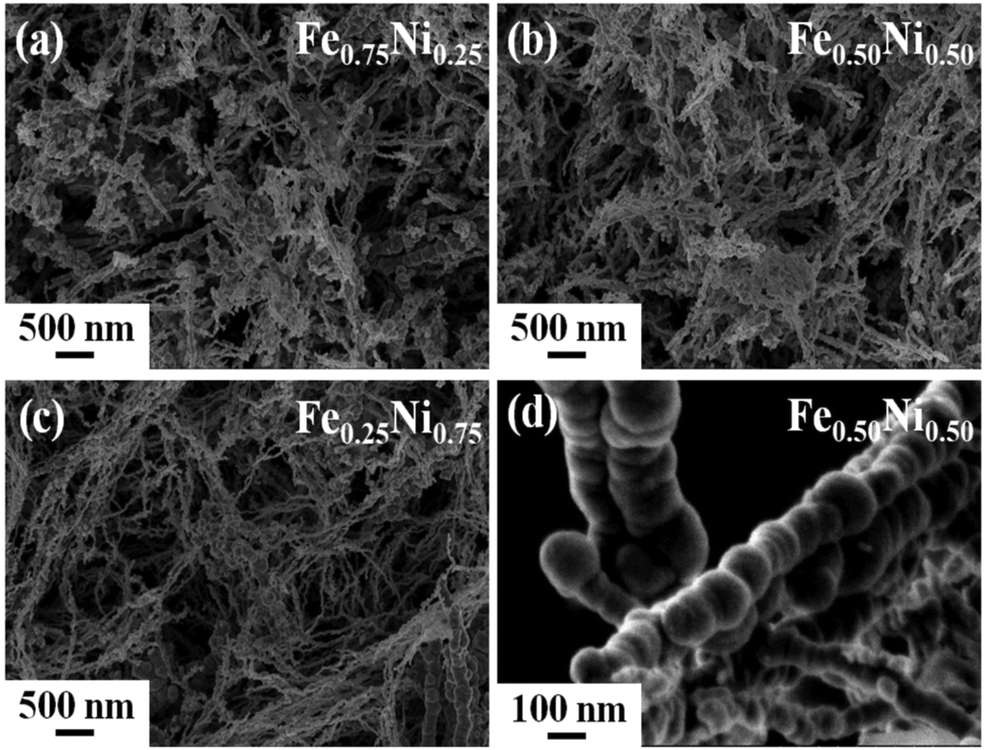 | ||
| Fig. 1 SEM images of (a) Fe0.75Ni0.25, (b) Fe0.50Ni0.50, and (c) Fe0.25Ni0.75 wire-like nanostructures. (d) Magnified SEM image of Fe0.50Ni0.50 nanochains. | ||
The chemical composition of the Fe–Ni chains was characterized using the EDS technique. The EDS signal was collected from the different randomly chosen areas of each sample and averaged. All the samples are partially oxidized since each EDS spectrum reveals the presence of oxygen. The measured concentrations of iron, nickel and oxygen are presented in Table 1. The ratios of Fe and Ni determined from the normalized areal signals for these elements match well with the concentrations of ions used in the reaction.
| Fe0.75Ni0.25 | Fe0.50Ni0.50 | Fe0.25Ni0.75 | ||
|---|---|---|---|---|
| Areal signal | Fe [%mass] | 63.7 | 48.5 | 27.2 |
| Ni [%mass] | 18.6 | 38.6 | 64.9 | |
| O [%mass] | 17.7 | 12.9 | 7.9 | |
| Normalized areal signal for Fe and Ni | Fe [%mass] | 77.4 | 55.7 | 29.5 |
| Ni [%mass] | 22.6 | 44.3 | 70.5 |
In order to verify the partial oxidation of the investigated nanostructures, HRTEM imaging was performed. The HRTEM results show a dark core region and a light-grey shell layer for each specimen (cf.Fig. 2). The shell layer is around 3 nm thick and it is quite uniformly covered along all the Fe–Ni nanochains. The formation of such an oxide shell is consistent with the previous reports for the other Fe and Ni nanostructures.18,20,21,27,28,40–43 Besides that, the HRTEM images indicate that the nanoparticles building the Fe–Ni nanochains reveal an amorphous-like structure. No long-range ordered lattice fringes linked with the crystallographic planes for neither core nor shell layers can be observed. This is also confirmed by the electron diffraction (ED) patterns shown in the insets of Fig. 2, in which only two diffuse rings appear. This kind of diffraction pattern is typical for nanocrystals with size less than around 10 nm or amorphous materials.20,21,24,27
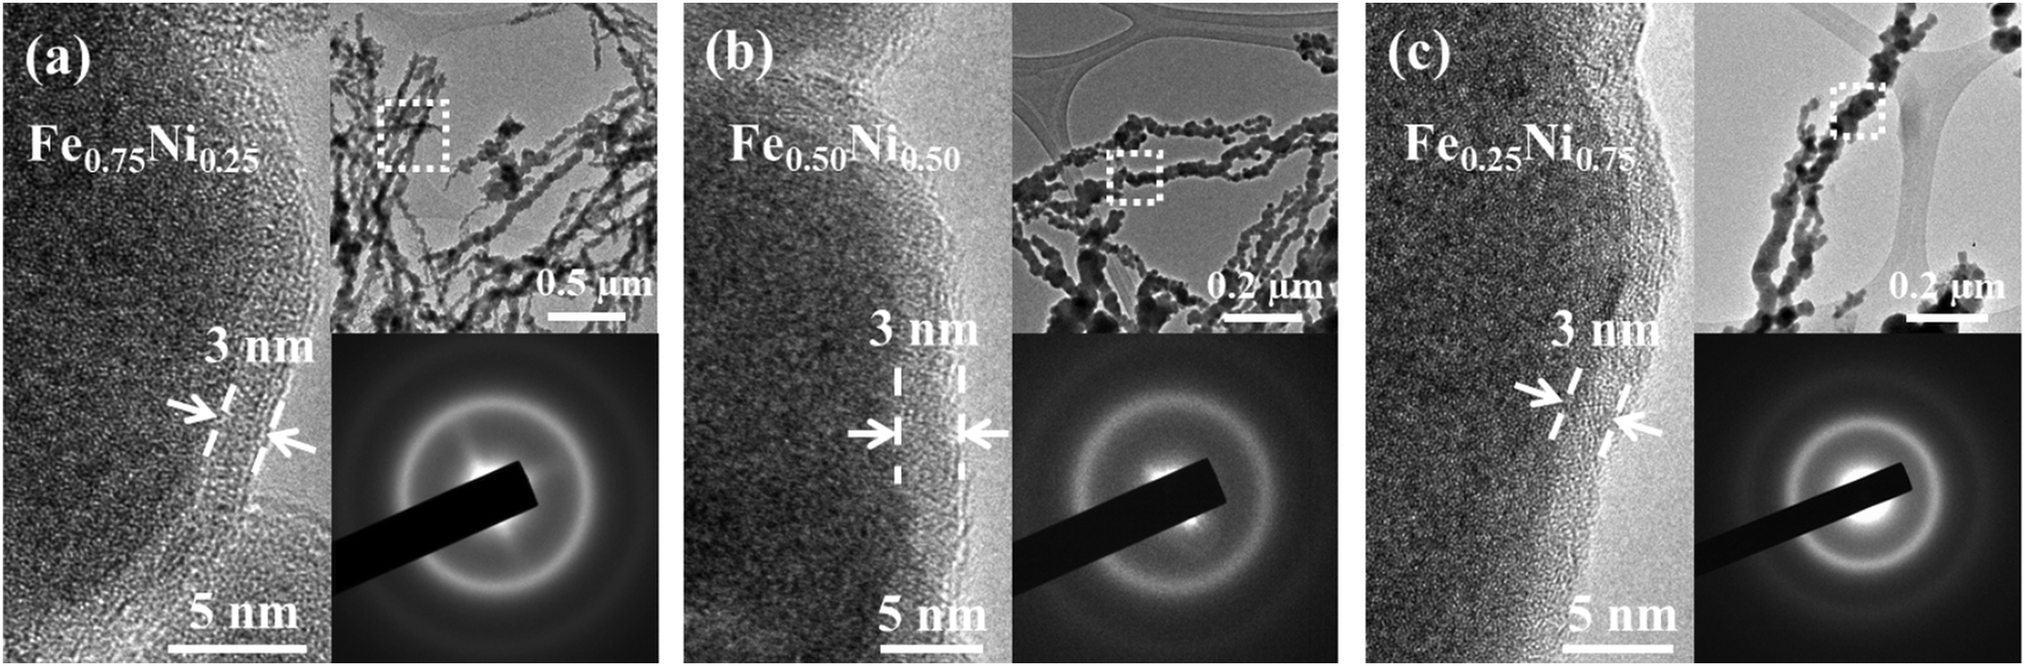 | ||
| Fig. 2 HRTEM images of (a) Fe0.75Ni0.25, (b) Fe0.50Ni0.50, and (c) Fe0.25Ni0.75 wire-like nanostructures; the upper insets indicate the regions where the HRTEM images have been taken, whereas the lower insets indicate the electron diffraction patterns for the corresponding samples. | ||
Since the EDS technique has not provided information about the distribution of iron, nickel and oxygen in single wire-like nanochains, elemental mapping for single chains has been performed with a scanning TEM-EELS imaging technique.44 The obtained maps are shown in Fig. 3. One can see that Fe and Ni elements are uniformly distributed. This proves that the investigated nanochains can be considered as homogenous bimetallic alloys. Furthermore, it is observed that the signal related to oxygen is much more intense on the chain surface. This confirms that the shell layer is composed of oxides or hydroxides and all nanochains reveal, indeed, the core–shell structure. Considering oxygen mapping, it cannot be excluded that a very small amount of this element might also be present in the cores of the Fe–Ni nanochains.
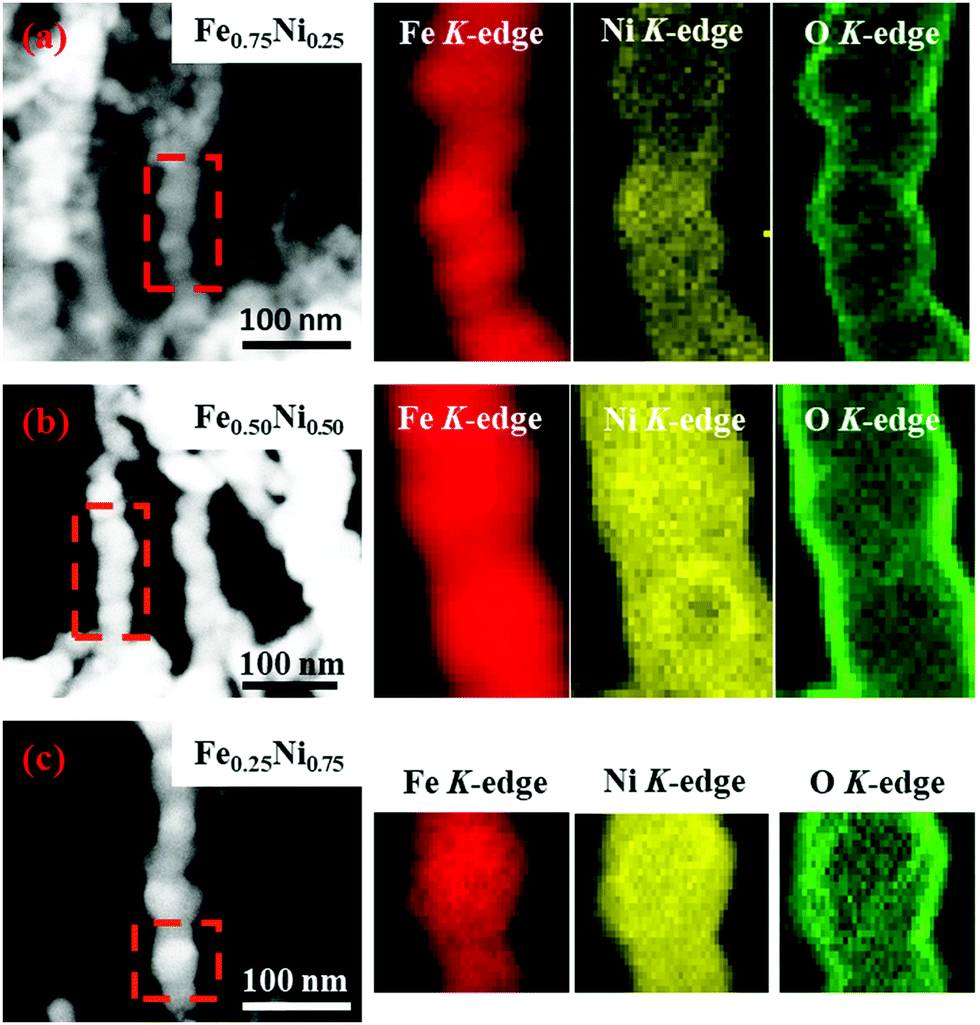 | ||
| Fig. 3 EELS elemental mapping of (a) Fe0.75Ni0.25, (b) Fe0.50Ni0.50, and (c) Fe0.25Ni0.75 wire-like nanochains. | ||
Due to the strong impact of nanochain cores and the dechanelling effect in the EELS measurements, this method gives low accuracy for the determination of chemical composition in our samples. Hence, the surface-sensitive XPS technique has been used to get more information about the composition and structure of the Fe–Ni nanochain shells. The obtained XPS spectra are presented in Fig. 4. The set of Ni 2p lines for all the investigated samples is collected in Fig. 4a. The shapes of 2p3/2 levels are very complex because they are composed of several overlapping signals. Nevertheless, three predominant components, located at the binding energies of 856.6, 855.3 and 852.4 eV, correspond to Ni2O3, Ni(OH)2 from the outer surface of wire-like nanochains and the Fe–Ni phase coming from the core, respectively.45–47 The intensities of particular components differ between samples indicating their various contents. The three additional components at binding energies above 857 eV correspond to the satellite structures of the main 2p3/2 line. In turn, the spectra of Fe 2p lines are shown in Fig. 4b. They are composed of Fe 2p doublets associated with the spin–orbit coupling of 2p3/2 and 2p1/2 electronic states.47,48 The peaks at 711.2 and 724.9 eV are associated with the iron (Fe3+) in the Fe2O3 and Fe(OH)3 phases.46,47 Since maghemite (γ-Fe2O3) and hematite (α-Fe2O3) reveal very similar XPS spectra, it is hard to perceive which of these phases occurs.49 The small peak at 706.8 eV, in particular, visible for the Fe0.25Ni0.75 sample, can be ascribed to Fe in the core of nanochains.50,51 Two dashed lines on the position of the Fe 2p3/2 and Fe 2p1/2 states correspond to the Fe signal coming from the core of the samples. The broad peak representing the O 1s line is shown in Fig. 4c. This peak can be split into three components located at the binding energies of 531.8, 531.3, and 530.2 eV corresponding to Ni2O3, Ni and Fe hydroxides, and Fe2O3 phases, respectively.45–47 From the XPS results, the atomic concertation of Fe, Ni, and O as well as the content of particular components have been estimated. The obtained results are collected in Table 2. The content of oxygen on the surface of all the samples is in the range of 70–80%. The contribution of Ni2O3 is dominant for the Fe0.50Ni0.50 and Fe0.25Ni0.75 nanochains, whereas the presence of Fe2O3 is dominant for the Fe0.75Ni0.25 sample. The level of Fe and Ni hydroxides is similar for all the samples, i.e., about 10%. The proportions between Fe and Ni in the Fe0.75Ni0.25 and Fe0.50Ni0.50 samples correspond well to the stoichiometry of ions used in the MFI reaction. The only deviation is found for the Fe0.25Ni0.75 nanochains, in which a significant nickel deficiency is observed. However, this result may be explained by the high nickel consumption during the formation of Ni2O3, as shown in Fig. 4c.
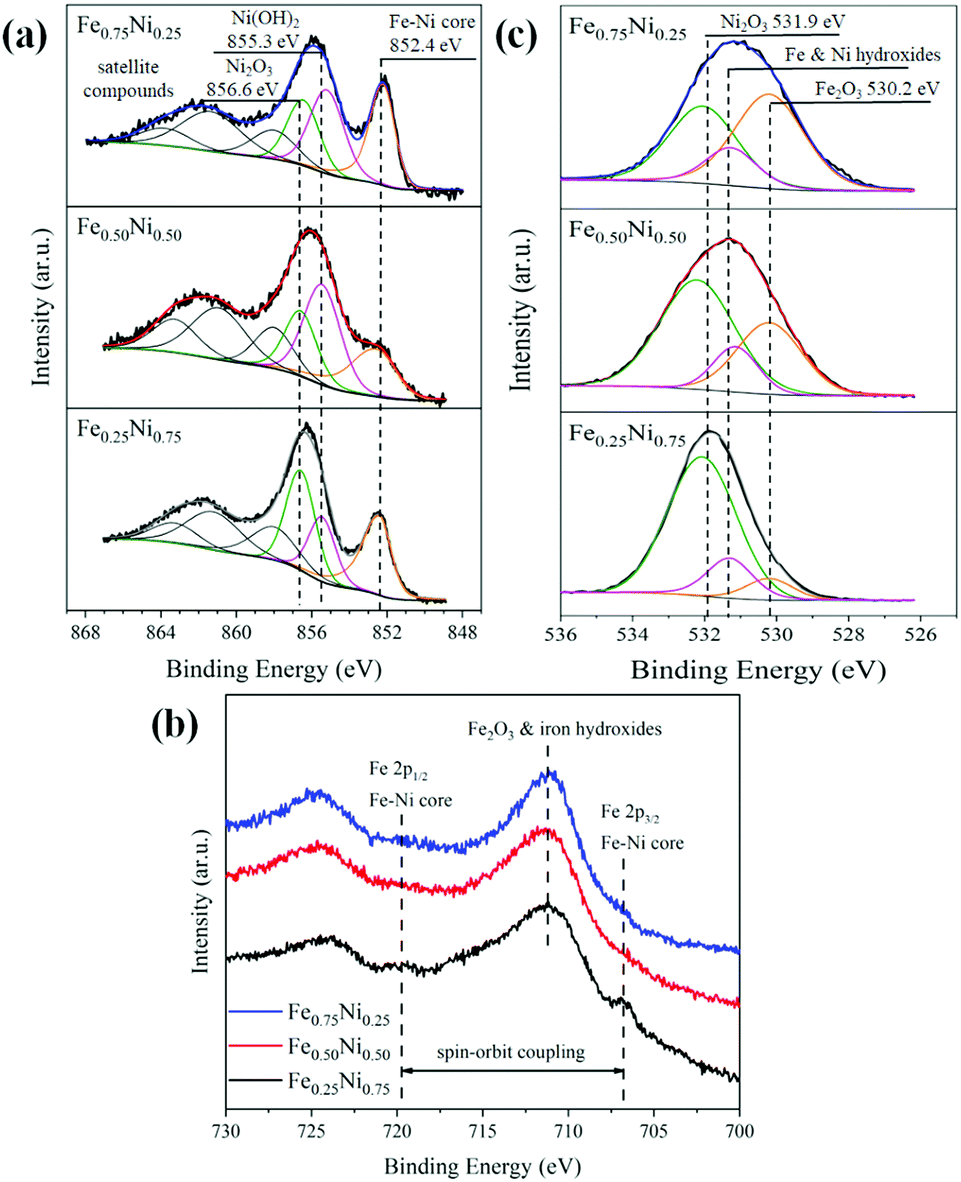 | ||
| Fig. 4 (a) Ni 2p3/2, (b) Fe 2p, and (c) O 1s XPS lines collected for Fe0.75Ni0.25, Fe0.50Ni0.50, and Fe0.25Ni0.75 wire-like nanochains. | ||
| Fe0.75Ni0.25 | Fe0.50Ni0.50 | Fe0.25Ni0.75 | ||
|---|---|---|---|---|
| a The atomic concentrations of the investigated samples have been calculated from Fe 2p, Ni 2p, and O 1s photoemission lines. b The content of Ni2O3, Fe2O3 and hydroxides has been determined from the ratio of the area under the shape of the individual lines to the total area and the resulting atomic concentration value for oxygen. | ||||
| Atomic concentrationa [%] | Fe 2p | 14.7 | 14.3 | 8.0 |
| Ni 2p | 5.4 | 15.7 | 14.7 | |
| O 1s | 79.9 | 70.0 | 77.3 | |
| Content of particular componentsb [%] | Ni2O3 | 29.9 | 42.2 | 60.2 |
| Fe2O3 | 37.9 | 17.1 | 8.5 | |
| Fe and Ni hydroxides | 12.1 | 10.7 | 8.6 | |
| Ratio of Fe/(Fe + Ni) | 0.73 | 0.48 | 0.35 | |
| Ratio of Ni/(Fe + Ni) | 0.27 | 0.52 | 0.65 | |
In order to investigate the changes in the composition as a function of the distance from the surface to the core, the Ar sputtering treatment and simultaneous XPS measurements were performed on the Fe0.50Ni0.50 sample. The collected results for the Fe 2p, Ni 2p, O 1s lines and the valence band are presented in Fig. 5. The changes of Ni 2p lines as a function of sputtering time are shown in Fig. 5a. One can see that the maximum of the 2p3/2 peak shifts towards lower energy along with Ar+ treatment time. This shift is associated with the removal of the most outer layer and a subsequent core exposure. Considering the recorded binding energies during Ar+ sputtering, one can assume that the shell of Fe0.50Ni0.50 nanochains consists of a mixture of Ni2O3, Ni(OH)2, and NiO phases. A similar sequence of shape changes was observed for the Fe 2p lines shown in Fig. 5b. Three characteristic maxima located at 711.8, 708.5 and 706.5 eV are clearly visible. The first band corresponds to Fe2O3 and Fe hydroxides. The second one can be assigned to the FeO phase whose presence is rather unexpected because this oxide rarely occurs in the nanostructures. However, its formation could be caused by the Ar+ ion treatment.49 The band at 706.5 eV is associated with Fe–Ni from the sample core. The normalized spectra of the O 1s lines are compared in Fig. 5c. The initial maximum of the O peak shifts towards higher energy and exceeds above 531.5 eV after 360 s of Ar+ sputtering. This can correspond to the presence of the Ni2O3 phase on the surface. The evolution of the valence band shape is presented in Fig. 5d. The intensity of the density of states shifts towards lower energy with uncovering deeper layers. The features marked as O 2p and C 2s practically disappear under Ar+ treatment in a high vacuum. Their presence in the untreated samples can be explained by surface oxidation or contamination as the XPS is a surface sensitive technique. However, their trace signal above 6 eV is still visible in the spectra even after a quite long time of Ar+ sputtering. This issue can be associated with the incomplete removal of the initial surface layer during treatment due to the curved geometry of the nanoparticles and the roughness of the sample.
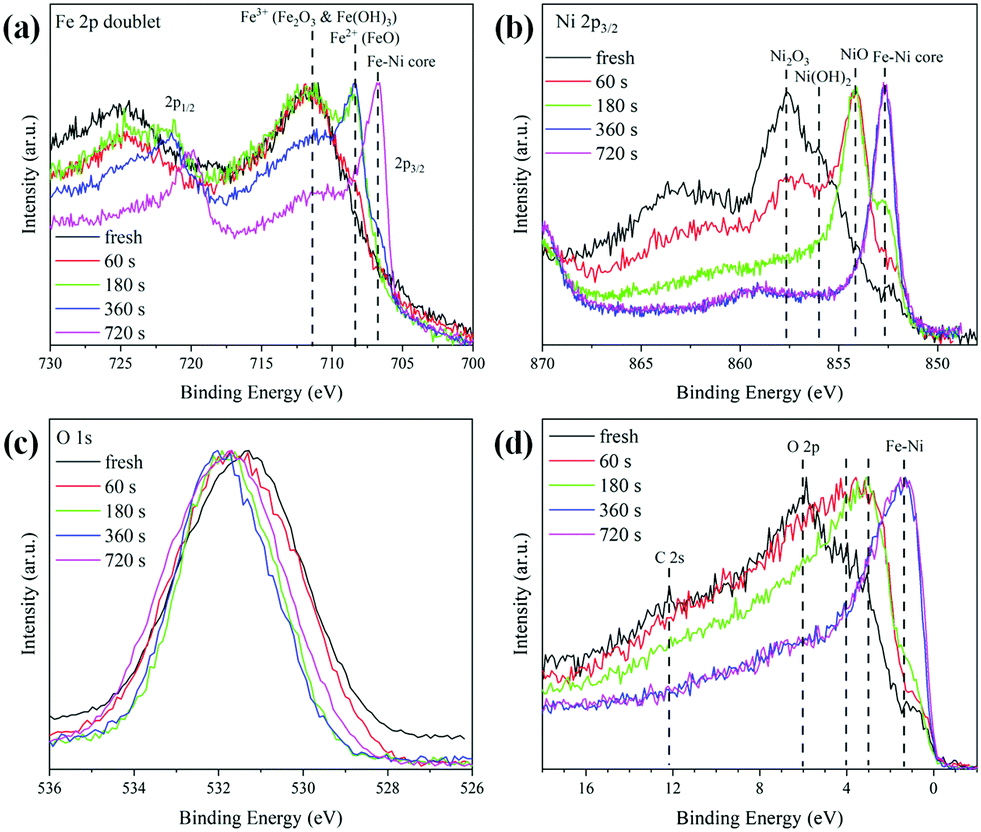 | ||
| Fig. 5 Evolution of the shapes of (a) Fe 2p, (b) Ni 2p, (c) O 1s lines, and (d) the valence band of Fe0.50Ni0.50 nanochains during irradiation with Ar+ ions. | ||
To get a deeper insight into the structure of nanochain cores, the WAXS data were analysed. The X-ray scattering results, in the form of the structure factor S(Q) and the pair distribution functions PDF(r), are presented in Fig. 6 and 7, respectively. The data are very similar to those obtained from synchrotron measurements for the Fe–Ni-based metallic glasses previously reported by Zhou et al.32 They stated that the high structural disorder of these glasses plays a key role in the high comprehensive performance, hindering the propagation of shear transformation zones. The peaks of S(Q) and PDF(r) for the Fe–Ni nanochains investigated here are even more damped than those for the bulk Fe–Ni glasses. This indicates a higher degree of disorder and/or a smaller size of coherent scattering domains for the nanostructures produced by the MFI synthesis. Comparing our WAXS data for different compositions, one can notice that the Ni-rich Fe0.25Ni0.75 sample is the most disordered one. This can be quantified based on, e.g., the lowest intensity of the first S(Q) peak related with the medium-range structure, as well as the lowest intensity of the first PDF(r) peak arising due to the nearest-neighbour Fe–Fe, Ni–Ni and Fe–Ni interatomic correlations.32 The oscillations of PDF(r) extend up to around 25 Å for all the compositions of the nanochains indicating that the ratio of Fe to Ni atoms does not affect the size of the coherent scattering domains.
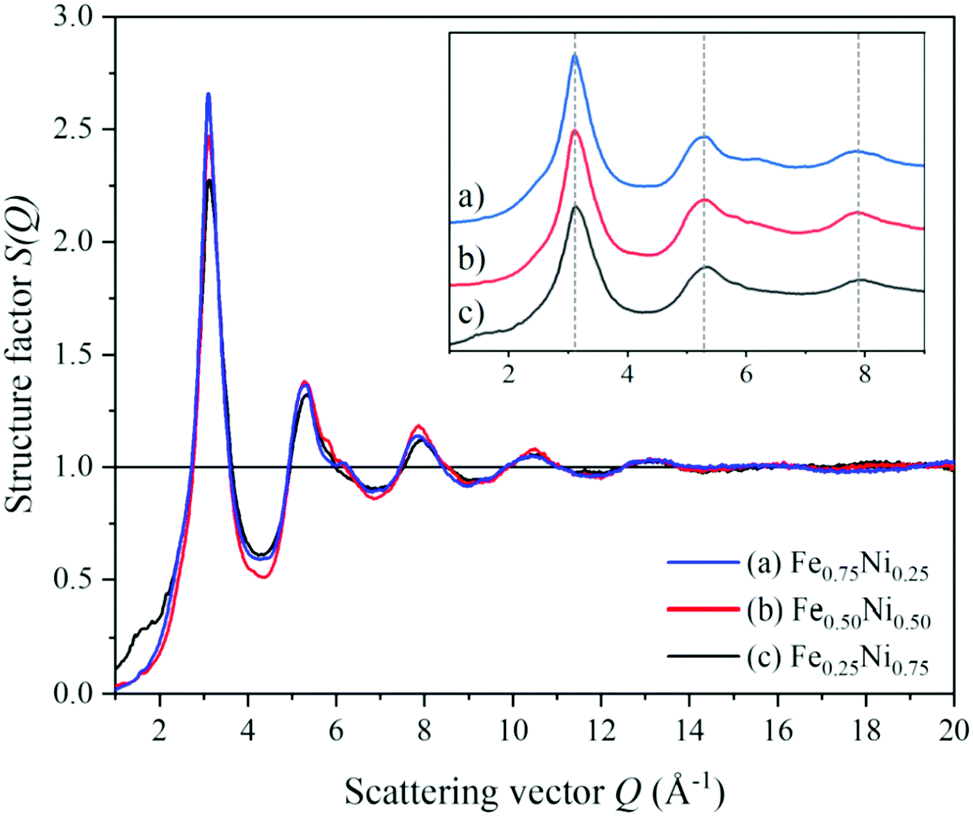 | ||
| Fig. 6 Structure factors calculated from the WAXS data of (a) Fe0.75Ni0.25, (b) Fe0.50Ni0.50, and (c) Fe0.25Ni0.75 nanochains. | ||
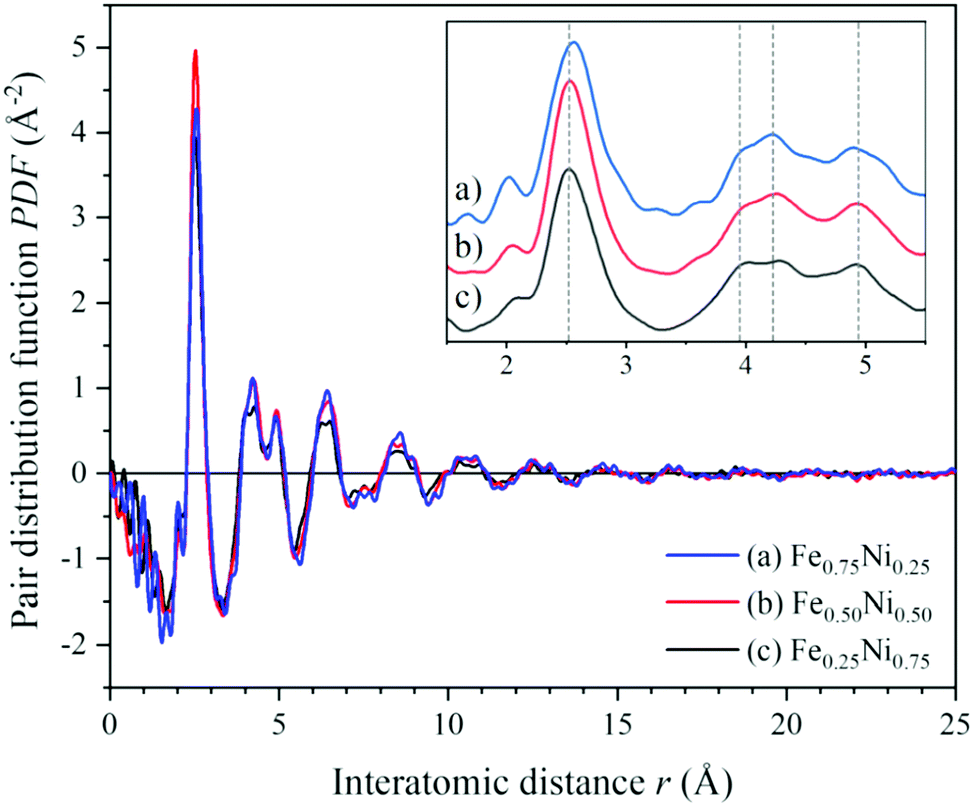 | ||
| Fig. 7 Atomic pair distribution functions calculated from the WAXS data of (a) Fe0.75Ni0.25, (b) Fe0.50Ni0.50, and (c) Fe0.25Ni0.75 nanochains. | ||
Binary alloys generally adopt one of the three principal crystal lattices – bcc, fcc or hcp.52 Therefore, in further analysis of the Fe–Ni nanochains, these types of structures have been taken into consideration. The PDF experimental data were fitted with structural models using PDFgui software. In the first step, it was assumed that the cores of the Fe–Ni nanochains are composed of a single bcc, fcc or hcp phase. The comparison of model-based and experimental PDF(r) data for the Fe0.75Ni0.25, Fe0.50Ni0.50 and Fe0.25Ni0.75 samples are shown in Fig. S1 in the ESI.† In each case, the fit is not satisfactory. Therefore, it may be stated that any single-phase model is not able to correctly characterize the WAXS data for these materials. The quality of the fit remarkably improved when two-phase bcc + fcc, fcc + hcp and bcc + hcp models were applied. These results are presented in Fig. 8. The best fits, which resulted in the lowest R values for all the Fe–Ni concentrations, were obtained for the mixtures of bcc and hcp phases. The values of the refined parameters for the bcc + hcp models are gathered in Table 3. The formation of the hcp-type structure was rather not expected since most often the bcc and fcc structures were exhibited for the Fe–Ni materials in the literature.18,53,54 In turn, the fits for models composed of bcc + fcc and fcc + hcp mixed phases show only somewhat worse agreement with the experimental data than for the bcc + hcp model. The molecular dynamics simulations of the crystallization process of Fe–Ni alloys showed that they might be composed of different types of structural units, including the bcc, fcc, hcp and amorphous-type phases. The presence of the hexagonal hcp phase was also suggested by Hong et al.54 for Ni-rich Fe–Ni nanostructures. The above arguments indicate that the Fe–Ni nanostructures produced using the MFI method are characterized by a complex arrangement of atoms revealing the features of different crystal phases and a very high degree of atomic disorder (glass-like structure). The values of the atomic displacement parameters are extremely large (cf.Table 3). This indicates a broad atomic positional distribution around the average sites. This proves the existence of a static topological disorder in these structures. In the literature, the large values of the atomic displacement parameters for various nanoparticles are usually explained by the presence of stacking fault defects.55 The estimated uij and delta1 parameters have the greatest values for the Fe0.25Ni0.75 sample. This confirms that the Ni-rich concentration results in the most disordered atomic system.
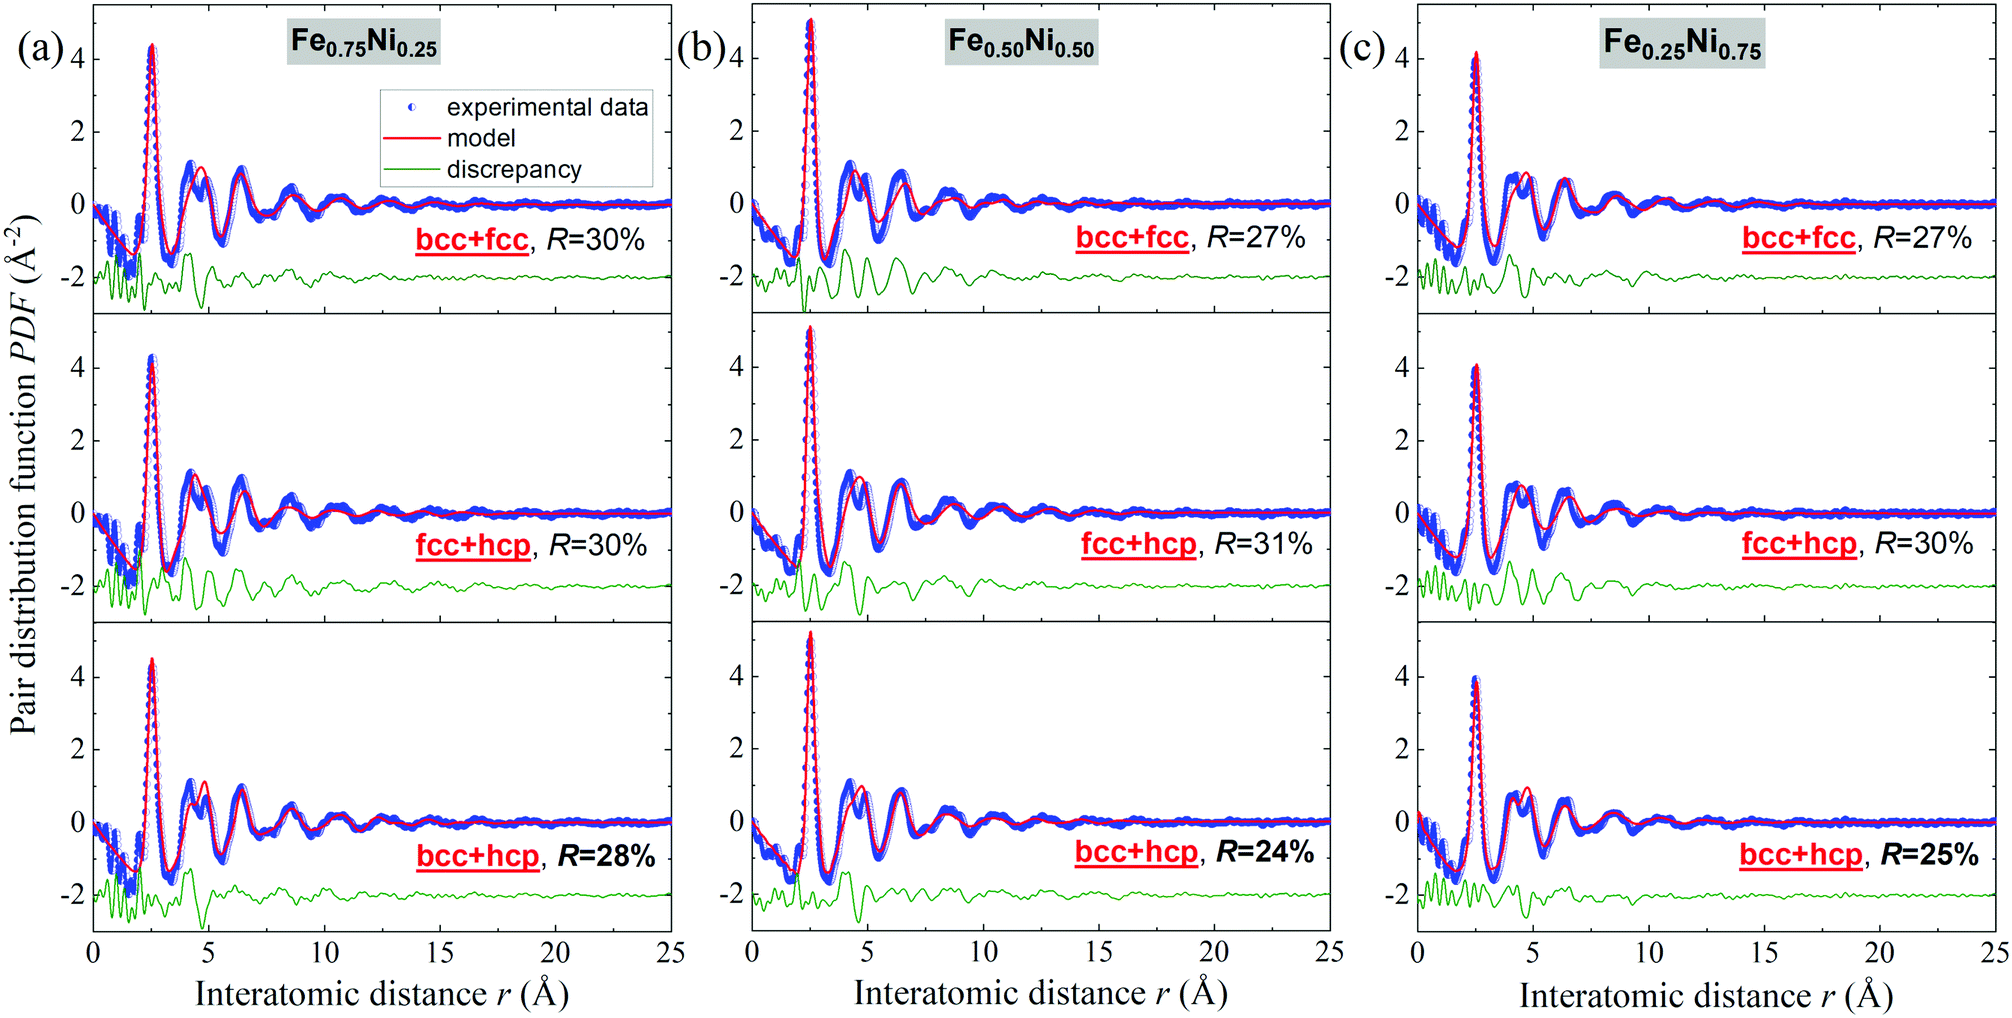 | ||
| Fig. 8 Fits to the experimental atomic pair distribution function with two-phase bcc + fcc, fcc + hcp and bcc + hcp models for (a) Fe0.75Ni0.25, (b) Fe0.50Ni0.50, and (c) Fe0.25Ni0.75 nanochains. | ||
| Phase | Fe0.75Ni0.25 | Fe0.50Ni0.50 | Fe0.25Ni0.75 | |||
|---|---|---|---|---|---|---|
| bcc | hcp | bcc | hcp | bcc | hcp | |
| a The fitting parameters whose meanings are provided in the Experimental section. | ||||||
| Unit cell parameters [Å] | a = 2.923(5) | a = 2.575(3) | a = 2.982(1) | a = 2.555(1) | a = 2.869(6) | a = 2.556(1) |
| c = 4.162(4) | c = 4.224(9) | c = 4.191(3) | ||||
| u ij [Å2] | Fe | Fe | Fe | Fe | Fe | Fe |
| 0.083(5) | 0.108(0) | 0.201(3) | 0.150(8) | 0.293(2) | 0.282(7) | |
| Ni | Ni | Ni | Ni | Ni | Ni | |
| 0.080(3) | 0.095(4) | 0.334(8) | 0.133(2) | 0.306(9) | 0.206(6) | |
| delta1 [Å] | 2.178(1) | 2.230(7) | 2.350(6) | 2.313(4) | 3.644(5) | 2.372(2) |
| sratio | 0.756(0) | 1.274(7) | 0.519(3) | 1.115(1) | 0.661(2) | 1.066(9) |
| Relative phase content [%] | 23 | 77 | 22 | 78 | 16 | 84 |
The structural properties of the Fe–Ni nanochains were also determined by Mössbauer spectroscopy. The obtained room temperature TMS spectra together with the distributions of hyperfine magnetic field (HMF) are presented in Fig. 9. They were fitted using a theoretical curve composed of (i) two sextets with two-part distribution of hyperfine magnetic field and (ii) weak or non-magnetic subspectra represented by several singlets and doublets associated with paramagnetic or superparamagnetic phases. The fitting parameters are collected in Table S1 in the ESI.† Attempts to fit the spectra with a set of many sharp, independent sextets associated with crystalline phases or to include a discrete component did not bring good results.
 | ||
| Fig. 9 Room temperature transmission Mössbauer spectra of (a) Fe0.75Ni0.25, (b) Fe0.50Ni0.50, and (c) Fe0.25Ni0.75 wire-like nanochains as well as hyperfine magnetic field (HMF) distribution determined for (d) Fe0.75Ni0.25, (e) Fe0.50Ni0.50, and (f) Fe0.25Ni0.75 samples; components: sextet with low-field distribution of HMF (solid dark grey line), sextet with high-field distribution of HMF (dashed dark grey line), and non-magnetic subspectra (solid light grey line). | ||
The dominant part of the Mössbauer spectrum for each sample is a smeared sextet (component 1) without any sharp lines of crystalline phases. The spectra are different from the typical broadened and well-defined sextets of most crystalline Fe–Ni alloys. On the other hand, they reveal similarities to the spectra of highly disordered systems, for instance, amorphous or nanocrystalline phases with many equivalent positions of the Mössbauer probes. The sextet related to the main part of HMF distribution has a share of 60–80% of the whole spectrum.
The sextet associated with the oxide/hydroxide shell is represented by the high-field part of HMF distribution (component 2). It covers about 5–8% of the total spectrum. The field range is typical of crystalline Fe-containing oxides/hydroxides but the considerable width of the distribution indicates a strongly distorted lattice.
Several phases might contribute to component 3 of the TMS spectra, including (i) the amorphous iron-containing oxides and hydroxides, which can be paramagnetic at room temperature, (ii) the Fe–Ni alloy with local composition within the Invar range (FexNi1−x where 0.6 < x < 0.7),56 (iii) the superparamagnetic clusters of Fe–Ni which seem to be predominant in the case of Fe0.25Ni0.75 sample. The signal of these phases may come from the core and/or shell layer. Unfortunately, their similar parameters together with the complex character of spectra do not allow to unambiguously distinguish the individual components.
The TMS analysis confirms the previous observations that the Fe–Ni nanochains reveal the core–shell structure. Components 1 and 2 from Table S1 (ESI†) correspond to the core and shell, respectively, whereas component 3 refers to the paramagnetic or superparamagnetic phases which could be present in both parts. Their origin could be possible to determine if more advanced Mössbauer measurements in liquid hydrogen are performed.
4 Conclusions
This work presents a novel, easy-to-perform, template-free magnetic-field-induced (MFI) synthesis of Fe–Ni nanochains using NaBH4 as the reducing agent. This process leads to the formation of disordered glass-like nanomaterials. They can become a great and cheaper alternative of their crystalline counterparts. Therefore, it is important to investigate their thorough structural properties and then match them to possible applications.The investigated nanochains are composed of Fe–Ni spherical nanoparticles. They comprise disordered, glass-like bimetallic alloy cores covered by thin amorphous oxide/hydroxide shells (2–5 nm). The shell layer consists of several Fe- and Ni-containing phases such as Ni2O3, Fe2O3, Fe and Ni hydroxides. Their contribution depends on the stoichiometry of the Fe–Ni nanochains. The atomic pair distribution function analysis revealed that the models, where a mixture of bcc and hcp phases is arranged in small domains of around 2.5 nm, show the best agreement with the experimental diffraction data obtained for each Fe–Ni concentration. The atomic disorder increases with the higher concentration of Ni atoms in the nanochains. The precise knowledge of the phase composition and the atomic arrangement in the synthetized Fe–Ni nanostructures may have profound implications for their potential practical applications in water contamination removal, catalysis, microwave-absorbents or sensors.
Author contributions
Conceptualization, M. K.; methodology, M. K. and K. J.; validation, M. K., K. J., K. B. and J. K.; formal analysis, M. K., K. J., K. B. and J. K.; investigation, M. K., S. C. L., K. J., K. B. and J. K.; resources, M. K., K. B., W. A. C. and A. B.; data curation, M. K., S. C. L., K. J., K. B. and J. K.; writing—original draft, M. K., K. J., K. B. and J. K.; writing—review and editing, M. K., S. C. L., K. J., K. B., W. A. C., J. K., and A. B.; visualization, M. K., S. C. L., K. J., J. K. and K. B.; supervision, M. K. and A. B.; project administration, M. K.; funding acquisition, M. K. All authors have read and agreed to the published version of the manuscript.Conflicts of interest
There are no conflicts to declare.Acknowledgements
This work was supported by the National Science Centre (Poland) under grant no. 2016/23/D/ST8/03268. Moreover, the authors would like to thank Dr Magdalena Płocińska from the Faculty of Materials Science and Engineering at Warsaw University of Technology (Poland) for her help in scanning electron microscopy investigations.References
- M. R. Buck and R. E. Schaak, Angew. Chem., Int. Ed., 2013, 52, 6154–6178 CrossRef CAS.
- V. C. Hoang, M. Hassan and V. G. Gomes, Appl. Mater. Today, 2018, 12, 342–358 CrossRef.
- P. K. Singh, P. Kumar and A. K. Das, Proc. Natl. Acad. Sci. U. S. A., 2019, 89, 199–221 Search PubMed.
- U. Kamran, H. N. Bhatti, M. Iqbal and A. Nazir, Z. Phys. Chem., 2019, 233, 1325–1349 CrossRef CAS.
- P. Guardia, A. Labarta and X. Batlle, J. Phys. Chem. C, 2011, 115, 390–396 CrossRef CAS.
- P. Fageria, S. Gangopadhyay and S. Pande, RSC Adv., 2014, 4, 24962–24972 RSC.
- H. Xu, B. Yan, K. Zhang, C. Q. Wang, J. T. Zhong, S. M. Li, P. Yang and Y. K. Du, Int. J. Hydrogen Energy, 2017, 42, 11229–11238 CrossRef CAS.
- M. Y. Rafique, L. Q. Pan, Q. U. A. Javed, M. Z. Iqbal and L. H. Yang, J. Nanopart. Res., 2012, 14, 1189 CrossRef.
- W. Wu, M. Lei, S. L. Yang, L. Zhou, L. Liu, X. H. Xiao, C. Z. Jiang and V. A. L. Roy, J. Mater. Chem. A, 2015, 3, 3450–3455 RSC.
- P. S. Rathore, R. Patidar, T. Shripathi and S. Thakore, Catal. Sci. Technol., 2015, 5, 286–295 RSC.
- C. D. De Souza, B. R. Nogueira and M. E. C. M. Rostelato, J. Alloys Compd., 2019, 798, 714–740 CrossRef.
- H. Beygi and S. A. Sajjadi, Mater. Chem. Phys., 2018, 204, 403–409 CrossRef CAS.
- Y. G. Sun and Y. N. Xia, Science, 2002, 298, 2176–2179 CrossRef CAS.
- K. J. Carroll, J. U. Reveles, M. D. Shultz, S. N. Khanna and E. E. Carpenter, J. Phys. Chem. C, 2011, 115, 2656–2664 CrossRef CAS.
- S. Mourdikoudis and L. M. Liz-Marzan, Chem. Mater., 2013, 25, 1465–1476 CrossRef CAS.
- R. S. Ningthoujam, A. Gautam and N. Padma, Phys. Chem. Chem. Phys., 2017, 19, 2294–2303 RSC.
- M. Luty-Blocho, K. Fitzner, V. Hessel, P. Lob, M. Maskos, D. Metzke, K. Paclawski and M. Wojnicki, Chem. Eng. J., 2011, 171, 279–290 CrossRef CAS.
- A. P. Douvalis, R. Zboril, A. B. Bourlinos, J. Tucek, S. Spyridi and T. Bakas, J. Nanopart. Res., 2012, 14, 1130 CrossRef.
- G. N. Glavee, K. J. Klabunde, C. M. Sorensen and G. C. Hadjipanayis, Inorg. Chem., 1995, 34, 28–35 CrossRef CAS.
- J. T. Nurmi, P. G. Tratnyek, V. Sarathy, D. R. Baer, J. E. Amonette, K. Pecher, C. M. Wang, J. C. Linehan, D. E. Matson, R. L. Penn and M. D. Driessen, Environ. Sci. Technol., 2005, 39, 1221–1230 CrossRef CAS PubMed.
- A. Roy, V. Srinivas, S. Ram, J. A. De Toro and U. Mizutani, Phys. Rev. B: Condens. Matter Mater. Phys., 2005, 71, 184443 CrossRef.
- N. B. Nayak, B. B. Nayak and A. Mondal, J. Am. Ceram. Soc., 2013, 96, 3366–3368 CrossRef CAS.
- X. Y. Yang, B. Yang, X. P. Li, Y. Cao and R. H. Yu, J. Alloys Compd., 2015, 651, 551–556 CrossRef CAS.
- B. Yang, Y. Wu, X. P. Li and R. H. Yu, Nanomaterials, 2018, 8, 154 CrossRef PubMed.
- M. Krajewski, M. Tokarczyk, T. Stefaniuk, S. Lewińska and A. Ślawska-Waniewska, IEEE Magn. Lett., 2019, 10, 6108405 CAS.
- M. Krajewski, M. Tokarczyk, A. Witecka, S. Lewińska, A. Ślawska-Waniewska and M. Płocińska, Acta Phys. Pol., A, 2020, 137, 59–61 CrossRef.
- M. Krajewski, M. Tokarczyk, T. Stefaniuk, H. Słomińska, A. Małolepszy, G. Kowalski, S. Lewińska and A. Ślawska-Waniewska, Mater. Chem. Phys., 2020, 246, 122812 CrossRef CAS.
- M. Krajewski, W. S. Lin, H. M. Lin, K. Brzozka, S. Lewinska, N. Nedelko, A. Slawska-Waniewska, J. Borysiuk and D. Wasik, Beilstein J. Nanotechnol., 2015, 6, 1652–1660 CrossRef CAS.
- K. Gandha, P. C. Tsai, G. Chaubey, N. Poudyal, K. Elkins, J. Cui and J. P. Liu, Nanotechnology, 2015, 26, 075601 CrossRef CAS.
- P. Acharya, Z. J. Nelson, M. Benamara, R. H. Manso, S. I. Perez Bakovic, M. Abolhassani, S. Lee, B. Reinhart, J. Chen and L. F. Greenlee, ACS Omega, 2019, 4, 17209–17222 CrossRef CAS.
- M. Z. Wu, G. Q. Liu, M. T. Li, P. Dai, Y. Q. Ma and L. D. Zhang, J. Alloys Compd., 2010, 491, 689–693 CrossRef CAS.
- J. Zhou, Q. Q. Wang, X. D. Hui, Q. S. Zeng, Y. W. Xiong, K. B. Yin, B. A. Sun, L. T. Sun, M. Stoica, W. H. Wang and B. L. Shen, Mater. Des., 2020, 191, 108597 CrossRef CAS.
- B. S. Kadu, Y. D. Sathe, A. B. Ingle, R. C. Chikate, K. R. Patil and C. V. Rode, Appl. Catal., B, 2011, 104, 407–414 CrossRef CAS.
- X. L. Weng, Q. Sun, S. Lin, Z. L. Chen, M. Megharaj and R. Naidu, Chemosphere, 2014, 103, 80–85 CrossRef CAS PubMed.
- C. C. Bao, Q. Q. Niu, X. W. Cao, C. Liu, H. Wang and W. B. Lu, New J. Chem., 2019, 43, 11135–11140 RSC.
- Y. B. Feng and T. Qiu, J. Alloys Compd., 2012, 513, 455–459 CrossRef CAS.
- H. F. Poulsen, J. Neuefeind, H. B. Neumann, J. R. Schneider and M. D. Zeidler, J. Non-Cryst. Solids, 1995, 188, 63–74 CrossRef CAS.
- K. Jurkiewicz, M. Kamiński, W. Glajcar, N. Woźnica, F. Julienne, P. Bartczak, J. Polański, J. Lelątko, M. Zubko and A. Burian, J. Appl. Cryst., 2018, 51, 411–419 CrossRef CAS.
- C. L. Farrow, P. Juhas, J. W. Liu, D. Bryndin, E. S. Božin, J. Bloch, T. Proffen and S. J. L. Billinge, J. Phys.: Condens. Matter, 2007, 19, 335219 CrossRef CAS.
- L. Signorini, L. Pasquini, L. Savini, R. Carboni, F. Boscherini, E. Bonetti, A. Giglia, M. Pedio, N. Mahne and S. Nannarone, Phys. Rev. B: Condens. Matter Mater. Phys., 2003, 68, 195423 CrossRef.
- E. E. Carpenter, S. Calvin, R. M. Stroud and V. G. Harris, Chem. Mater., 2003, 15, 3245–3246 CrossRef CAS.
- C. M. Wang, D. R. Baer, L. E. Thomas, J. E. Amonette, J. Antony, Y. Qiang and G. Duscher, J. Appl. Phys., 2005, 98, 094308 CrossRef.
- Q. F. Liu, J. B. Wang, Z. J. Yan and D. S. Xue, Phys. Rev. B: Condens. Matter Mater. Phys., 2005, 72, 144412 CrossRef.
- G. J. Shu, S. C. Liou, W. C. H. Kuo, C. T. Wu, P. C. Wu, C. J. Klingshirn, J. Kwo and M. H. Hong, AIP Adv., 2020, 10, 105022 CrossRef CAS.
- A. P. Grosvenor, M. C. Biesinger, R. S. Smart and N. S. McIntyre, Surf. Sci., 2006, 600, 1771–1779 CrossRef CAS.
- J. F. Moulder, W. F. Stickle, W. E. Sobol and K. D. Bomben, Handbook of X-ray Photoelectron Spectroscopy, Physical Electronics Inc., Minnesota, 1995 Search PubMed.
- M. C. Biesinger, B. P. Payne, A. P. Grosvenor, L. W. M. Lau, A. R. Gerson and R. S. Smart, Appl. Surf. Sci., 2011, 257, 2717–2730 CrossRef CAS.
- T. Yamashita and P. Hayes, Appl. Surf. Sci., 2008, 254, 2441–2449 CrossRef CAS.
- M. Fondell, M. Gorgoi, M. Boman and A. Lindblad, J. Electron Spectrosc. Relat. Phenom., 2018, 224, 23–26 CrossRef CAS.
- G. H. Yu, C. L. Chai, F. W. Zhu, J. M. Xiao and W. Y. Lai, Appl. Phys. Lett., 2001, 78, 1706–1708 CrossRef CAS.
- X. L. Weng, M. Y. Guo, F. Luo and Z. L. Chen, Chem. Eng. J., 2017, 308, 904–911 CrossRef CAS.
- Q. Zhang, K. Kusada, D. S. Wu, T. Yamamoto, T. Toriyama, S. Matsumura, S. Kawaguchi, Y. Kubota and H. Kitagawa, Nat. Commun., 2018, 9, 510 CrossRef.
- H. Z. Yang, Y. Li, M. Zeng, W. Cao, W. E. Bailey and R. H. Yu, Sci. Rep., 2016, 6, 20427 CrossRef CAS.
- Y. Hong, Y. Rheem, M. Lai, D. M. Cwiertny, S. L. Walker and N. V. Myung, Chem. Eng. J., 2009, 151, 66–72 CrossRef CAS.
- A. S. Masadeh, E. S. Bozin, C. L. Farrow, G. Paglia, P. Juhas, S. J. L. Billinge, A. Karkamkar and M. G. Kanatzidis, Phys. Rev. B: Condens. Matter Mater. Phys., 2007, 76, 115413 CrossRef.
- J. Arai, S. Nagata and M. Shirasaki, J. Magn. Magn. Mater., 1983, 35, 221–222 CrossRef CAS.
Footnote |
| † Electronic supplementary information (ESI) available. See DOI: 10.1039/d1cp04411g |
| This journal is © the Owner Societies 2022 |