Conformational disorder enabled emission phenomena in heavily doped TADF films†
Tomas
Serevičius
 *a,
Rokas
Skaisgiris
 a,
Dalius
Gudeika
 b,
Karolis
Kazlauskas
 a and
Saulius
Juršėnas
a
aInstitute of Photonics and Nanotechnology, Vilnius University, Sauletekio 3, LT-10257 Vilnius, Lithuania. E-mail: tomas.serevicius@tmi.vu.lt
bDepartment of Polymer Chemistry and Technology, Kaunas University of Technology, Radvilenu 19, LT-50254 Kaunas, Lithuania
First published on 23rd November 2021
Abstract
Thermally activated delayed fluorescence (TADF) compounds doped in solid hosts are prone to undergo solvation effects, similar to those in the solution state. Emission peak shifts and changes in emission decay rates usually follow solid-state solvation (SSS). However, here we show that typical SSS behavior in heavily doped TADF films could be of a completely different origin, mistakenly attributed to SSS. Typically, increasing the doping load was found to redshift the emission peak wavelength and enhance the rISC rate. However, more in-depth analysis revealed that SSS actually is negligible and both phenomena are caused by the specific behavior of delayed emission. Increasing the concentration of the TADF compound was shown to enhance the concentration quenching of long-lived delayed fluorescence from conformer states with the largest singlet energy, eventually leading to a gradual redshift of the delayed emission peak wavelength. Concomitantly, the loss of long-lived delayed fluorescence entailed reverse intersystem crossing rate enhancement, though the rate-governing singlet–triplet energy gap was gradually increasing. The observed phenomena are highly unwanted, burdening molecular structure and OLED performance optimization.
Introduction
Thermally activated delayed fluorescence compounds offer an elegant way to retrieve triplet excited states without involving any expensive heavy atoms,1,2 following a simple chemical synthesis3 and providing sufficient chemical stability.4 OLED devices with TADF emitters provide excellent external quantum efficiency, exceeding 30%,5–7 pronounced lifetime8,9 and wide selection of emission color.10,11 The recovery of triplet states in TADF compounds is enabled by minimizing the singlet–triplet energy gap (ΔEST) towards the values comparable to thermal energy at room temperature.2 The most common design approach for lowering ΔEST is based on the separation of molecular frontier orbitals in HOMO and LUMO. This is usually achieved by constructing TADF compounds from electron-donating (D) and electron-accepting (A) units, loosely bound in a nearly perpendicular orientation.2,12 The performance of TADF emitters also depends on how fast the triplet states are retrieved.13 In this case a high reverse intersystem crossing (rISC) rate, besides low ΔEST, also requires low energy splitting between vibronically coupled lowest energy 3CT and 3LE energy levels, when the higher-energy triplet state acts as the mediator.14–17 Therefore, the search for efficient TADF involves the minimization of energy gaps between the lowest energy levels together with the delicate optimization of molecular geometry.18,19The specific molecular structure of TADF compounds, when D and A units are loosely bound, makes their emission properties dependent on the D–A twisting angle. This is not the case in solutions, where the emission occurs within the potential minimum; however, rigid solid-surrounding locks TADF compounds in conformers with different D–A twisting angles, also different S1 energies and ΔEST values.20–26 This conformational disorder results in undesirable effects, such as prolongation of TADF lifetime22,27 or emission energy instability.21 Despite such a sad note, the impact of conformational disorder can be succesully minimized by enhancing the steric hindrance between D and A units,22 when solution-like emission properties are achieved.27
Besides the conformational disorder, another consequence of the specific structure of TADF compounds is the charge-transfer (CT) type of the lowest energy singlet state. CT fluorescence is strongly prone to the polarity of the surrounding, when the CT states are more stabilized in a polar surrounding, leading to the redshift of the emission peak and subsequent changes of emission parameters.28 Solvation is also present in the solid-state (SSS), yet typically in a lower extent, since solid host is less able to reorient and stabilize the CT state.20,29–33 The SSS effect is especially important for TADF compounds, as it potentially opens the ability to lower ΔEST and boost the rISC rate. SSS can be assessed by doping the solid host with a small-molecule dopant having a high ground state dipole moment, for example camphoric anhydrite (CA).31 Cotts et al.29 found that increasing the polarity of a solid-film after doping with CA resulted in a typical SSS behavior, i.e. the decrease of emission energy, lowering of radiative singlet decay rate and diminution of ΔEST. Similar findings were also shown by Haseyama et al.30 SSS is also observed in solid TADF films with different emitter doping concentrations, when the dipole moment of the dopant is significantly larger than that of the host.34 Here, analogous characteristic behavior is observed, as the emission peak shifts or a change in PF and DF quantum yields occur.34–36
Contrary to the case of isolated molecules, increasing doping concentration enables singlet and triplet exciton migration with more pronounced diffusion lengths at higher doping loads.35 This entails an additional concentration quenching pathway of emission lifetime and quantum yield,34,36 especially for delayed fluorescence through enhanced diffusivity of triplet states.35 The nonradiative triplet decay rate through concentration quenching was shown to increase about an order of magnitude in the doping range of 20–100 wt%, diminishing the delayed fluorescence yield.34 Increasing the doping load may also enable spontaneous exciton dissociation, leading to additional emission yield losses, though this mechanism is more pronounced only for TADF compounds with considerable permanent dipole moments.37 Lastly, besides the typical SSS behavior, aggregated molecular states may emerge at higher doping concentrations, which is similar to the SSS effects, namely emission peak shifts and decrease of DF lifetime. However, in this case an emission peak shift occurs due to the emergence of new low-energy emission bands, which dominates at high doping load.38,39 Overall, heavily doped TADF solid films are complex system, where SSS, exciton migration and emergence of molecular aggregates coexist and burden the analysis of emission properties.
In this paper we bring a new standpoint for emission behavior of TADF compounds in heavily doped films with pronounced exciton diffusion. Conformational disorder was shown to entail emission properties typical to SSS. A specific TADF compound was selected, having a rigid molecular core and a low dipole moment, paired with a polymer host having nearly identical polarity. Prompt and delayed fluorescence properties were individually analyzed, revealing distinct emission properties and their dependence on doping concentration. Only delayed fluorescence properties were affected by concentration, though the behavior, despite being entirely typical to SSS, was caused by conformational disorder. Our findings are expected to shed a new light on the analysis of solid-state TADF properties.
Experimental
Synthetic and purification procedures of 5tCzMeB are presented in ref. 40. The photophysical properties of 5tCzMeB were analyzed in PMMA (Sigma-Aldrich) surrounding at 1–100 wt% concentration and 1 wt% Zeonex (ZEON EUROPE GmbH) and DPEPO (Sigma-Aldrich) films. Solid-state films were prepared by dissolving each material and host at appropriate ratios in toluene and then wet-casting the solutions on quartz substrates in air. Absorption spectra were measured using a Lambda 950 UV/Vis spectrophotometer (PerkinElmer). Time-integrated fluorescence spectra (TIFL), prompt and delayed fluorescence spectra (PD and DF, respectively), time-resolved fluorescence spectra (TRPL), and low-temperature phosphorescence spectra (PH) were measured using a nanosecond YAG:Nd3+ laser NT 242 (Ekspla, τ = 7 ns, λ = 340 nm, pulse energy 200 μJ, and repetition rate 1 kHz) and a time-gated iCCD camera New iStar DH340T (Andor). Fluorescence transients were obtained by exponentially increasing delay and integration time.41 Emission intensity at a certain delay time was obtained by integrating all emission spectrum. Photoluminescence excitation spectra were measured using a FLS980 spectrometer (Edinburgh Instruments). Fluorescence quantum yields (ΦFL, ± 5% error) of films in air were estimated using the integrated sphere method42 by integrating a sphere (Sphere Optics) connected to a CCD spectrometer PMA-12 (Hamamatsu) via an optical fiber. Prompt and delayed fluorescence quantum yields were obtained according to ref. 43. All fluorescence decay rates were estimated according to ref. 40. Solid-state samples were mounted on a closed cycle He cryostat (Cryo Industries 204N) for all measurements under oxygen-free conditions.Quantum chemical calculations of the dipole moment of 5tCzMeB were performed by using density functional theory (DFT) as implemented in the Gaussian 09 software package at the B3LYP/6-31G(d) level.44 Polarizable continuum model (PCM) was used to estimate the solvation behavior of toluene surrounding.
Results and discussion
Material selection
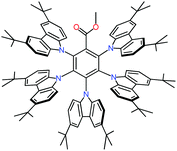
With an aim to showcase the role of conformational disorder in the emission properties of TADF compound in solid hosts at different doping loads, the precise selection of dopant and host was performed. A highly efficient blue-emitting TADF compound 5tCzMeB (2,3,4,5,6-penta(3,6-di-tert-butyl-9H-carbazol-9-yl)methylbenzoate)40 (see Fig. 1) was selected as the dopant and PMMA polymer as the host. 5tCzMeB is constructed from five carbazole (Cz) D units, decorated with tert-butyl (tBt) units at the 3 and 6 positions of Cz, and a methyl benzoate A unit. tBt fragments were crucial in this case, acting as efficient spacers between TADF molecules and inhibiting aggregation, which may be very strong in similar multicarbazole TADF compounds, e.g.4CzIPN.38 Concentration dependent emission properties of an analogous TADF compound without tBt units, namely 5CzCO2Me, were already assesed.33 However, in contrast to our report, no in-depth analysis of conformer states and their impact on emission properties was performed. Moreover, the presence of tBt units in the 5tCzMeB structure additionally guarantees the exclusion of molecular aggregation-based emission pathways and facilitates the analysis of conformational disorder. Furthermore, 5tCzMeB possesses a suitable rigid molecular structure, weakly prone to conformational disorder,22 as evident from the weakly nonexponential lineshape of DF decay transient in solid surrounding.40 A ground state dipole moment of 1.54 D was estimated for 5tCzMeB, similar to that of 5CzCO2Me.33 Nearly identical ground-state dipole moments of 5tCzMeB and PMMA polymer host (1.4 D45) allowed us to minimize the SSS effect20 and concentrate solely on the influence of conformational disorder on emission properties at different doping loads.Concentration dependent emission properties
Absorption and emission spectra of 5tCzMeB dispersed in PMMA at different doping loads are shown in Fig. 2 and part of emission data is given in Table S1 in the ESI.† Absorption spectra of 5tCzMeB showed a typical vibronic pattern with peaks at about 328 and 340 nm, attributed to the tCz unit (blue line in Fig. 2a) and an additional absorption band with peak at around 365 nm, arising from the direct absorption of CT states.33,40 The intensity of the so-called CT band, which was also observed in the absorption spectrum in toluene (orange symbols in Fig. 2a), was higher at higher doping loads. Photoluminescence excitation spectra of 1 wt% and 100 wt% PMMA films were nearly similar to those of absorption spectra (see Fig. S1 in the ESI†).The same trend was observed also for 5CzCO2Me, an analogous compound without tBt units.33 No new low-energy emission band, which could be attributed to any dimer states,38 was observed.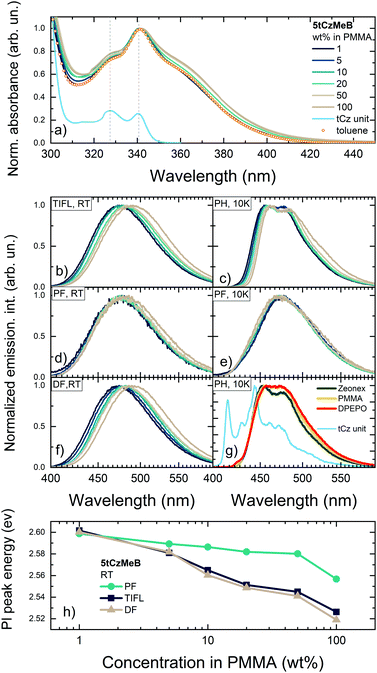 | ||
| Fig. 2 Normalized absorption spectra of 5tCzMeB at different doping concentrations in PMMA (a). Absorption spectra of 5tCzMeB in 10−5 mol L−1 toluene solution and of tCz unit in 1 wt% PMMA (this spectrum was shifted vertically for clarity) are shown for reference. TIFL spectra at room temperature (b), PH spectra at 10 K (c), PF spectra (integration time 0–100 ns) at room temperature (d), PF spectra (integration time 0–100 ns) at 10 K (e) and DF spectra (integration time 100 ns–0.001 s) at room temperature (f) of 5tCzMeB at different doping concentrations in PMMA. PH spectra (integration time 100 μs–0.001 s) of 1 wt% films of 5tCzMeB in Zeonex, PMMA and DPEPO (g). PH spectrum of tCz unit in PMMA is also shown. Dielectric constants of Zeonex, PMMA, and DPEPO were of about 2.25,46 3.447 and 6.12,48 respectively. Peak energies of TIFL, PF and DF of 5tCzMeB at different doping concentrations in PMMA (h). | ||
Time-integrated fluorescence spectra of 5tCzMeB doped in PMMA, on the other hand, showed a gradual redshift of the 1CT emission peak with increasing doping concentration (see Fig. 2b). In this case, fluorescence peaked from about 474 nm for a 1 wt% doped film to nearly 490 nm for a 100 wt% film. An 85 meV redshift was observed, which at the first glance could be attributed to SSS. Nearly identical linewidth of TIFL spectra was observed, when FWHM was constant for 1–50 wt% doped films (see Fig. S1 a in the ESI†) and only a minor increase of FWHM of about 8% was observed for a 100 wt% film. This behavior, on the other hand, could be considered as opposite to that of typical SSS, when the stabilization of the excited states should lead to a more evident increase of FWHM of emission spectra.20,29 Deconstruction of differently doped TIFL spectra of 5tCzMeB into individual ones of prompt and delayed fluorescence revealed some interesting features (see Fig. 2d and f, respectively). Indeed, PF and DF spectra showed different trends with increasing doping load. PF spectra were weakly dependent on the doping concentration, when the emission peak wavelength showed only a minor emission peak redshift (see Fig. 2h) with nearly the same FWHM values though with a bit larger FWHM for 100 wt% doping (see Fig. S2 in the ESI†). On the contrary, DF spectra showed an evident redshift of emission peak wavelength of about 80 meV, following the same pathway as TIFL spectra. Surprisingly, FWHM of DF spectra was almost concentration independent of all doping range; even at 100 wt% an increase of only about 2% was observed (see Fig. S2 in the ESI†). Spectral lineshape of emission spectra of 1 wt% and 100 wt% films were independent on the excitation wavelength, indicating the absence of dimer states38 (see Fig. S3 in ESI†).
Low-temperature phosphorescence spectra of 5tCzMeB at different doping loads (see Fig. 2c) showed a clear vibronic pattern as well as a 60 meV redshift of the emission peak (see Table S1 in the ESI†). The nature of the lowest-energy triplet state of 5tCzMeB probably was of mixed 3LE/3CT character, typically for similar multicarbazole TADF compounds.49 PH spectra of 5tCzMeB were clearly of a different spectral shape from that of the individual tCz unit (see Fig. 2g) or more bulky phenyl-carbazole unit,49 corresponding to the 3LE state of 5tCzMeB49,50 with an energy of about 2.985 eV. PH spectra of 5tCzMeB also showed weak positive solvatochromic behavior in a more polar surrounding (see Fig. 2g), same as CT-like PF spectra in the same hosts though in an evidently lower extent (see Fig. S4 in the ESI†). Therefore, the apparent redshift of PH spectra at higher doping loads hardly could be assigned solely to SSS. The other possible origin could be intermolecular interactions, being more significant at higher doping loads,51 same as those governing the solid-state 1LE fluorescence behavior,52,53 though the nature is still debatable. Same as that at room temperature, the PF peak energy at 10 K was weakly concentration dependent; however, an opposite blueshift of the PF peak of around 13 meV was observed at 10 K. This weak blueshift of the PF peak was likely caused by changes in polymer polarity at lower temperatures.54,55 Therefore, it was hardly possible to draw the reliable potential energy level scheme directly from PF and PH spectra. The actual energy level scheme, obtained from Arrhenius analysis of TADF decay transients, will be presented in the following chapters.
Concentration dependent temporal emission properties: importance of DF quenching
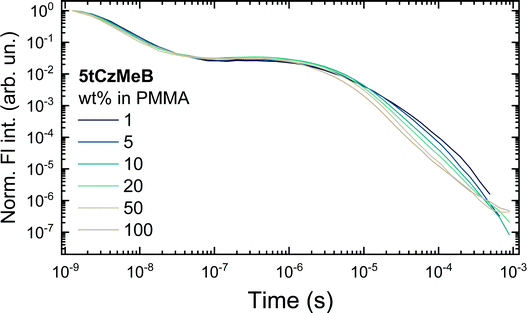
Fluorescence decay transients of 5tCzMeB dispersed in PMMA at various doping loads are shown in Fig. 3 and the corresponding decay rates as well as fluorescence quantum yields are given in Fig. 4 and further details are provided in Table S2 in the ESI.† Two distinct fluorescence decay regions were observed, the initial of prompt fluorescence and the latter of delayed one. The PF decay rate (kPF) was slightly, though consistently, increased from about 2.7 × 10⁸ s−1 for 1 wt% film to 4.1 × 10⁸ s−1 for 100 wt% case. The TADF decay rate was also increasing from about (14.3 μs)−1 to nearly (4.6 μs)−1 at 100 wt% concentration. Only the average values of DF decay constants were obtained due to the multiexponential DF decay temporal profiles, typically for disordered solid-state TADF emission.22 On the other hand, the conformational disorder was rather low, as triexponential DF fits were able to fit the majority of delayed emission.22 An increase in emission decay rates was followed by the decrease of both prompt (ΦPF) and delayed (ΦDF) fluorescence quantum yields. As shown in Fig. 4 and according to ref. 40, rapid ISC was the dominant nonradiative decay pathway for PF and its rate increased with increasing doping load, lowering ΦPF. The radiative decay rate was low, nearly two orders of magnitude lower than kISC, weakly and inconsistently dependent on the doping load, probably due to the somewhat uncertainty in PF share estimation.43 Therefore, kr could be regarded as weakly concentration dependent, having a negligible impact on the variation of ΦPF.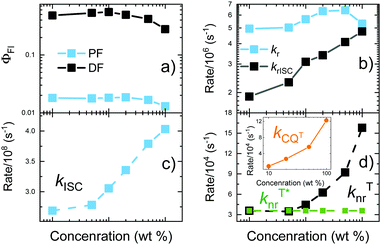 | ||
| Fig. 4 Fluorescence quantum yields (a) and various decay constants (b–d) of 5tCzMeB at different doping concentrations in PMMA. | ||
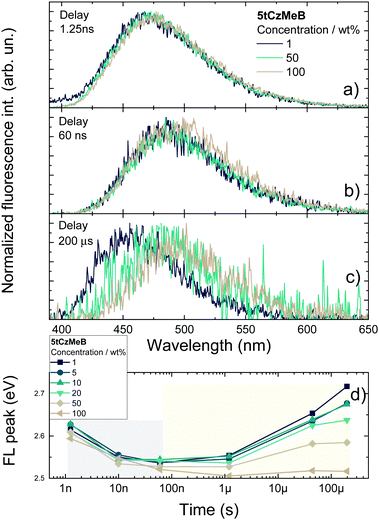
Delayed fluorescence quantum yield was decreasing from 0.48 at 1 wt% load to 0.28 at 100 wt%. This is a typical concentration quenching behavior,34,35 when the increasing doping concentration enabled long-lived triplet exciton migration35 and simultaneously enhanced migration-induced quenching at nonradiative decay centers. It was evidenced by an obvious increase of the nonradiative triplet decay rate (knrT) by 4.4 times from about 3.6 × 10⁴ s−1 at 1 wt% load to 16.0 × 10⁴ s−1 at 100 wt% concentration. Actually, knrT could be regarded as the sum of two independent processes, namely knrT*, which is the internal conversion to S0 and should be weakly concentration dependent (knrT* for 5tCzMeB in PMMA is about 3.6 × 10⁴ s−1), and kCQT, which represents an increasing triplet nonradiative decay rate through concentration quenching.34 If knrT* is assumed as concentration independent, then the diffusion-enabled kCQT is estimated to range at 0.9–12.2 × 10⁴ s−1 for 10–100 wt% films (see inset in Fig. 4d). The pronounced increase of kCQT by about 14 times clearly was responsible for ΦDF decrease at a higher doping load. Moreover, the corresponding kCQT values for 5tCzMeB were evidently lower than those of a similar compound 4CzIPN without tBt units, evidencing a weaker concentration quenching behavior.34 On the other hand, knrT* was almost identical due to a similar molecular structure (6.26 × 10⁴ s−1vs. 3.6 × 10⁴ s−1 for 4CzIPN and 5tCzMeB, respectively).
Despite the decrease of ΦDF, the rISC rate was evidently increased from about 1.9 × 10⁶ s−1 at 1 wt% to nearly 4.8 × 10⁶ at 100 wt% doping load, following the increase of the DF decay rate (see Table S2 in the ESI†). To analyze the alteration fluorescence decay rates in more detail, activation energies of ISC (EAISC) and rISC (EArISC) were also extracted from Arrhenius plots of ISC and rISC rates at different temperatures (see Fig. S5 in the ESI†). EAISC decreased from about 10 meV at 1 wt% doping load to about 7.6 meV at 100 wt%, while EArISC increased from about 65 meV to 74 meV, respectively. As the decrease of EAISC was in-line with the increase of the ISC rate at the higher doping loads, the observed increase of EArISC contradicted with the higher rISC rate at higher doping loads. In fact, concentration quenching of the long-lived DF from TADF-inefficient conformer states was responsible for rISC rate enhancement at higher doping concentrations. The comprehensive analysis of time-resolved fluorescence (TRPL) spectra of variously doped PMMA films of 5tCzMeB (see Fig. 5 and Fig. S6 in the ESI†) clearly evidenced the role of conformational disorder in the rISC rate increase as well as in DF spectral shifts at high doping loads.
TRPL spectra of 5tCzMeB in 1–100 wt% doped PMMA films showed typical behavior for TADF compounds embedded in solid hosts.20,22,23 Indeed, different molecules of 5tCzMeB are “frozen” with various D–A twisting angles, having different S1 energies, ΔEST values, and rISC rates.20 Initially, strong emission from conformer states with high S1 energy and large ΔEST is observed, followed by emission from the states with lower singlet energies and therefore lower singlet–triplet gaps, enabling the redshift of PF. On the contrary, conformers with the lowest singlet energy and also low ΔEST show the most rapid initial DF, followed by slower delayed emission decay from conformers with higher S1 energy, leading to the blueshift of DF. In the case of 5tCzMeB, a redshift of the PF peak for about 100 meV was observed during the first ∼100 ns. Conformational disorder was of similar size for all doping loads as the PF peak shifts were independent of the doping concentration22 (grey area in Fig. 5d). Although the time-resolved PF spectra were concentration-independent, the DF spectra showed an obvious dependence on the doping load (yellow area in Fig. 5d). Area-normalized spectra of 1 wt% and 100 wt% films of 5tCzMeB showed the absence of dimer states38 (see Fig. S7 in the ESI†). Temporal shifts of prompt and delayed emission were of a similar size only at a low doping load (1–10 wt%). This was the typical behavior of rigid TADF compounds with a negligible conformational disorder.22,26,27 Increasing concentration of 5tCzMeB in the PMMA film enabled the triplet exciton migration and subsequent enhancement of the triplet quenching rate (see Fig. 4d). As shown in Fig. 5c, DF originating only from TADF-inefficient conformer states with the highest S1 energy and lowest rISC rate was strongly quenched at higher doping loads. The disappearance of TADF with the longest DF lifetime resulted in a shortened TADF decay time and enlarged rISC rate, as shown in Fig. 4 and Table S2 in the ESI.† Only the delayed fluorescence, arising from the most TADF-efficient conformer states, similar to those in solution,40 was observed in 100 wt% PMMA film, leading to a high rISC rate though at the cost of evidently lower DF quantum yield. Therefore, the concentration-quenching of TADF-inefficient conformer states led to an increase in the rISC rate at higher doping loads, despite the higher ΔEST.
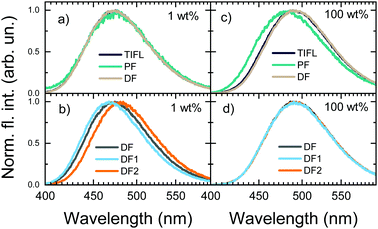
Moreover, the disappearance of conformer states with the lowest krISC and therefore the highest S1 energy also was the cause of the redshift of TIFL spectra, see Fig. 6. TIFL, PF and DF spectra were identical for 1 wt% PMMA film of 5tCzMeB, accounting for emission from all conformer states (see Fig. 6a). Moreover, the initial DF spectrum (DF1, integration time of 100 ns–4 μs) peaked at a higher energy than the latter DF spectrum (DF2, integration time of 4 μs–1 ms) since the DF from full set of conformer states with different S1 energies and different lifetimes was observed (see Fig. 6b). However, in the case of 100 wt% film, DF lacking a part of conformer states with the highest S1 energy peaked at a lower energy than PF, resulting in the redshift of TIFL (black line in Fig. 6c), which may look like typical SSS. In this case, both DF1 and DF2 spectra peaked at the same wavelength, as identical conformer states exhibiting only the lowest ΔEST and lowest S1 energies were observed. Therefore, neat film of TADF compounds may look like a homogeneous system with low dispersion of singlet–triplet gaps26 and rapid rISC, as krISC exponentially depends on ΔEST, namely  ;56 however, the lack of a large part of emission from TADF-inefficient conformer states diminishes the emission yield and enables emission color changes.
Conclusions
To sum up, concentration-dependent emission properties of a TADF compound 5tCzMeB were assessed, showcasing the unexpected overall role of triplet migration and conformational disorder. 5tCzMeB was embedded in a PMMA host having a nearly identical dipole moment, minimizing the role of solid-state solvation and allowing to analyze solely the concentration effects. Delayed fluorescence was shown to control the emission properties through conformational disorder. Increasing the doping load was shown to enable efficient concentration quenching of triplet states with the longest lifetime. It was found to have two main consequences: redshift of florescence peak and rISC rate enhancement. The presence of conformational disorder was shown to enable typical temporal emission peak shifts and subsequent prolongation of the TADF decay time. As concentration quenching was more pronounced for long-lived delayed fluorescence, increasing the doping load was shown to eliminate solely the emission from the conformer states with the highest S1 energy and the lowest rISC rate. The loss of high-energy and long-lived delayed emission led to the redshift of time-integrated fluorescence and subsequent increase of the rISC rate at higher doping concentrations, yet at the cost of lower fluorescence quantum yield. This behavior may look like typical positive solid-state solvation; however, it was caused solely by concentration quenching of long-lived triplet excitons.Therefore, emission properties of heavily doped solid films of TADF compounds are highly complex, where conformational disorder, solid-state solvation and concentration quenching strongly interact and it is rather difficult to separate the impact of each phenomenon. Again, conformational disorder was shown to introduce some unexpected emission effects, impeding the analysis and optimization of the molecular structure. Therefore, the diminution of conformational disorder should be regarded as a crucial step in further design of TADF compounds.
Conflicts of interest
There are no conflicts to declare.Acknowledgements
The research was funded by the European Social Fund (Project No. 09.3.3-LMT-K-712-01-0084) under a grant agreement with the Research Council of Lithuania (LMTLT). Fruitful discussions with dr. Gediminas Kreiza facilitated the interpretation of results.References
- A. Endo, M. Ogasawara, A. Takahashi, D. Yokoyama, Y. Kato and C. Adachi, Adv. Mater., 2009, 21, 4802–4806 CrossRef CAS PubMed
.
- H. Uoyama, K. Goushi, K. Shizu, H. Nomura and C. Adachi, Nature, 2012, 492, 234–238 CrossRef CAS
.
- I. Marghad, D. H. Kim, X. Tian, F. Mathevet, C. Gosmini, J.-C. Ribierre and C. Adachi, ACS Omega, 2018, 3, 2254–2260 CrossRef CAS
.
- C. Cheng, Y. Jiang, H. Wang, W. Lou, Y. Zhu, C. Deng, D. Wang, T. Tsuboi, G. Li and Q. Zhang, J. Mater. Chem. C, 2021, 9, 3088–3095 RSC
.
- T.-L. Wu, M.-J. Huang, C.-C. Lin, P.-Y. Huang, T.-Y. Chou, R.-W. Chen-Cheng, H.-W. Lin, R.-S. Liu and C.-H. Cheng, Nat. Photonics, 2018, 12, 235–240 CrossRef CAS
.
- T.-A. Lin, T. Chatterjee, W.-L. Tsai, W.-K. Lee, M.-J. Wu, M. Jiao, K.-C. Pan, C.-L. Yi, C.-L. Chung, K.-T. Wong and C.-C. Wu, Adv. Mater., 2016, 28, 6976–6983 CrossRef CAS
.
- L.-S. Cui, A. J. Gillett, S.-F. Zhang, H. Ye, Y. Liu, X.-K. Chen, Z.-S. Lin, E. W. Evans, W. K. Myers, T. K. Ronson, H. Nakanotani, S. Reineke, J.-L. Bredas, C. Adachi and R. H. Friend, Nat. Photonics, 2020, 14, 636–642 CrossRef CAS
.
- N. B. Kotadiya, P. W. M. Blom and G.-J. A. H. Wetzelaer, Nat. Photonics, 2019, 13, 765–769 CrossRef CAS
.
- W. J. Chung, K. H. Lee, M. Jung, K. M. Lee, H. C. Park, M. Eum and J. Y. Lee, Adv. Opt. Mater., 2021, 9, 2100203 CrossRef CAS
.
- G. Hong, X. Gan, C. Leonhardt, Z. Zhang, J. Seibert, J. M. Busch and S. Bräse, Adv. Mater., 2021, 33, 2005630 CrossRef CAS
.
- M. Y. Wong and E. Zysman-Colman, Adv. Mater., 2017, 29, 1605444 CrossRef
.
- A. Endo, K. Sato, K. Yoshimura, T. Kai, A. Kawada, H. Miyazaki and C. Adachi, Appl. Phys. Lett., 2011, 98, 083302 CrossRef
.
- M. Inoue, T. Serevičius, H. Nakanotani, K. Yoshida, T. Matsushima, S. Juršėnas and C. Adachi, Chem. Phys. Lett., 2016, 644, 62–67 CrossRef CAS
.
- J. Gibson, A. P. Monkman and T. J. Penfold, Chem. Phys. Chem., 2016, 17, 2956–2961 CrossRef CAS PubMed
.
- M. K. Etherington, J. Gibson, H. F. Higginbotham, T. J. Penfold and A. P. Monkman, Nat. Commun., 2016, 7, 13680 CrossRef PubMed
.
- D. de Sa Pereira, C. Menelaou, A. Danos, C. Marian and A. P. Monkman, J. Phys. Chem. Lett., 2019, 10, 3205–3211 CrossRef CAS PubMed
.
- E. W. Evans, Y. Olivier, Y. Puttisong, W. K. Myers, T. J. H. Hele, S. M. Menke, T. H. Thomas, D. Credgington, D. Beljonne, R. H. Friend and N. C. Greenham, J. Phys. Chem. Lett., 2018, 9, 4053–4058 CrossRef CAS PubMed
.
- J. S. Ward, R. S. Nobuyasu, A. S. Batsanov, P. Data, A. P. Monkman, F. B. Dias and M. R. Bryce, Chem. Commun., 2016, 52, 2612–2615 RSC
.
- M. Hempe, N. A. Kukhta, A. Danos, M. A. Fox, A. S. Batsanov, A. P. Monkman and M. R. Bryce, Chem. Mater., 2021, 33, 3066–3080 CrossRef CAS
.
- T. Northey, J. Stacey and T. J. Penfold, J. Mater. Chem. C, 2017, 5, 11001–11009 RSC
.
- T. Serevičius, R. Skaisgiris, J. Dodonova, L. Jagintavičius, J. Bucevičius, K. Kazlauskas, S. Jursenas and S. Tumkevicius, Chem. Commun., 2019, 55, 1975–1978 RSC
.
- T. Serevičius, R. Skaisgiris, J. Dodonova, K. Kazlauskas, S. Jursenas and S. Tumkevicius, Phys. Chem. Chem. Phys., 2020, 22, 265–272 RSC
.
- S. Weissenseel, N. A. Drigo, L. G. Kudriashova, M. Schmid, T. Morgenstern, K.-H. Lin, A. Prlj, C. Corminboeuf, A. Sperlich, W. Brütting, M. K. Nazeeruddin and V. Dyakonov, J. Phys. Chem. C, 2019, 123, 27778–27784 CrossRef CAS
.
- S.-J. Woo, Y.-H. Ha, Y.-H. Kim and J.-J. Kim, J. Mater. Chem. C, 2020, 8, 12075–12084 RSC
.
- S.-J. Woo and J.-J. Kim, J. Phys. Chem. A, 2021, 125, 1234–1242 CrossRef CAS
.
- K. Stavrou, L. G. Franca and A. P. Monkman, ACS Appl. Electron. Mater., 2020, 2, 2868–2881 CrossRef CAS PubMed
.
- T. Serevičius, R. Skaisgiris, I. Fiodorova, G. Kreiza, D. Banevičius, K. Kazlauskas, S. Tumkevičius and S. Juršėnas, J. Mater. Chem. C, 2021, 9, 836–841 RSC
.
- R. Ishimatsu, S. Matsunami, K. Shizu, C. Adachi, K. Nakano and T. Imato, J. Phys. Chem. A, 2013, 117, 5607–5612 CrossRef CAS
.
- B. L. Cotts, D. G. McCarthy, R. Noriega, S. B. Penwell, M. Delor, D. D. Devore, S. Mukhopadhyay, T. S. De Vries and N. S. Ginsberg, ACS Energy Lett., 2017, 2, 1526–1533 CrossRef CAS
.
- S. Haseyama, A. Niwa, T. Kobayashi, T. Nagase, K. Goushi, C. Adachi and H. Naito, Nanoscale Res. Lett., 2017, 12, 268 CrossRef PubMed
.
- C. F. Madigan and V. Bulović, Phys. Rev. Lett., 2003, 91, 247403 CrossRef
.
- M. Delor, D. G. McCarthy, B. L. Cotts, T. D. Roberts, R. Noriega, D. D. Devore, S. Mukhopadhyay, T. S. De Vries and N. S. Ginsberg, J. Phys. Chem. Lett., 2017, 8, 4183–4190 CrossRef CAS
.
- P. Imbrasas, R. Lygaitis, P. Kleine, R. Scholz, C. Hänisch, S. Buchholtz, K. Ortstein, F. Talnack, S. C. B. Mannsfeld, S. Lenk and S. Reineke, Adv. Opt. Mater., 2021, 2002153 CrossRef CAS
.
- H. S. Kim, S.-R. Park and M. C. Suh, J. Phys. Chem. C, 2017, 121, 13986–13997 CrossRef CAS
.
- S. M. Menke and R. J. Holmes, J. Phys. Chem. C, 2016, 120, 8502–8508 CrossRef CAS
.
- J. Lee, N. Aizawa, M. Numata, C. Adachi and T. Yasuda, Adv. Mater., 2017, 29, 1604856 CrossRef
.
- T. Yamanaka, H. Nakanotani and C. Adachi, Nat. Commun., 2019, 10, 5748 CrossRef CAS
.
- M. K. Etherington, N. A. Kukhta, H. F. Higginbotham, A. Danos, A. N. Bismillah, D. R. Graves, P. R. McGonigal, N. Haase, A. Morherr, A. S. Batsanov, C. Pflumm, V. Bhalla, M. R. Bryce and A. P. Monkman, J. Phys. Chem. C, 2019, 123, 11109–11117 CrossRef CAS PubMed
.
- L. Salah, M. K. Etherington, A. Shuaib, A. Danos, A. A. Nazeer, B. Ghazal, A. Prlj, A. T. Turley, A. Mallick, P. R. McGonigal, B. F. E. Curchod, A. P. Monkman and S. Makhseed, J. Mater. Chem. C, 2021, 9, 189–198 RSC
.
- G. Kreiza, D. Banevičius, J. Jovaišaitė, K. Maleckaitė, D. Gudeika, D. Volyniuk, J. V. Gražulevičius, S. Juršėnas and K. Kazlauskas, J. Mater. Chem. C, 2019, 7, 11522–11531 RSC
.
- C. Rothe and A. P. Monkman, Phys. Rev. B: Condens. Matter Mater. Phys., 2003, 68, 075208 CrossRef
.
- J. C. de Mello, H. F. Wittmann and R. H. Friend, Adv. Mater., 1997, 9, 230–232 CrossRef CAS
.
- T. Serevičius, R. Skaisgiris, G. Kreiza, J. Dodonova, K. Kazlauskas, E. Orentas, S. Tumkevičius and S. Juršėnas, J. Phys. Chem. A, 2021, 125, 1637–1641 CrossRef PubMed
.
-
M. J. Frisch, G. W. Trucks, H. B. Schlegel, G. E. Scuseria, M. A. Robb, J. R. Cheeseman, G. Scalmani, V. Barone, B. Mennucci, G. A. Petersson, H. Nakatsuji, M. Caricato, X. Li, H. P. Hratchian, A. F. Izmaylov, J. Bloino, G. Zheng, J. L. Sonnenberg, M. Hada, M. Ehara, K. Toyota, R. Fukuda, J. Hasegawa, M. Ishida, T. Nakajima, Y. Honda, O. Kitao, H. Nakai, T. Vreven, J. A. Montgomery Jr., J. E. Peralta, F. Ogliaro, M. Bearpark, J. J. Heyd, E. Brothers, K. N. Kudin, V. N. Staroverov, T. Keith, R. Kobayashi, J. Normand, K. Raghavachari, A. Rendell, J. C. Burant, S. S. Iyengar, J. Tomasi, M. Cossi, N. Rega, J. M. Millam, M. Klene, J. E. Knox, J. B. Cross, V. Bakken, C. Adamo, J. Jaramillo, R. Gomperts, R. E. Stratmann, O. Yazyev, A. J. Austin, R. Cammi, C. Pomelli, J. W. Ochterski, R. L. Martin, K. Morokuma, V. G. Zakrzewski, G. A. Voth, P. Salvador, J. J. Dannenberg, S. Dapprich, A. D. Daniels, O. Farkas, J. B. Foresman, J. V. Ortiz, J. Cioslowski and D. J. Fox, Gaussian 09, Gaussian, Inc., Wallingford, CT, 2013 Search PubMed
.
- M. Shima, M. Sato, M. Atsumi and K. Hatada, Polym. J., 1994, 26, 579–585 CrossRef CAS
.
- R. S. Nobuyasu, Z. Ren, G. C. Griffiths, A. S. Batsanov, P. Data, S. Yan, A. P. Monkman, M. R. Bryce and F. B. Dias, Adv. Opt. Mater., 2016, 4, 597–607 CrossRef CAS
.
- V. K. Thakur, D. Vennerberg, S. A. Madbouly and M. R. Kessler, RSC Adv., 2014, 4, 6677 RSC
.
- E. Skuodis, O. Bezvikonnyi, A. Tomkeviciene, D. Volyniuk, V. Mimaite, A. Lazauskas, A. Bucinskas, R. Keruckiene, G. Sini and J. V. Grazulevicius, Org. Electron., 2018, 63, 29–40 CrossRef CAS
.
- T. Hosokai, H. Matsuzaki, H. Nakanotani, K. Tokumaru, T. Tsutsui, A. Furube, K. Nasu, H. Nomura, M. Yahiro and C. Adachi, Sci. Adv., 2017, 3, e1603282 CrossRef PubMed
.
- H. Noda, H. Nakanotani and C. Adachi, Sci. Adv., 2018, 4, eaao6910 CrossRef
.
- I. A. Wright, A. Danos, S. Montanaro, A. S. Batsanov, A. P. Monkman and M. R. Bryce, Chem. – Eur. J., 2021, 27, 6545–6556 CrossRef CAS
.
- T. Serevičius, P. Adomėnas, O. Adomėnienė, K. Karpavičius, J. Bucevičius, R. Komskis, G. Kreiza, V. Jankauskas, K. Kazlauskas and S. Juršėnas, Dyes Pigm., 2015, 122, 147–159 CrossRef
.
- V. Sivamurugan, K. Kazlauskas, S. Jursenas, A. Gruodis, J. Simokaitiene, J. V. Grazulevicius and S. Valiyaveettil, J. Phys. Chem. B, 2010, 114, 1782–1789 CrossRef CAS
.
- N. Ghoneim, Y. Rohner and P. Suppan, Faraday Discuss. Chem. Soc., 1988, 86, 295 RSC
.
- P. Suppan, J. Photochem. Photobiol., A, 1990, 50, 293–330 CrossRef CAS
.
- F. B. Dias, T. J. Penfold and A. P. Monkman, Methods Appl. Fluoresc., 2017, 5, 012001 CrossRef
.
Footnote |
| † Electronic supplementary information (ESI) available. See DOI: 10.1039/d1cp04905d |
| This journal is © the Owner Societies 2022 |

