 Open Access Article
pH dependent sensitization of europium in a hydrogen bonded three-dimensional metal–organic compound with (4966)2(4462)3 topology: luminescence titration and time-resolved studies†
Pooja
Daga
 a,
Sayani
Hui
 b,
Sourav
Sarkar
b,
Prakash
Majee
b,
Sourav
Sarkar
b,
Prakash
Majee
 a,
Debal Kanti
Singha
 ab,
Partha
Mahata
 *b and
Sudip Kumar
Mondal
 *a
*a
aDepartment of Chemistry, Siksha-Bhavana, Visva-Bharati University, Santiniketan-731235, West Bengal, India. E-mail: sudip.mondal@visva-bharati.ac.in
bDepartment of Chemistry, Jadavpur University, Jadavpur, Kolkata-700 032, West Bengal, India. E-mail: parthachem@gmail.com
First published on 24th November 2021
Abstract
A rare-earth-based metal–organic compound (MOC), [Y2(pydc)6(H2pip)3]·20H2O (pydc = 2,6-pyridine dicarboxylate, H2pip = diprotonated piperazine), (1), was prepared by a hydrothermal technique using 2,6-pyridine dicarboxylic acid, piperazine, and Y(III) ions. Applying the same procedure, an isomorphous compound of europium-doped rare-earth-based MOC, [Y1.6Eu0.4(pydc)6(H2pip)3]·20H2O (1a) was prepared. Single-crystal X-ray diffraction analysis of 1 indicated a three-dimensional hydrogen bonded binodal structure with (4966)2(4462)3 topology. Upon excitation at 280 nm, 1a showed an intense red emission, which resulted from the efficient energy flow from the excited pydc ligand to the Eu center. The efficiency of energy flow has been tuned by changing the pH of the medium. With the increase in pH, sensitization becomes more and more efficient. Compound 1a remains stable in the wide pH range 2–11, and the Eu-centered luminescence turn-on showed a linear increase from pH 2 to 7. The steady-state pH-dependent luminescence response and the lifetime decay analysis of both the ligand and metal-centered emission were performed to understand the mechanism of sensitization and its pH dependence. The stepwise deprotonation of the carboxylate oxygen was found to be responsible for the linear increase of luminescence intensity. A huge increase of the luminescence intensity at pH 11 was observed due to the breaking of the Eu–oxygen bond, which facilitated the sensitization of the Eu center via the Eu–N bond with the pydc ligand and that probably provided highly favorable geometry for excited state energy flow.
Introduction
Metal–organic compounds (MOCs), constructed by the self-assembly of metal ions or clusters and functionalized ligands, are a rapid research topic in a wide area.1 MOCs possess excellent inbuilt properties, including active site, designable structure, high thermal and chemical stability.2,3 MOCs are widely applied in catalysis,4,5 gas storage and separation,6 adsorption,7 light-emitting devices,8 drug-delivery,9 proton conductivity,10,11 magnetism,12 and sensing.11,13–19 MOCs exhibit fascinating optical properties, and based on the intense photoluminescent property, lanthanide MOCs (LnMOCs) stand out in a leading role for their numerous advantages such as characteristic and sharp emission, large Stokes shift, high quantum yield, long-lived emission, and high color purity.20,21 LnMOCs are prepared to focus on the organic ligands as they act as a photosensitizer to overcome the low absorption efficiency of forbidden f–f transition.21,22 Nowadays, rare-earth metals with doped lanthanide ions serve as a versatile tool to generate enhanced luminescent features. Based on these luminescent LnMOCs, the sensing of specific analytes has gained enormous priority in the last years.23,24pH is one of the most fundamental parameters of an aqueous solution for the analysis of the quality of water and is widely used in industrial, agricultural, environmental, and biomedical fields.25,26 A minor fluctuation in pH can destroy many plants and animals, thus causing an adverse effect in the environment. It also causes severe damage to biological cells and gives rise to cancer, hypertension, diabetes, stroke, etc.27 pH is also a good signal of cell metabolism.18,28,29 The general instrument for the measurement of pH is the pH meter.30 Various traditional techniques have been applied for the determination of pH, namely, voltammetry, potentiometry, proton-permeable microelectrodes, amperometry, and so on.31,32 But, these methods have some disadvantages such as tedious sample preparation, shortage of high impedance, less accurate data, long response-time, and complicated devices.33 Excluding the electrochemical methods, the luminescence detection method is one of the finest methods for pH sensing as it maintains superior selectivity and sensitivity, quick response time, easy manipulation, exact outcome, etc.34,35
To date, MOC nanocomposites,36 carbon dot encapsulated MOCs,37 core–shell silica nanoparticles,38 graphene quantum dots,39 silver nanoclusters,40 and MOCs have been reported for sensing of pH.18,41–45 As pure LnMOCs undergo self-quenching, it is still challenging to detect pH through the naked eye. Recognition of pH is considered a thought-provoking research topic for luminescent materials, and the prior interest is to figure out the specific mechanism. It is very much demanding to determine the detailed mechanism behind the pH sensing of MOCs in variable ranges considering their structures. In this contribution, we have synthesized a rare-earth-based MOC, [Y2(pydc)6(H2pip)3]·20H2O, 1 by employing 2,6-pyridine dicarboxylic acid and piperazine as organic ligands by a hydrothermal procedure. Single-crystal X-ray diffraction analysis of 1 showed three-dimensional hydrogen bonded binodal structure comprising trigonal prism and square planar nodes with (4966)2(4462)3 topology. An isomorphous compound, [Y1.6Eu0.4(pydc)6(H2pip)3]·20H2O, 1a was also prepared by doping 20% of europium ion into 1 for the visible detection of pH where the self-quenching is minimized by increasing the distance between emitting centers. Compound 1a is soluble in water. The ligand sensitized metal-centered red emission of 1a was utilized for the recognition of pH dependent sensitization efficiency resulting in strong luminescence and the color change. The synthesis procedure, structural description, characterization, and the pH sensing ability of 1a with mechanism was explored in detail using both steady-state luminescence and excited state lifetime data.
Experimental
Materials
All the chemicals are commercially available and used as received without further purification. 2,6-Pyridine dicarboxylic acid (H2pydc) (Alfa Aesar, 98%), piperazine (pip) (Spectrochem, 98%), Y(NO3)2·6H2O (Sigma Aldrich, 99.8%), and Eu(NO3)2·6H2O (Alfa Aesar, 99.9%) were used for the synthesis. Doubly distilled water was utilized throughout the entire experiment.Synthesis procedure of 1
Single-crystal of 1 suitable for X-ray analysis was prepared by hydrothermal technique. A mixture of Y(NO3)2·6H2O (0.3 mmol, 0.1151 g), 2,6-pyridine dicarboxylic acid (0.9 mmol, 0.1503 g), piperazine (0.9 mmol, 0.0791 g), and distilled water (5 mL) was stirred well at room temperature for 1 h. This solution mixture was sealed in a 15 mL Teflon-lined stainless-steel reactor and heated at 170 °C for 72 h. Subsequently, the mixture was cooled to room temperature, and the obtained yellowish-brown crystals were collected, filtered, washed with distilled water several times, and air-dried.Synthesis procedure of 1a
An isomorphous europium-doped compound was prepared from a mixture of 2,6-pyridine dicarboxylic acid (0.9 mmol, 0.1503 g), piperazine (0.9 mmol, 0.0791 g), Y(NO3)2·6H2O (0.24 mmol, 0.0921 g), Eu(NO3)2·6H2O (0.06 mmol, 0.0267 g), and distilled water (5 mL). The mixture was stirred well at room temperature for 1 h and then sealed in a 15 mL Teflon-lined stainless-steel reactor and heated at 170 °C for 72 h. After that, the mixture was cooled to room temperature, and the obtained yellowish-brown crystals were collected, filtered, washed with distilled water several times, and air-dried.Instrumentation and characterization techniques
Initial characterizations were performed using single-crystal X-ray diffraction, powder X-ray diffraction (PXRD), thermogravimetric analysis (TGA), Fourier transform infrared spectroscopy (FTIR), scanning electron microscopy (SEM), energy dispersive X-ray analysis (EDX), and elemental mapping analysis. Bruker AXS smart Apex CCD diffractometer was utilized for the single-crystal X-ray diffraction analysis. Powder X-ray diffraction patterns were recorded at room temperature on a Rigaku SmartLab X-ray diffractometer equipped with Cu Kα radiation (λ = 1.5406 Å). Thermogravimetric analysis (TGA) was depicted on a TA Discovery SDT 650 DSC/TGA instrument in a nitrogen atmosphere (flow rate = 20 mL min−1) at a heating rate of 20 °C min−1 at a temperature range of 40 to 900 °C. FTIR spectra were collected in the range of 4000–600 cm−1 involving an IRAffinity-1S Fourier transform infrared spectrophotometer, Shimadzu. Field emission scanning electron microscopy (FE-SEM) and energy dispersive analysis of X-rays (EDX) were executed on Zeiss GeminiSEM 450 field emission scanning electron microscope. UV-Vis spectra were measured on a Shimadzu UV 3101PC spectrophotometer. Hitachi F-7100 spectrofluorimeter was utilized for recording the photoluminescence spectra using a Xenon lamp as an excitation source. The spectra of the sample solution were taken with excitation and emission slit width of 5 nm and photomultiplier voltage of 700 V. The cut-off filter was set at 420 nm to exclude the ligand center luminescence.Crystallographic study
The crystal data of 1 were collected at room temperature by using Bruker AXS smart Apex CCD diffractometer with graphite-monochromatic Mo Kα radiation (λ = 0.71073 Å). A good-quality single-crystal was selected under a polarising microscope and glued to thin glass fibre. The crystal data were obtained using ω scan width of 0.3°. A total of 606 frames were collected in three different settings of ϕ (0, 90, 180°) by keeping the sample-to-detector distance fixed at 6.03 cm and the detector position (2θ) fixed at −25°. The data were reduced using SAINTPLUS,46 and semi-empirical absorption corrections were applied using SADABS.47 The structure was solved by direct methods and refined using the SHELXS-9748 program present in the WinGx suite of programs (Version1.63.04a).49 All the hydrogen atoms of the carboxylic acids and the bound water molecules were initially located in the difference Fourier maps, and for the final refinement, the hydrogen atoms were placed in geometrically ideal positions and held in the riding mode. Final refinement included atomic positions for all the atoms, anisotropic thermal parameters for all the non-hydrogen atoms, and isotropic thermal parameters for all the hydrogen atoms. Full matrix least-squares refinement against |F2| was performed using the WinGx package of programs. Due to the presence of disordered oxygen atoms, the hydrogen atoms of water molecules have not been located. Details of the crystal parameter data collection and structure refinement parameters are summarized in Table 1. CCDC 2091656 contains the crystallographic data for 1.†| R 1 = ∑‖F0| − |Fc‖/∑|F0|; wR2 = {∑[w(F02 − Fc2)2]/∑[w(F02)2]}1/2. w = 1/[σ2(F0)2 + (aP)2 + bP], P = [max(F02, 0) + 2(Fc)2]/3, where a = 0.0789 and b = 1.6303. | |
|---|---|
| Empirical formula | C9H9N2O7.33Y0.33 |
| Formula weight | 292.15 |
| Crystal system | Trigonal |
| Space group |
P![[3 with combining macron]](https://www.rsc.org/images/entities/char_0033_0304.gif) (no. 147) (no. 147) |
| a (Å) | 14.8692(13) |
| b (Å) | 14.8692(13) |
| c (Å) | 10.1692(9) |
| α (deg) | 90 |
| β (deg) | 90 |
| γ (deg) | 120 |
| Volume (Å3) | 1947.1(4) |
| Z | 6 |
| T (K) | 273(2) |
| ρ calc (g cm−3) | 1.495 |
| μ (mm−1) | 1.588 |
| θ range (deg) | 2.552 to 27.109 |
| λ (Mo Kα) (Å) | 0.71073 |
| R indices [I > 2σ(I)] | R 1 = 0.0430, wR2 = 0.1412 |
| R indices (all data) | R 1 = 0.0458, wR2 = 0.1432 |
Preparation of the sample solution
The crystals of 1a were ground into a powdered form using a mortar and pestle. The sample solution was prepared by taking 1.5 mg of 1a in 3 mL double-distilled water and ultra-sonicated for 5 min. The luminescence titration experiments were performed at room temperature using 50 μL of the above stock solution taken in 2 mL of water into a quartz cuvette.Luminescence lifetime decay measurements
HORIBA Jobin Yvon instrument was used to monitor the time-correlated single-photon counting (TCSPC) measurements. The experiments were carried out at room temperature involving a nanosecond pulse lamp as the excitation source, and Hamamatsu MCP photomultiplier (R3809) was utilized as a detector. The excitation wavelength was set at 280 nm, and the emission decay curve was recorded at 420 nm and 375 nm. All the decays were deconvoluted and fitted with a bi-exponential function using Igor software.Results and discussion
Description of the crystal structure
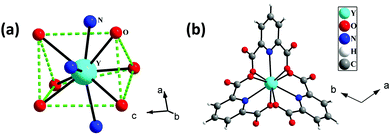
The single-crystal X-ray analysis reveals that 1 crystallizes in the trigonal system with space group P![[3 with combining macron]](https://www.rsc.org/images/entities/char_0033_0304.gif) . The asymmetric unit of 1 consists of one-third Y3+ ion, one 2,6-pyridine dicarboxylate (pydc), half diprotonated piperazine, and three and one-third lattice water molecules (see Fig. S1, ESI†). The Y3+ ion is tricapped trigonal prismatically coordinated by six carboxylate oxygen atoms of pydc and three nitrogen atoms of pyridine rings of pydc ligands (Fig. 1a). Both the carboxylate groups of pydc are monodentate with respect to their connectivity with the Y3+ ion. The Y–O bonds have average lengths of 2.402 Å, and the Y–N bond has a length of 2.484 Å. The O/N–Y–O/N bond angles are in the range of 64.41(7)–147.64(8)°. The selected bond lengths and bond angles are listed in Tables S1 and S2 (ESI†), respectively. The Y3+ ions are connected by three pydc ligands to form a [Y(pydc)3]3− molecular structure (Fig. 1b).
. The asymmetric unit of 1 consists of one-third Y3+ ion, one 2,6-pyridine dicarboxylate (pydc), half diprotonated piperazine, and three and one-third lattice water molecules (see Fig. S1, ESI†). The Y3+ ion is tricapped trigonal prismatically coordinated by six carboxylate oxygen atoms of pydc and three nitrogen atoms of pyridine rings of pydc ligands (Fig. 1a). Both the carboxylate groups of pydc are monodentate with respect to their connectivity with the Y3+ ion. The Y–O bonds have average lengths of 2.402 Å, and the Y–N bond has a length of 2.484 Å. The O/N–Y–O/N bond angles are in the range of 64.41(7)–147.64(8)°. The selected bond lengths and bond angles are listed in Tables S1 and S2 (ESI†), respectively. The Y3+ ions are connected by three pydc ligands to form a [Y(pydc)3]3− molecular structure (Fig. 1b).
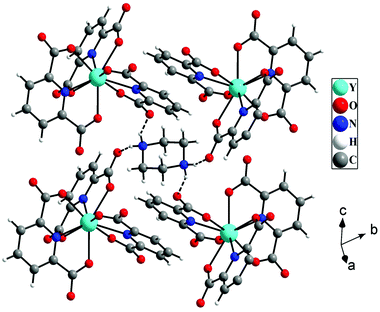
The hydrogen atoms of protonated piperazine (N–H) formed strong N–H⋯O hydrogen bonds with free oxygen atoms [O(4) and O(2)] of the carboxylate groups of pydc ligands. The H⋯A and D–H⋯A distances and D–H⋯A angles are 1.96 Å, 2.77 Å, and 152° for N(2)–H(2A)⋯O(4), respectively, and 1.97 Å, 2.80 Å and 154° for N(2)–H(2B)⋯O(2), respectively (where H = hydrogen, D = donor, A = accepter). Through these hydrogen bonded interactions, each protonated piperazine connects four [Y(pydc)3]3− molecular units (Fig. 2).
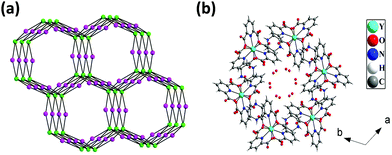
The hydrogen bonded three-dimensional network is formed through the connectivity between the [Y(pydc)3]3− molecular unit and protonated piperazine molecules. Topological analysis of this network shows the presence of two different types of nodes. The [Y(pydc)3]3− molecular unit acts as a 6-connected trigonal prismatic node, and the protonated piperazine unit acts as a 4-connected square planar node in the binodal structure. The connectivity between the two different types of nodes generated the (4966)2(4462)3 topology (Fig. 3a).50 Brouca-Cabarrecq et al. reported a negatively charged complex, (C4N2H12)1.5[Ce(C7H3NO4)3]·7H2O, in which the dipicolinic group is totally unprotonated, and the charge balance is ensured by the presence of piperazinium ions.51 Three-dimensional arrangement in the ab plane shows the presence of one-dimensional water-filled (lattice water molecules) channel along the c axis (Fig. 3b). The position of all the water molecules can be observed from the arrangement in the bc plane (see Fig. S2, ESI†).
Characterizations
To verify the phase purity and structural consistency of 1, powder X-ray diffraction (PXRD) patterns of 1 were recorded on well-crushed single-crystals within the 2θ range of 5–50° and compared with the simulated PXRD pattern calculated using single-crystal X-ray diffraction data. The experimental PXRD pattern of the as-synthesized 1 matches well with the simulated one (see Fig. S3, ESI†). The PXRD pattern of 1a was also consistent with the simulated pattern (see Fig. S3, ESI†). The FTIR spectra of 1 and 1a are shown in Fig. S4 and S5 (see ESI†), respectively. Some of the main peaks of the functional groups of the compounds are presented in Table S3 (ESI†). TGA was carried out to depict the thermal stability of 1 (Fig. S6, ESI†). TGA for 1a was also performed, and the TGA curve was almost identical with 1 (Fig. S6, ESI†). The TGA curve of 1 predicts that the thermal decomposition process of 1 takes place as follows. The first weight loss of 18.46% (calculated 20.00%) up to 160 °C corresponds to the elimination of twenty lattice water molecules. The weight loss above 260 °C is attributed to the decomposition of the structure. SEM image was collected to examine the size and morphology of 1a, and the image is presented in Fig. S7 (see ESI†). The EDX analysis was also performed on a well-ground powdered sample of 1a, which revealed that Eu and Y are present in a molar ratio of ∼1![[thin space (1/6-em)]](https://www.rsc.org/images/entities/char_2009.gif) :
:![[thin space (1/6-em)]](https://www.rsc.org/images/entities/char_2009.gif) 4, as depicted in Fig. S8 (see ESI†). The EDX elemental mapping analysis of 1a is presented in Fig. 4, and it confirms the presence of elements in 1a.
4, as depicted in Fig. S8 (see ESI†). The EDX elemental mapping analysis of 1a is presented in Fig. 4, and it confirms the presence of elements in 1a.
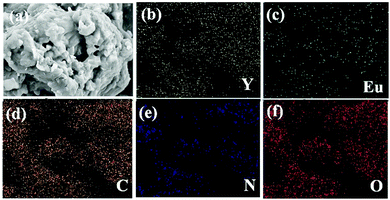 | ||
| Fig. 4 (a) SEM image of compound 1a and the corresponding elemental mapping images of compound 1a for (b) Y L, (c) Eu L, (d) C K (e) N K, and (f) O K. | ||
Photoluminescent properties
The photoluminescence spectra of 1a were studied in an aqueous media at room temperature. Compound 1a exhibits bright visible red emission at an excitation wavelength of 280 nm. The observed five emission bands with characteristic peaks located at 579, 593, 616, 653, and 694 nm should be attributed to the 5D0 → 7F0, 5D0 → 7F1, 5D0 → 7F2, 5D0 → 7F3, and 5D0 → 7F4 transitions of Eu3+ ions, respectively. These bands are based on the 2,6-pyridine dicarboxylate sensitized Eu3+ centered emission. In other words, 2,6-pyridine dicarboxylate acts as an antenna to efficiently sensitize the Eu3+ ion. Compound 1a exhibits ligand-centered blue and broad emission band at 406 nm at λex = 280 nm. The absorption spectra and the ligand-centered emission spectra of 1a are shown in Fig. S9 (see ESI†). The excitation spectra of 1a were taken by keeping the emission wavelength fixed at 616 nm, and metal-centered emission spectra were taken upon excitation at 280 nm (see Fig. S10, ESI†).pH response of compound 1a
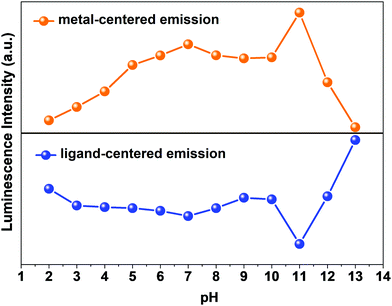
The pH response of compound 1a was examined in both acidic and alkaline media. The luminescence behavior of 1a in the case of the metal-center was analyzed at different pH values. With increasing pH values from 2 to 7, the luminescence intensity increased steadily. In the alkaline region, the luminescence intensity slightly decreased as we moved from pH 7 to 10. At pH 11, the luminescence intensity increased sharply. After that, the intensity declined at pH 12 and became almost zero at pH 13. The change in luminescence intensity in the entire pH range is addressed in Fig. 5.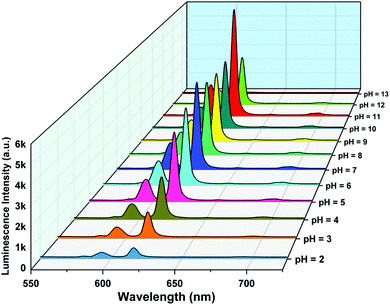 | ||
| Fig. 5 Metal-centered luminescence spectra of 1a in an aqueous solution at different pH values (λex = 280 nm). | ||
From Fig. 5, we can say that compound 1a has a very good luminescence response in the pH region 2 to 7. The ligand-centered emission spectra were also recorded at various pH values. As we moved from pH 2 to 7, the luminescence intensity decreased to some extent, and as we moved towards basic pH viz. 9, a slight increase in the luminescence intensity was observed. A blue shift of about 23 nm in emission peak along with a decrease in luminescence intensity was noticed at pH 11, which arises due to the detachment of the carboxylate oxygen of the pydc ligand from the metal center. At pH 12 and 13, the luminescence intensity at the new emission peak (383 nm) increased largely. The large blue shift occurs because at a very high pH, the bonds between the Eu and the pydc ligands get ruptured step by step, and it produces a deprotonated pydc ligand that gives an emission peak at ∼385 nm. So, the ligand center emission at high pH resembles that of the free ligand. The changes in ligand-centered emission at various pH values are shown in Fig. 6.
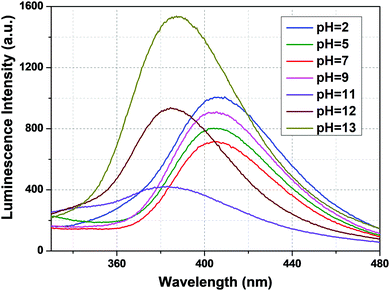 | ||
| Fig. 6 Ligand-centered luminescence spectra of 1a in an aqueous solution at different pH values (λex = 280 nm). | ||
So, the luminescence intensity of both metal-centered and ligand-centered emissions is interesting, and the results are mirror images of each other in terms of the luminescence intensity at a wide range of pH (Fig. 7). The upper portion of Fig. 7 shows the luminescence response of metal-centered emission of 1a (based on the emission peak at 616 nm) and the lower portion shows the luminescence response of ligand-centered emission of 1a (based on the peak position) at different pH values.
We have also checked the reversible response of pH in the acidic region. Initially, the luminescence spectra at pH 7 were collected, and the pH value was tuned in several steps with the addition of HCl solution until it reached pH 2. The luminescence intensity was recorded at each successive step. Afterward, the pH value was again increased to 7 with the addition of NaOH solution, and the luminescence response was monitored at every step in between them. The result from this experiment shows that compound 1a was partially reversible in the acidic range (pH 2 to 7) (Fig. S11, ESI†).
Some of the luminescence-based pH sensors in a particular range and their relationship with luminescence intensity are summarized in Table 2.
| S. no. | Compound | Excitation wavelength (nm) | Emission wavelength (nm) | Range of pH | Relationship between luminescence intensity and pH | Ref. |
|---|---|---|---|---|---|---|
| 1 | [(UO2)(H2DTATC)] | 373 | 430 | 9.4–11.5 | Turn on, linear | 52 |
| 2 | UiO-66-N![[double bond, length as m-dash]](https://www.rsc.org/images/entities/char_e001.gif) N-ind1h N-ind1h |
350 | 428 | 1–12 | Exponential | 42 |
| 3 | UiO-66-N![[double bond, length as m-dash]](https://www.rsc.org/images/entities/char_e001.gif) N-ind3h N-ind3h |
350 | 428 | 1–12 | Exponential | 42 |
| 4 | Zr6(μ3-O)4(μ3-OH)4(ITTC)4 | 350 | 448 | 10.2–11.08 | Linear | 53 |
| 5 | Al-MIL-101-NH2 | 396 | 451 | 4.0–7.7 | Turn on, linear | 18 |
| 6 | Eu2xTb2−2x(fum)2(ox)(H2O)4 | 340 | 616, 545 | 3.0–7.0 | Turn on, linear | 54 |
| 7 | [H3O][Eu3(HBPTC)2(BPTC)(H2O)2]·4DMA | 331 | 617 | 7.5–10.0 | Turn on, linear | 55 |
| 8 | MOF-253-Eu-TTA | 330, 375 | 614 | 5–7.2 | Turn on, linear | 56 |
| 9 | UiO-67-bpy-Eu-BTA | 365 | 612 | 1.05–9.85 | Turn on, exponential | 26 |
| 10 | {[Eu(PPTA)0.5(NO3)(DMF)2]·H2O}n | 300 | 390, 480 | 2–7 | I 480/I390, turn-off, linear | 44 |
| 7–10.5 | I 480/I390, turn-on, linear | |||||
| 11 | Tb-MOF | 336 | 542 | 2–7 | Turn-on, linear | 57 |
| 12 | ITQMOF-3-Eu | 350 | 579, 580.5 | 5–7.5 | I 579/I580.5, turn-on, linear | 43 |
| 13 | [EuxTb1−x(D-cam)(Himdc)2(H2O)2] | 277 | 545, 613 | 5–9 | I 545/I613, turn-on, exponential | 58 |
| 6.8–8.0 | I 545/I613, turn-on, linear | |||||
| 14 | Eu3+@UiO-67-bpydc | 335 | 615 | 1.06–10.99 | Turn-on, linear | 59 |
| 15 | [Eu2(pydcH)6]·3H2O | 280 | 612 | 2–6 | Turn-on | 60 |
| 16 | [Y1.8Tb0.2(CAM)3(H2O)4]·2H2O | 280 | 545 | 7–9 | Linear, turn-on | 61 |
| 17 | [Y1.6Eu0.4(pydc)6(H2pip)3]·20H2O | 280 | 616 | 2–7 | Linear, turn-on | This work |
| 406 | 2–7 | Linear, turn-off |
Luminescence lifetime decay experiments
To investigate the pH sensing mechanism, we have performed the luminescence lifetime decay measurements at different pH values. The excitation wavelength was fixed at 280 nm, and the luminescence lifetime decay curves were measured at the metal-centered emission i.e., at λem = 616 nm. The average lifetime of 1a was found to be 1.43 ms at pH 7. As the pH value reaches 2, the lifetime value decreases to 0.31 ms (Fig. S12, ESI†). As the pH values changes from 7 to 10, the lifetime values remain almost the same. At pH 11, the value increased slightly and at pH 13, the lifetime value drastically reduced to 0.26 ms (Fig. S12, ESI†). The average lifetime values are summarized in Table 3. The data reflects a good correlation between luminescence intensity change and the lifetime values.| pH | Lifetime (ms) |
|---|---|
| 2 | 0.31 |
| 3 | 0.47 |
| 4 | 1.33 |
| 5 | 1.41 |
| 6 | 1.42 |
| 7 | 1.43 |
| 8–10 | 1.42 |
| 11 | 1.46 |
| 12 | 1.33 |
| 13 | 0.26 |
To get a deeper insight into the sensing mechanism of pH, the luminescence lifetime decay measurements for the ligand-centered emission were also performed. The luminescence decay curve, along with its bi-exponential fitted lines at different pH values were interpreted, as shown in Fig. 8. The fitting results of lifetime values are summarized in Table 4. The average lifetime of 1a at pH 2 was found to be 4.20 ns. As we move to pH 7, the average lifetime reduces to 2.30 ns. Upon increasing the pH towards 9, the lifetime value increases to 3.20 ns. From Fig. 6, we noticed that the luminescence intensity of ligand-centered emission observed at 406 nm decreases along with a blue shift of about 23 nm, which indicates the breaking of the metal–oxygen bond, thus creating a favorable geometry for energy flow from the ligand to the metal center. At the basic region, viz. pH 11, after the blue shift occurs, the average lifetime ultimately reduces to 1.00 ns (λem = 375 nm).
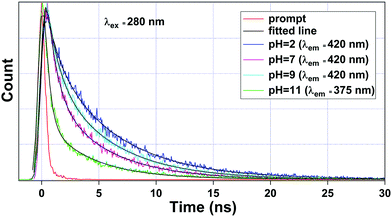 | ||
| Fig. 8 Luminescence lifetime decay curve of 1a observed at pH = 2, 7, and 9 monitored at λem = 420 nm and pH = 11 at λem = 375 nm. Here, λex was set at 280 nm during the experiment. | ||
| S. no. | pH values | λ ex (nm) | λ em (nm) | a 1 | a 2 | τ 1 | τ 2 | 〈τ〉 (ns) |
|---|---|---|---|---|---|---|---|---|
| 1 | pH = 2 | 280 | 420 | 0.67 | 0.33 | 5.73 | 1.10 | 4.20 |
| 2 | pH = 7 | 280 | 420 | 0.37 | 0.63 | 4.82 | 0.86 | 2.30 |
| 3 | pH = 9 | 280 | 420 | 0.51 | 0.49 | 5.20 | 1.03 | 3.20 |
| 4 | pH = 11 | 280 | 375 | 0.17 | 0.83 | 4.63 | 0.41 | 1.00 |
Stability of 1a in the pH range 2–11
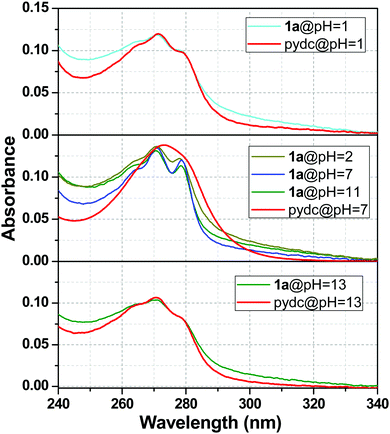
The stability of 1a was well understood from the UV-Vis absorption spectra. The absorption spectra of 1a were compared with the pydc ligand at different pH values, and a clear view of this comparison is presented in Fig. 9. This figure depicts that the stability of compound 1a was lost at pH 1 and 13. So, the absorption spectra of 1a resemble the absorption spectra of pydc ligands. In other words, the spectra of 1a at pH 7 were not matching with the spectra at pH 1 and 13, as shown in the upper and lower panels. In the middle one, the absorption spectra of 1a were maintained from pH 2 to 11, while it differs from that of pydc ligands, suggesting the remarkable stability of 1a in this range.Mechanism of pH sensing
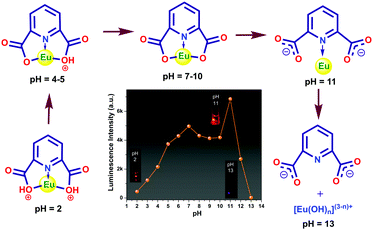
The pH of the medium has a strong impact on the luminescence intensity of 1a. The ligands efficiently absorb the UV light (280 nm) and get promoted to the electronic excited state and then transfer a part of the energy to the Eu3+ ion, resulting in a characteristic metal-centered emission. It is expected that the protonation of the ligand affects the energy flow from the ligand to the metal ion. In acidic conditions, the carboxylate oxygen remain protonated, and consequently, the sensitization process gets hampered since the protonation can destabilize the π-electron conjugated system of the pydc ligand. As a result, the Eu center of 1a showed weak luminescence. An increase in pH leads to stepwise deprotonation and eventually, the increase in luminescence intensity occurred (Fig. 10). The huge enhancement in luminescence intensity at pH 11 and a 23 nm blue shift in the ligand center emission indicate the breaking of the Eu–O bond that creates a favorable geometry for energy flow from pydc to Eu center via the Eu–N bond. At pH > 11, the MOC structure gets ruptured, which results in no metal center emission and huge ligand emission. The observations were also supported by the change in lifetime values. A possible sensing mechanism is represented in Fig. 10.Conclusions
In summary, we have successfully synthesized a yttrium-based MOC, [Y2(pydc)6(H2pip)3]·20H2O (1) with binodal (4966)2(4462)3 topology and an isomorphous europium-doped yttrium-based MOC, [Y1.6Eu0.4(pydc)6(H2pip)3]·20H2O (1a) employing 2,6-pyridine dicarboxylic acid and piperazine by hydrothermal technique. Compound 1a exhibited pydc ligand sensitized Eu centered bright red emission upon excitation at 280 nm. It showed a good pH response over a wide pH range (2–11) covering both acidic and alkaline regions. Compound 1a can be used as a luminescent probe for pH sensing, and the color change can be visualized by varying the pH. The luminescence intensity of the metal center increased monotonically when the pH was gradually changed from 2 to 7. After that, the intensity values slightly decreased up to pH 10. A sharp rise in intensity was observed at pH 11. The intensity value subsequently decreased at pH 12 and became nil at pH 13. The luminescence lifetime also reflected the changes observed in intensity for both ligand center and metal center emission. The UV-Visible spectra suggest that compound 1a remains stable in the pH range 2 to 11. The stepwise deprotonation of the carboxylate oxygen of the pydc ligand was found to be responsible for the enhancement of sensitization efficiency and the increase of metal-center emission. At pH 11, the Eu–O bond broke down, resulting 23 nm blue shift in ligand center emission and a huge increase in sensitization efficiency and metal center emission.Author contributions
P. Daga conceived the presented idea, performed all the experiments, and wrote the manuscript. S. Hui and P. Majee helped in the lifetime decay analysis experiment. S. Sarkar helped to collect the SCXRD data. D. K. Singha helped in analysing the luminescence data, and P. Mahata helped in solving the crystal structure. S. K. Mondal interpreted the results, modified the manuscript, and supervised the whole work.Conflicts of interest
There are no conflicts to declare.Acknowledgements
SKM thanks CSIR project 01(3087)/21/EMR-II and the DST-PURSE Program of Visva-Bharati (SR/PURSE Phase2/42(G) & Phase2/42(C)). P. Mahata thanks Jadavpur University for research support under RUSA2.0 and UGC, New Delhi, for the Start-up grant. S. Sarkar and P. Majee thank CSIR, Government of India, for the SRF fellowship. The authors thank Prof. AK Das of Visva-Bharati for fruitful discussions.References
- Z. Yin, Y.-L. Zhou, M.-H. Zeng and M. Kurmoo, Dalton Trans., 2015, 44, 5258–5275 RSC.
- W. P. Lustig, S. Mukherjee, N. D. Rudd, A. V. Desai, J. Li and S. K. Ghosh, Chem. Soc. Rev., 2017, 46, 3242–3285 RSC.
- K. Jayaramulu, R. P. Narayanan, S. J. George and T. K. Maji, Inorg. Chem., 2012, 51, 10089–10091 CrossRef CAS PubMed.
- J. Liu, L. Chen, H. Cui, J. Zhang, L. Zhang and C.-Y. Su, Chem. Soc. Rev., 2014, 43, 6011–6061 RSC.
- A. Morozan and F. Jaouen, Energy Environ. Sci., 2012, 5, 9269–9290 RSC.
- Y. He, W. Zhou, R. Krishna and B. Chen, Chem. Commun., 2012, 48, 11813–11831 RSC.
- Y. Li and R. T. Yang, Langmuir, 2007, 23, 12937–12944 CrossRef CAS PubMed.
- E. Angioni, R. J. Marshall, N. J. Findlay, J. Bruckbauer, B. Breig, D. J. Wallis, R. W. Martin, R. S. Forgan and P. J. Skabara, J. Mater. Chem. C, 2019, 7, 2394–2400 RSC.
- F. Ke, Y.-P. Yuan, L.-G. Qiu, Y.-H. Shen, A.-J. Xie, J.-F. Zhu, X.-Y. Tian and L.-D. Zhang, J. Mater. Chem., 2011, 21, 3843–3848 RSC.
- X.-Y. Dong, R. Wang, J.-Z. Wang, S.-Q. Zang and T. C. W. Mak, J. Mater. Chem. A, 2015, 3, 641–647 RSC.
- R. Wang, X.-Y. Dong, H. Xu, R.-B. Pei, M.-L. Ma, S.-Q. Zang, H.-W. Hou and T. C. W. Mak, Chem. Commun., 2014, 50, 9153–9156 RSC.
- P. Mahata, S. Natarajan, P. Panissod and M. Drillon, J. Am. Chem. Soc., 2009, 131, 10140–10150 CrossRef CAS PubMed.
- P. Daga, P. Majee, D. K. Singha, P. Manna, S. Hui, A. K. Ghosh, P. Mahata and S. K. Mondal, New J. Chem., 2020, 44, 4376–4385 RSC.
- F.-Y. Yi, D. Chen, M.-K. Wu, L. Han and H.-L. Jiang, ChemPlusChem, 2016, 81, 675–690 CrossRef CAS PubMed.
- P. Daga, P. Manna, P. Majee, D. K. Singha, S. Hui, A. K. Ghosh, P. Mahata and S. K. Mondal, Dalton Trans., 2021, 50, 7388–7399 RSC.
- S. Pramanik, C. Zheng, X. Zhang, T. J. Emge and J. Li, J. Am. Chem. Soc., 2011, 133, 4153–4155 CrossRef CAS PubMed.
- P. Majee, P. Daga, D. K. Singha, D. Saha, P. Mahata and S. K. Mondal, J. Photochem. Photobiol., A, 2020, 402, 112830 CrossRef CAS.
- X.-Y. Xu and B. Yan, Dalton Trans., 2016, 45, 7078–7084 RSC.
- P. Majee, D. K. Singha, P. Daga, S. Hui, P. Mahata and S. K. Mondal, CrystEngComm, 2021, 23, 4160–4168 RSC.
- H. Dong, L.-D. Sun and C.-H. Yan, Chem. Soc. Rev., 2015, 44, 1608–1634 RSC.
- Y. Cui, J. Zhang, B. Chen and G. Qian, in Handbook on the Physics and Chemistry of Rare Earths, ed. J.-C. G. Bünzli and V. K. Pecharsky, Elsevier, 2016, vol. 50, pp. 243–268 Search PubMed.
- F. Wang, Y. Pu, X. Zhang, F. Zhang, H. Cheng and Y. Zhao, J. Lumin., 2019, 206, 192–198 CrossRef CAS.
- Y. Zhao and D. Li, J. Mater. Chem. C, 2020, 8, 12739–12754 RSC.
- P. Daga, S. Sarkar, P. Majee, D. K. Singha, S. Hui, P. Mahata and S. K. Mondal, Mater. Adv., 2021, 2, 985–995 RSC.
- L. Lei, H. Xia, C.-K. Lim, S. Xu, K. Wang, Y. Du and P. N. Prasad, Chem. Mater., 2019, 31, 8121–8128 CrossRef CAS.
- T. Liu and B. Yan, Ind. Eng. Chem. Res., 2020, 59, 1764–1771 CrossRef CAS.
- S.-L. Yang, W.-S. Liu, G. Li, R. Bu, P. Li and E.-Q. Gao, Inorg. Chem., 2020, 59, 15421–15429 CrossRef CAS PubMed.
- Y. Zhou, W. Chen, J. Zhu, W. Pei, C. Wang, L. Huang, C. Yao, Q. Yan, W. Huang and J. S. C. Loo, Small, 2014, 10, 4874–4885 CrossRef CAS PubMed.
- Y. Zhou, W. Pei, C. Wang, J. Zhu, J. Wu, Q. Yan, L. Huang, W. Huang, C. Yao and J. S. C. Loo, Small, 2014, 10, 3560–3567 CrossRef CAS PubMed.
- S. Halder, A. Hazra and P. Roy, J. Lumin., 2018, 195, 326–333 CrossRef CAS.
- L. Santos, J. P. Neto, A. Crespo, D. Nunes, N. Costa, I. M. Fonseca, P. Barquinha, L. Pereira, J. Silva, R. Martins and E. Fortunato, ACS Appl. Mater. Interfaces, 2014, 6, 12226–12234 CrossRef CAS PubMed.
- F. E. Galdino, J. P. Smith, S. I. Kwamou, D. K. Kampouris, J. Iniesta, G. C. Smith, J. A. Bonacin and C. E. Banks, Anal. Chem., 2015, 87, 11666–11672 CrossRef CAS PubMed.
- M. Li, W. Yang, P. Qiu, G. Ren, C. Li, Z. Chen, Y. Wang and Q. Pan, J. Lumin., 2019, 205, 380–384 CrossRef CAS.
- M. Ko, L. Mendecki and K. A. Mirica, Chem. Commun., 2018, 54, 7873–7891 RSC.
- K. Wu, J. Hu, S. Shi, J. Li and X. Cheng, Dyes Pigm., 2020, 173, 107993 CrossRef CAS.
- L. Yu, Q. Zheng, D. Wu and Y. Xiao, Sens. Actuators, B, 2019, 294, 199–205 CrossRef CAS.
- C. Yao, Y. Xu and Z. Xia, J. Mater. Chem. C, 2018, 6, 4396–4399 RSC.
- A. Burns, P. Sengupta, T. Zedayko, B. Baird and U. Wiesner, Small, 2006, 2, 723–726 CrossRef CAS PubMed.
- Z. L. Wu, M. X. Gao, T. T. Wang, X. Y. Wan, L. L. Zheng and C. Z. Huang, Nanoscale, 2014, 6, 3868–3874 RSC.
- F. Qu, N. B. Li and H. Q. Luo, Langmuir, 2013, 29, 1199–1205 CrossRef CAS PubMed.
- H.-L. Jiang, D. Feng, K. Wang, Z.-Y. Gu, Z. Wei, Y.-P. Chen and H.-C. Zhou, J. Am. Chem. Soc., 2013, 135, 13934–13938 CrossRef CAS PubMed.
- J. Aguilera-Sigalat and D. Bradshaw, Chem. Commun., 2014, 50, 4711–4713 RSC.
- B. V. Harbuzaru, A. Corma, F. Rey, J. L. Jordá, D. Ananias, L. D. Carlos and J. Rocha, Angew. Chem., Int. Ed., 2009, 48, 6476–6479 CrossRef CAS PubMed.
- S.-L. Hou, J. Dong, M.-H. Tang, X.-L. Jiang, Z.-H. Jiao and B. Zhao, Anal. Chem., 2019, 91, 5455–5460 CrossRef CAS PubMed.
- J. Wang, Y. Li, M. Jiang, Y. Liu, L. Zhang and P. Wu, Chem. – Eur. J., 2016, 22, 13023–13027 CrossRef CAS PubMed.
- SMART (V 5.628), SAINT (V 6.45a), XPREP, SHELXTL, Bruker AXS Inc., Madison, USA, 2004.
- G. M. Sheldrick, Siemens Area Correction Absorption Correction Program, University of Göttingen, Göttingen, Germany, 1994 Search PubMed.
- G. M. Sheldrick, SHELXL-97 Program for Crystal Structure Solution and Refinement, 1997 Search PubMed.
- L. Farrugia, J. Appl. Crystallogr., 1999, 32, 837–838 CrossRef CAS.
- B. F. Abrahams, R. W. Elliott, T. A. Hudson and R. Robson, CrystEngComm, 2012, 14, 351–354 RSC.
- C. Brouca-Cabarrecq, J. Dexpert-Ghys, A. Fernandes, J. Jaud and J. C. Trombe, Inorg. Chim. Acta, 2008, 361, 2909–2917 CrossRef CAS.
- D. Gu, W. Yang, G. Ning, F. Wang, S. Wu, X. Shi, Y. Wang and Q. Pan, Inorg. Chem., 2020, 59, 1778–1784 CrossRef CAS PubMed.
- B. Guo, F. Li, C. Wang, L. Zhang and D. Sun, J. Mater. Chem. A, 2019, 7, 13173–13179 RSC.
- T. Xia, F. Zhu, K. Jiang, Y. Cui, Y. Yang and G. Qian, Dalton Trans., 2017, 46, 7549–7555 RSC.
- Q. Meng, X. Xin, L. Zhang, F. Dai, R. Wang and D. Sun, J. Mater. Chem. A, 2015, 3, 24016–24021 RSC.
- Y. Lu and B. Yan, Chem. Commun., 2014, 50, 13323–13326 RSC.
- H.-Y. Li, Y.-L. Wei, X.-Y. Dong, S.-Q. Zang and T. C. W. Mak, Chem. Mater., 2015, 27, 1327–1331 CrossRef CAS.
- Y.-H. Han, C.-B. Tian, Q.-H. Li and S.-W. Du, J. Mater. Chem. C, 2014, 2, 8065–8070 RSC.
- X. Zhang, K. Jiang, H. He, D. Yue, D. Zhao, Y. Cui, Y. Yang and G. Qian, Sens. Actuators, B, 2018, 254, 1069–1077 CrossRef CAS.
- D. K. Singha, P. Majee, S. K. Mondal and P. Mahata, Eur. J. Inorg. Chem., 2016, 4631–4636 CrossRef CAS.
- S. Hui, P. Majee, D. K. Singha, P. Daga, S. K. Mondal and P. Mahata, New J. Chem., 2021, 45, 9394–9402 RSC.
Footnote |
| † Electronic supplementary information (ESI) available. CCDC 2091656. For ESI and crystallographic data in CIF or other electronic format see DOI: 10.1039/d1ma00980j |
| This journal is © The Royal Society of Chemistry 2022 |

