 Open Access Article
Creative Commons Attribution 3.0 Unported Licence
Influence of the fluoride anion on photoinduced charge transfer interactions in adenine-functionalized push–pull naphthalenediimide chromophores†
Shailesh S.
Birajdar‡
ab,
Mehak
Ahuja‡
 bc,
Avinash L.
Puyad
d,
Mahesh
Kumar
c,
Vishal G.
More
e,
Rachana
Kumar
*bc,
Sidhanath V.
Bhosale
 *ab and
Sheshanath V.
Bhosale
*e
aPolymers and Functional Materials Division, CSIR-Indian Institute of Chemical Technology, Hyderabad, 500007, Telangana, India. E-mail: bhosale@iict.res.in
bAcademy of Scientific and Innovative Research (AcSIR), Ghaziabad, 201002, Uttar Pradesh, India
cAdvanced Materials and Devices Metrology Division, CSIR-National Physical Laboratory, Dr K. S. Krishnan Marg, New Delhi 110012, India. E-mail: rachanak.npl@nic.in; rachanasinghchem@gmail.com
dSchool of Chemical Sciences, Swami Ramanand Teerth Marathwada University, Nanded 431606, Maharashtra, India
eSchool of Chemical Sciences, Goa University, Taleigao Plateau, Goa-403206, India. E-mail: svbhosale@unigoa.ac.in
First published on 25th April 2022
Abstract
A new series of nucleobase adenine (A)-functionalized naphthalene diimide (NDI) derivatives to form a donor–acceptor conjugate has been designed, synthesized and characterized. The photoinduced electron transfer from A to NDI chromophores upon fluoride anion binding to the chromophores NDI-A and A-NDI-A has been investigated by electrochemical and femtosecond transient absorption spectroscopy (TAS). The TAS study further showed the formation of charge-separated states in both the derivatives, which disappear on TBAF addition.
Introduction
In the evolutionary process of life, photosynthetic antenna systems were constructed by self-assembled bacteriochlorophyll (BChl) in Nature.1 In Nature, the antenna system with great diversity exhibits similar architectures constituted by electron donor (D) and acceptor (A) chromophores.2 The operating principle of such self-assembled D–A photosynthetic reaction centres stabilizes the electron and the hole transportation on opposite sides of a lipid bilayer-membrane.3 To fabricate more robust artificial antenna systems, the natural blueprint should be well understood but it is not necessary to be identically copied.4 Inspired from the natural antenna systems, researchers have developed various supramolecular self-assembled and covalently-linked conjugates such as dyads, triads, tetrads, and pentads.5 The energy and electron transfer properties using synthetic systems have been well established to mimic the natural process.6 The excited state electron transfer process in donor–acceptor molecules in the presence of additional cofactors such as cations, anions and protons may lead to prolonging the life time of the electron transfer product formation.7 Moreover, in biological systems, the impact of external factors on the efficiency of electron transfer processes is well documented. In photosystem-II, in the oxidation process of water, calcium cations and chloride anions are the important cofactors.8In connection with this, the electron transfer (ET) process in deoxyribonucleic acid (DNA) has been tapped by researchers for photo-therapy and long range ET applications.9The biomolecular structures of nucleobase base-pairing such as adenine-uracil/thymine and guanine–cytosine (Watson Crick) are responsible for maintaining the functions of life's genetic code.10 Among these nucleobases, a fluorescent adenine moiety is widely utilized to investigate the structure and dynamics of nucleic acids.11 The photophysical properties of adenine display bathochromic-shifted absorption maxima. Moreover, in single and double stranded DNA the fluorescence of adenine is quenched.12 These properties of adenine have been widely employed to study the dynamics, thermodynamics and kinetics of protein-induced DNA conformational changes.13 The fluorescence emission quenching of adenine may involve an ET phenomenon.14 Therefore, the charge transport properties of nucleobases within π-stacking distances have been investigated along stacked base pairs due to the potential of electron and hole transport characteristics.15 Here, we have utilized nucleobase adenine in conjugation with NDI via covalent bonding to establish the ET process in the presence of a fluoride anion as a cofactor.
Core-substituted NDIs, belonging to the rylene family, have attracted researchers’ attention due to their utilization in the fabrication of multichromophoric systems.16 NDIs without any electron donor at their core have been employed as electron acceptors in D–A molecular architectures,17 whereas the incorporation of one to four electron donor substituents at the NDI core displayed new optical manipulation with charge transfer properties in the visible region.18 The number and nature of substituents at the NDI core can influence these characteristics. NDIs have been employed as an acceptor in combination with different donors to establish the charge transport properties.19 Importantly, core-substituted NDIs can be utilized to recognize fluoride anions leading to modulation of their photophysical and electrochemical properties.20 A literature search revealed that in supramolecular D–A complex systems, anion binding at the donor macrocycle influences the excited state electron transfer properties.21 Moreover, it was also demonstrated that anion binding also led to improved photoelectrochemical responses.21 By taking advantage of these characteristics, we have designed adenine-functionalized core-substituted push–pull NDIs.
Herein, we have presumed that an electron-rich adenine donor and an electron acceptor NDI lead to π-electronic push–pull type molecular architectures such as NDI-A and A-NDI-A (Scheme 1). The direct substitution of adenine (push) on the NDI core (pull) enabled electronic interactions between D- and A- and tuned their optical and electrochemical properties. Photoinduced charge transfer from adenine to NDI is investigated in these systems. Additionally, –NH groups of the adenine in NDI-A and A-NDI-A are available for binding fluoride, an anionic cofactor. The photoexcitation of NDI-A and A-NDI-A in the presence of a fluoride anion cofactor in charge transfer processes was also studied.
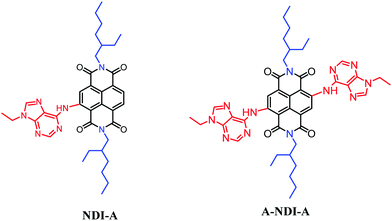 | ||
| Scheme 1 Chemical structures of NDI-A and A-NDI-A utilized to visualize fluoride anion binding promoted photoinduced charge transfer interactions. | ||
Results and discussion
Synthesis of NDI-A and A-NDI-A
The synthesis details of the NDI-A dyad and A-NDI-A triad compounds are given in the ESI† (Scheme S1). At first, alkylation of adenine 1 in the presence of potassium carbonate in dimethylformamide was achieved to yield compound 2 by following the literature reported procedure.22 Adenine derivative 2 was reacted with NDI-Br16a,23 and Br-NDI-Br16a,23 under modified direct heteroarylation coupling conditions24 (to remove the bromine atoms) for the formation of the NDI-A and A-NDI-A moieties (Scheme 1 and Scheme S1, ESI†). The obtained compounds NDI-A and A-NDI-A were then used for further investigations.Spectroscopic studies
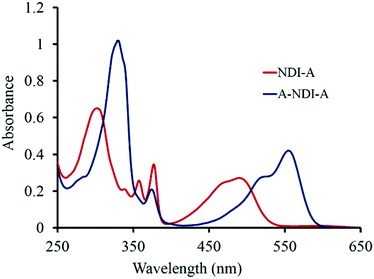
The UV-vis absorption spectra of NDI-A (1 × 10⁻⁵ M) and A-NDI-A (1 × 10⁻⁵ M) in dichloromethane (DCM) are shown in Fig. 1. NDI-A exhibits absorption maxima at 306 nm with shoulders at 341 nm, 359 nm, 378 nm and 491 nm (broad) (Fig. 1, red line). The triad A-NDI-A displayed peak maxima at 332 nm, 376 nm, 517 nm and 557 nm (Fig. 1, blue line). The core-substituted NDI shows highly shifted So to S1 transition compared to the N-imide substituted derivatives.25NDI-A shows a red shifted So to S1 transition at 491 nm, while A-NDI-A shows one at 557 nm. Thus, NDI-A and A-NDI-A displayed absorption maxima over the 300–560 nm range making them wide band capturing chromophores. The absorption spectrum of the control molecule SVB-M1 (Fig. S11, ESI†) exhibits four main peaks at 300, 355, 365 and 600 nm along with a shoulder peak at 560 nm. The obtained results are in accordance with the mono- and di-amine substituted NDI.6c,6d Würthner6cet al. and Tian and co-workers6d demonstrated that core-substituted NDI with amines exerted a +M effect, resulting in a bathochromic shift in the absorption spectra.The fluorescence emission of NDI-A (λex = 360 nm) in DCM shows three strong emission peaks at 414 nm, 434 nm, and 556 nm along with a shoulder peak at 640 nm (Fig. S12a, ESI†), whereas A-NDI-A (λex = 360 nm) exhibits fluorescence emission peaks at 418 nm and 438 nm, and a strong peak at 591 nm (Fig. S12c, ESI†).
The emission peaks at 556 nm and 591 nm of NDI-A and A-NDI-A, respectively, correspond to charge transfer bands between the adenine donor and NDI acceptor, suggesting the occurrence of energy or electron transfer events. Moreover, with the excitation at 469 nm (So to S1), NDI-A and A-NDI-A showed emission peaks at 560 nm (Fig. S12b, ESI†) and 590 nm with a shoulder peak at 635 nm (Fig. S12d, ESI†), respectively. The emission of A-NDI-A upon excitation at 555 nm displayed a strong peak at 590 nm (Fig. S13, ESI†) for S1 to S0 relaxation.
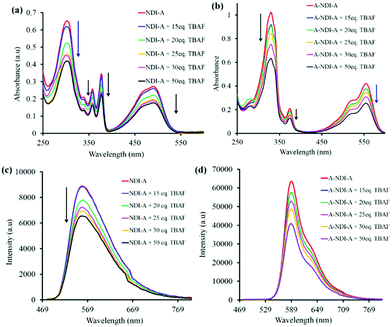
Fluoride anion binding to the NDI-A and A-NDI-A chromophores and its results with respect to colorimetric, UV-vis absorption, 1H NMR, emission and TCSPC spectral changes were then investigated. The colorimetric changes associated with F− anion binding with NDI-A and A-NDI-A are shown in Fig. S14a and S14b (ESI†), respectively. NDI-A displayed yellow color in DCM, but with the addition of F− ions, the color of the solution changed to dark yellow (Fig. S14a, ESI†). The color of the A-NDI-A in DCM appeared as pink and is changed to dark pink upon addition of F− ions (Fig. S14b, ESI†). Furthermore, UV-vis absorption spectral titration was performed to study the F− anion binding to NDI-A and A-NDI-A and spectral variations are shown in Fig. 2a and b, respectively. The binding of the F− anion to NDI-A displayed a significant decrease in peak intensities at 306 nm, 341 nm (shoulder), 359 nm, 378 nm and 491 nm (Fig. 2a). A similar trend was observed in the case of A-NDI-A showing a decrease in the absorption peak intensity at 332 nm, 376 nm, 517 nm and 557 nm (Fig. 2b). As shown in Fig. 2a and b, F− ion binding causes a decrease in absorbance peak intensity, which in turn leads to a change in the electronic properties of NDI-A and A-NDI-A, indicating that the F− ion interacts with adenine the N–H proton forming a non-covalent H-bonded adduct followed by deprotonation (Fig. S15a and S15b, ESI†). The Benesi–Hildebrand method26 was employed for these UV-vis absorption data resulting in binding constants of 5.671 × 10⁻⁷ M for NDI-A (Fig. S15a, ESI†) and −1.260 × 10⁻⁵ M for A-NDI-A (Fig. S15b, ESI†) upon addition of fluoride anions. These results are attributed to the intramolecular charge transfer (ICT) within the whole molecular skeleton.6c,6d
The F− anion binding to NDI-A and A-NDI-A and its effects on the fluorescence emission spectral changes (λex = 469) were then investigated and shown in Fig. 2c and d, respectively. The emission peak intensities at 560 nm for NDI-A (Fig. 2c) and at 590 nm with a shoulder peak at 635 nm for A-NDI-A (Fig. 2d) decrease with the gradual addition of F− ions. Thus, F− ion binding causes quenching of the fluorescence of NDI-A and A-NDI-A, indicating the occurrence of ICT from deprotonated adenine (push) to the NDI (pull) core and formation of charge-separated states.27 The deprotonation of the N–H protons of NDI-A and A-NDI-A was proved by means of 1H NMR in CDCl3 as a solvent with the addition of TBAF (50 equiv.). The characteristic adenine N–H proton peaks at 13.44 ppm for NDI-A (Fig. 3a) and 13.14 ppm for A-NDI-A (Fig. 3b) disappeared after addition of F− ions (50 equiv.), indicating the deprotonation of the adenine N–H protons with excess fluoride concentration.
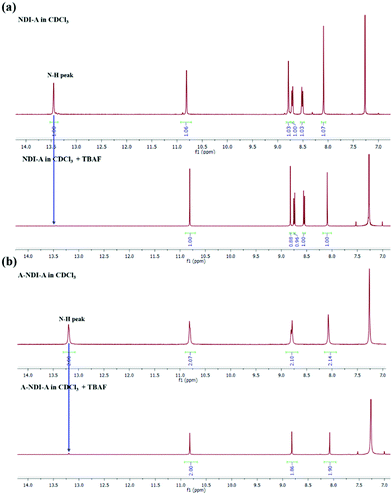 | ||
| Fig. 3 1H NMR titration of (a) NDI-A and (b) A-NDI-A with the addition of fluoride (F−) anions (50 equiv.). The graphs demonstrate above 7 ppm δ values. | ||
As depicted in Fig. 4, N–H proton deprotonation of NDI-A and A-NDI-A is also demonstrated by employing 19F NMR spectroscopic measurements. In 19F NMR, the fluoride anion of TBAF appeared at −107 ppm δ in DMSO-d6. The addition of TBAF to NDI-A resulted in three peaks at −57.47 ppm, −107 ppm and −126.93 ppm, corresponding to NDI-A·F, TBAF and HF2−, respectively. Similarly, addition of a fluoride anion (TBAF) to A-NDI-A resulted in four peaks at −73.48 ppm, −107.00 ppm, −144.40 ppm (mono-deprotonated form) and −144.77 ppm (di-deprotonated form), which are attributed to A-NDI-A·F, TBAF, HF2− and HF2−, respectively. The peaks of HF2− at −126.93 ppm, −144.40 ppm and −144.77 ppm are obtained due to deprotonation of NDA-A and A-NDI-A by the Lewis basic fluoride anion. Thus, 19F NMR spectroscopy measurements proved the deprotonation of NDI-A and A-NDI-A upon addition of fluoride anions.
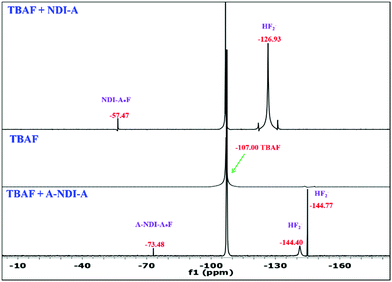 | ||
| Fig. 4 19F NMR titration of (a) NDI-A and (b) A-NDI-A with the addition of TBAF (50 equiv.) in DMSO-d6. | ||
To examine the deprotonation of NDI-A and A-NDI-A under basic conditions, we performed optical, UV-vis and fluorescence spectroscopy in the presence of tetrabutylammonium hydroxide salt (TBAOH). When NDI-A and A-NDI were exposed to OH− anions (as the TBA salt), color changes from yellow to green for NDI-A (Fig. S16a, ESI†) and pink to blue for A-NDI-A were observed by the naked eye (Fig. S16b, ESI†). In DCM, NDI-A with the addition of TBAOH displayed a decrease in peak intensity at 306, 359 nm, 378 nm and 491 nm (Fig. S17a, ESI†). A similar trend was also observed for A-NDI-A upon addition of TBAOH (Fig. S17b, ESI†). When NDI-A and A-NDI-A were treated with TBAOH, decreases in the fluorescence emission peak intensities at 560 nm for NDI-A (Fig. S18a, ESI†) and at 590 nm and 635 nm for A-NDI-A (Fig. S18b, ESI†) were observed. These results are consistent with the deprotonation of the N–H protons of NDI-A and A-NDI-A, under Lewis basic F− anion conditions (Fig. 4).
The time-correlated single photon counting (TCSPC) method was employed to determine the fluorescence lifetimes and the results are displayed in Fig. S19a and b, Table S1 and S2 (ESI†). TCSPC measurements revealed that NDI-A and A-NDI-A exhibited mono-exponential decay with lifetimes of τ1 = 0.8326 ns (100%) (Fig. S19a and Table S2, ESI†) and τ1 = 0.1831 ns (100%) (Fig. S19b and Table S2, ESI†), respectively. The TCSPC results suggested that excitation occurs in both the systems i.e.NDI-A and A-NDI-A. The supramolecular interactions of NDI-A and A-NDI-A with F− ions were then examined with the change in lifetime in ns. The NDI-A:F− complex displayed biexponential decay with lifetimes of τ1 = 0.5799 ns (88.69%) and τ2 = 0.2697 ns (11.31%) (Fig. S19a and Table S2, ESI†). The average lifetime of NDI-A:F− was 0.5448 ns, which is found to be shorter than that of NDI-A (Table S2, ESI†). Moreover, the interaction of F− ions with A-NDI-A resulted in τ1 = 0.1907 ns (100%), which is slightly larger than that of A-NDI-A (τ1 = 0.1831 ns). The changed fluorescence emission properties examined by steady state (Fig. 2c and d) and lifetime measurements (Fig. S19a and b, ESI†) of NDI-A and A-NDI-A upon interaction with fluoride anions demonstrated the occurrence of intramolecular charge transfer processes.27
Computational studies
Dynamic functional theory (DFT) studies were performed in order to examine the push–pull activity in NDI-A and A-NDI-A using the Gaussian 09 ab initio/DFT quantum chemical simulation package.28 The geometry optimization of molecules NDI-A, A-NDI-A, NDI-A + TBAF, and A-NDI-A + 2TBAF, considering the truncated alkyl part, has been carried out at the B3LYP/6-31G* level. The frequency calculations have also been employed at the same level to confirm the minima. The frontier molecular orbitals (FMOs) are generated by using Avogadro and are given in Fig. S20 and Fig. 5 (ESI†).29,30 The highest occupied molecular orbital (HOMO) is localized on the adenine and NDI subunits of NDI-A (Fig. 5a) and A-NDI-A (Fig. 5c), whereas the lowest unoccupied molecular orbital (LUMO) density is distributed over the NDI subunits and not the adenine. The HOMO density is primarily localized over the adenine and NDI moieties of NDI-A (Fig. 5c) and A-NDI-A (Fig. 5d) upon interaction with F− ions. Similarly, the LUMO density is mainly distributed over the NDI core, thus creating an ideal condition for push–pull.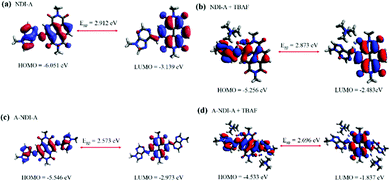 | ||
| Fig. 5 Frontier molecular orbitals of (a) NDI-A, (b) A-NDI-A, (c) NDI-A + TBAF and (d) A-NDI-A + 2TBAF with energy in eV. | ||
Therefore, delocalization of the FMOs indicates that NDI-A and A-NDI-A are efficient materials for supramolecular charge transfer interactions. Furthermore, these geometries were subjected to time-dependent density functional theory (TD-DFT) studies using the B3LYP/6-31G* level for charge transfer excitations. TD-DFT results were analyzed by employing the Gauss-Sum 2.2.5 program,31 and the TD-DFT results obtained are reported in Table S3 (ESI†). From the TD-DFT results (Table S3, ESI†) it is seen that the absorption peaks of NDI-A appeared at 481 nm, 363 nm, and 292 nm (Fig. S21a, ESI†) and those of A-NDI-A at 542 nm, 363 nm, and 320 nm (Fig. S21c, ESI†); those of NDI-A + TBAF are at 525 nm, 370 nm, and 304 nm (Fig. S21b, ESI†) and those of A-NDI-A + 2TBAF are at 538 nm, 370 nm and 321 nm (Fig. S21d, ESI†).
Electrochemical studies
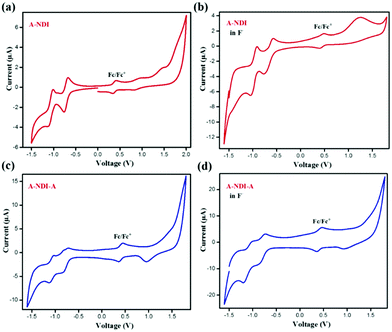
Cyclic voltammetry experiments were performed to evaluate the HOMO and LUMO energy levels of NDI-A, A-NDI-A, NDI-A-F and A-NDI-A-F complexes (Fig. 6). The voltammogram of NDI-A in the absence of fluoride anions exhibited prominent anodic and cathodic processes in the −1.5 to 2.0 V (vs. Fc/Fc+) region. The HOMO and LUMO energy levels calculated from onset oxidation of 1.60 V (ESI,† equiv. S1) and reduction of −0.69 V (ESI,† equiv. S1) (Fig. 6a and Table S4, ESI†) are found to be −6.30 eV and 4.01 eV, respectively. Upon addition of fluoride anions, from the CV measurements of NDI-A, the HOMO and LUMO energy levels obtained are −5.30 eV (Eoxonset = 0.90 V) and −3.99 eV (Eredonset = −0.40 V), respectively, (Fig. 6b and Table S4, ESI†). The CV graphs of A-NDI-A in the absence and presence of fluoride anions show the changes in oxidation and reduction potential values. The experimental HOMO and LUMO of A-NDI-A are found to be −5.99 eV (Eoxonset = 1.29 V) and −3.94 eV (Eredonset = −0.76 V) (Fig. 6c and Table S4, ESI†), respectively, in the absence of F− ions. Furthermore, upon addition of F− ions to A-NDI-A, the HOMO and LUMO energy levels were at −5.21 eV (Eoxonset = 0.81 V) and −3.67 eV (Eredonset = −0.72 V), respectively (Fig. 6d and Table S4, ESI†). Thus, in NDI-A and A-NDI-A, the change in onset oxidation and reduction potentials are attributed to the contribution of the additional negative charge from F− ions (Fig. 6b). The decrease in the HOMO and LUMO gaps of NDI-A and A-NDI-A upon addition of F− ions indicates the possibility of excited state intramolecular charge transfer.The shift in redox potentials to more negative potentials with increase in the number of electron donating morpholine units in mono-, di- and tetra-substituted morpholine NDI derivatives 1, 2 and 3 is in accordance with results observed in our work with A-NDI-A; the HOMO–LUMO levels are uplifted in comparison to their NDI-A derivative with one adenine unit.32
Transient absorption studies
Furthermore, to study the intramolecular charge transfer interactions, the driving force for intramolecular electron transfer (−ΔG0ET) was calculated using the Weller equation from the first oxidation and reduction potentials of the molecules indicating the formation of charge-separated states.33 Values of the driving force for charge separation (−ΔG0ET(CS)) and charge recombination (−ΔG0ET(CR)) have been calculated as shown in Table S4 (ESI†). It can be observed that NDI-A and A-NDI-A show higher driving force for charge recombination and lower for charge separation, which is a prerequisite for any thermodynamically driven charge separation process. On addition of F− ions, the driving force for charge separation has been further lowered indicating facile charge transfer and formation of charge-separated states.Ultrafast TAS is an important tool to identify the photogenerated charge carrier dynamics in organic semiconductor materials and has been used in the current study to identify the transitions in NDI-A and A-NDI-A molecules on excitation and formation of charge-separated states. TAS was performed using 1 × 10⁻⁵ M solutions of NDI-A and A-NDI-A in DCM and their mixtures with 50 equivalents TBAF as shown in Fig. 7; the data are summarized in Table S5 (ESI†) and Fig. 8 shows the energy level diagram with related transitions. A train of optical pulses from a Ti:sapphire laser amplifier (35 fs, 4 mJ per pulse, 1 kHz, and 800 nm) gets split into two beams using a beam splitter. A pump wavelength of 410 nm (3.0 eV) is selected for the excitation of the material and a probe pulse propagated through a CaF2 crystal is passed after a particular delay time to measure the differential absorption spectra in the visible region. The negative absorption features in TAS are the ground state bleaching (GSB) owing to ground state absorption (GSA) or stimulated emission (SE). The positive absorption features in TAS appear due to excited state absorption (ESA) of the generated transient species. NDI-A shows two main features in the TA spectra, i.e., (i) ESA between 500 and 590 nm with a maximum at ∼528 nm and 700 and 800 nm with a maximum at ∼760 nm and (ii) GSB between 590 and 690 nm with a maximum at ∼615 nm (Fig. 7A). The ESA between 500 and 590 nm is attributed to transition 1 for the singlet excited state absorption of NDI-A molecules appearing after 1.54 ps of delay time with a lifetime of 85 ps for the major species. The GSB between 500 and 590 nm appears with first excitation and intensity increases up to 50 ps. The life time of GSB was estimated to be ∼110 ps and attributed to stimulated emission (transition 2). Another ESA appears after a 5 ps delay time and the decay fits biexponentially. A short-lived species of 26 fs and long-lived species with 68 ps lifetimes are formed. These species can be assigned to adenine+˙ and NDI−˙ radical ions, respectively, formed due to intramolecular charge transfer resulting in the formation of charge-separated states (transition 3). On addition of TBAF to NDI-A, significant changes in TA spectra are observed (Fig. 7B). A clear ESA at 545 nm (transition 1) and GSB at 605 nm (stimulated emission, transition 2) along with several vibrational absorptions of up to 800 nm appear after 2.3 ps of excitation. With the addition of TBAF, the lifetimes of all the species are highly reduced (Table S5, ESI†). The broad GSB between 650 and 800 nm with a short lifetime corresponds to charge transfer state absorption (transition 4) with ultrafast relaxation.
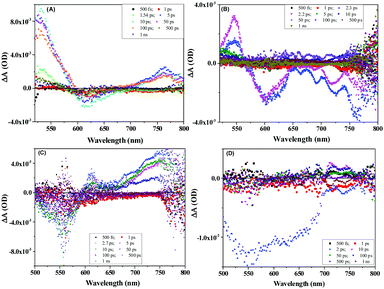 | ||
| Fig. 7 TAS spectra of (A) NDI-A (1 × 10⁻⁵ M), (B) NDI-A + TBAF (50 eq.), (C) A-NDI-A (1 × 10⁻⁵ M) and (D) A-NDI-A + TBAF (50 eq.) using a 410 nm pump wavelength. | ||
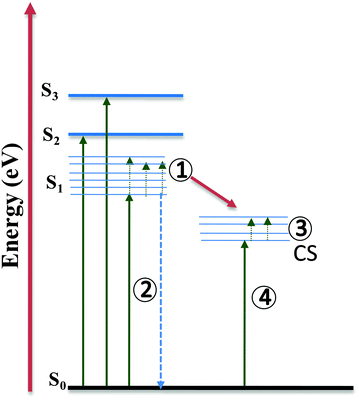 | ||
| Fig. 8 Energy level diagram with related transitions proposed based on absorption, emission and TAS study. | ||
Fig. 7C and D show the TA spectra of A-NDI-A and its mixture with TBAF, respectively. The GSB at 550 nm appears immediately after excitation and is attributed to absorption of A-NDI-A molecules with a lifetime of only 85 fs (transition 2). GSB decay with the appearance of ESA is observed between the 600 and 800 nm regions. The ESA at ∼615 nm corresponds to transition 1, while the ESA in the range of 650–800 nm appears due to the formation of charge-separated adenine+˙ and NDI−˙ radical ions (transition 3). On addition of TBAF, all the features are replaced with a broad GSB having a lifetime of ∼196 fs with a maximum at ∼555 nm (transition 2). The GSB at ∼735 nm, similar to that of NDI-A-TBAF, is attributed to the charge transfer state absorption between A-NDI-A and TBAF molecules (transition 4) and relaxes within 130 fs. TAS analysis clearly shows the CT state formation and absorption due to charge-separated states owing to intramolecular charge transfer between the adenine and NDI core. Lifetimes of transient species are highly quenched in the presence of TBAF corroborating well with the other analyses discussed above.
To establish the CT state formation, transient absorption spectroscopy (TAS) was performed for the control SVB-M1 molecule with a pump wavelength of 410 nm. In the TAS spectrum, excited state absorption is observed in the region from 490 to 540 nm with a maximum at 526 nm, which is attributed to singlet excited state absorption of NDI molecules with a lifetime of 11 ps. Ground state bleaching between 550 and 630 nm appears at 50 ps with a maximum at 597 nm with a lifetime of 345 fs. Another excited state absorption at 762 nm with a lifetime of 10 ps is observed corresponding to NDI radical anion formation (Fig. S22 and Table S5, ESI†). Similar behavior as observed from the TAS study of the A-NDI and A-NDI-A molecule is observed, which indicates that adenine does not play any special role in intramolecular charge transfer. The push–pull system, which is the charge transfer from the adenine moiety to NDI, has also been observed with a dimethyl group, so the electron density available at the nitrogen is responsible for the charge transfer interactions. In this derivative, the lifetime of transient species is lowered in comparison to those of A-NDI and A-NDI-A, so adenine allows formation of more stable charge-separated states. The transient study of T-S-NDI, in which a long chain aliphatic amine is attached to the core position of NDI and the carbonyl oxygen is replaced by sulphur, shows similar behavior with excited state absorption, ground state bleaching and transient absorption above 700 nm, which is assigned to the formation of the triplet excited state.34
Conclusions
Here, the design and synthesis of π-electronic push-pull type molecular architectures, i.e., NDI-A and A-NDI-A have been discussed, where the electron rich adenine moiety works as an electron donor and the NDI core acts as an electron acceptor. The effective intramolecular CT interaction has been established by absorption and emission study. This ICT is highly influenced by the presence of TBAF where the fluoride ion deprotonates the adenine N–H. The TAS study further showed the formation of charge-separated states in both the derivatives, the lifetimes of which are highly quenched on TBAF addition and control experiments with dimethyl core-substituted NDI support the hypothesis of an ICT effect in the presence of F−. The stable lifetimes of charge-separated states can be exploited in biomacromolecular systems such as DNA in the future.35Data availability
Experimental data associated with this article are provided in the ESI.†Author contributions
S. S. B. performed the synthesis, spectroscopic characterization, UV-vis, emission, TCSPC and cyclic voltammetry measurements. M. A. and M. K. performed the TAS experiments. A. L. P. performed DFT calculations. R. K., S. V. B. (IICT) and S. V. B. (G. U.) designed the experiments, supervised the work, and prepared the manuscript with contributions of all the authors.Conflicts of interest
There are no conflicts to declare.Acknowledgements
S. V. B. (IICT) is grateful for financial support from BRNS under the project No.: 58/14/01/2020-BRNS/37047 and the Director, CSIR-IICT (MS No.IICT/Pubs./2022/001). S. V. B. (GU) acknowledges University Grant Commission (UGC) Faculty Research Program, New Delhi, India (F.4-5(50-FRP) (IV-Cycle)/2017(BSR)) for the award of a Professorship and also acknowledges Council of Scientific & Industrial Research (CSIR), India for providing support, code No. 02(0357)/19/EMR-II. S. S. B. is grateful for financial support through an SRF from CSIR, New Delhi, India. The authors thank Dr L. Giribabu, Sr. Principal Scientist, for TCSPC measurements.Notes and references
- (a) J. T. Beatty, J. Overmann, M. T. Lince, A. K. Manske, A. S. Lang, R. E. Blankenship, C. L. Van Dover, T. A. Martinson and F. G. Plumley, Proc. Natl. Acad. Sci. U. S. A., 2005, 102, 9306–9310 CrossRef CAS PubMed; (b) J. T. Beatty, Photosynth. Res., 2002, 73, 109–114 CrossRef CAS PubMed.
- (a) N.-U. Frigaard and D. A. Bryant, in Complex Intracellular Structures in Prokaryotes, ed. J. M. Shively, Springer Verlag, 2006, vol. 2, 79–114 Search PubMed; (b) G. S. Orf and R. E. Blankenship, Photosynth. Res., 2013, 116, 315–331 CrossRef CAS PubMed.
- (a) R. van Grondelle, J. P. Dekker, T. Gillbro and V. Sundstrom, Biochim. Biophys. Acta, 1994, 1187, 1–65 CrossRef; (b) T. S. Balaban, in Handbook of Porphyrin Science with Applications to Chemistry, Physics, Materials Science, Engineering, Biology and Medicine, ed. K. M. Kadish, K. M. Smith, R. Guilard, World Scientific, 2010, vol. 1, 221–306 Search PubMed.
- (a) J. Barber and B. Andersson, Nature, 1994, 370, 31–34 CrossRef CAS; (b) K. R. Reddy, J. Jiang, M. Krayer, M. A. Harris, J. W. Springer, E. Yang, J. Jiao, D. M. Niedzwiedzki, D. Pandithavidana, P. S. Parkes-Loach, C. Kirmaier, P. A. Loach, D. F. Bocian, D. Holten and J. S. Lindsey, Chem. Sci., 2013, 4, 2036–2053 RSC; (c) W. Leibl and P. Mathis, Electron Transfer in Photosynthesis. Series on Photoconversion of Solar Energy, 2004, vol. 2, p. 117 Search PubMed.
- (a) K. M. Kadish, K. M. Smith and R. Guilard, The Porphyrin Handbook, Academic Press: San Diego, CA, USA, 2000 Search PubMed; (b) V. Balzani, A. Credi and M. Venturi, ChemSusChem, 2008, 1, 26–58 CrossRef CAS PubMed; (c) S. Fukuzumi, Phys. Chem. Chem. Phys., 2008, 10, 2283–2297 RSC; (d) D. Gust, T. A. Moore and A. L. Moore, Acc. Chem. Res., 2009, 42, 1890–1898 CrossRef CAS PubMed; (e) H. Imahori, T. Umeyama and S. Ito, Acc. Chem. Res., 2009, 42, 1809–1818 CrossRef CAS PubMed; (f) M. R. Wasielewski, Acc. Chem. Res., 2009, 42, 1910–1921 CrossRef CAS PubMed; (g) G. Bottari, G. de la Torre, D. M. Guldi and T. Torres, Chem. Rev., 2010, 110, 6768–6816 CrossRef CAS PubMed; (h) D. Kim, Multiporphyrin Arrays: Fundamentals and Applications, Pan Stanford Publishing, Singapore, 2012 CrossRef; (i) F. D’Souza and O. Ito, Chem. Soc. Rev., 2012, 41, 86–96 RSC.
- (a) K. C. Hwang and D. Mauzerall, Nature, 1993, 361, 138–140 CrossRef CAS PubMed; (b) S. Bhosale, A. L. Sisson, P. Talukdar, A. Fürstenberg, N. Banerji, E. Vauthey, G. Bollot, J. Mareda, C. Röger, F. Würthner, N. Sakai and S. Matile, Science, 2006, 313, 84–86 CrossRef CAS PubMed; (c) F. Würthner, S. Ahmed, C. Thalacker and T. Debaerdemaeker, Chem. – Eur. J., 2002, 8, 4742–4750 CrossRef; (d) X. Lu, W. Zhu, Y. Xie, X. Li, Y. Gao, F. Li and H. Tian, Chem. – Eur. J., 2010, 16, 8355–8364 CrossRef CAS PubMed.
- (a) S. Fukuzumi, K. Ohkubo, F. D’Souza and J. L. Sessler, Chem. Commun., 2012, 48, 9801–9815 RSC; (b) S. Fukuzumi and K. Ohkubo, Coord. Chem. Rev., 2010, 254, 373–385 CrossRef.
- (a) C. F. Yocum, Coord. Chem. Rev., 2007, 252, 296–305 CrossRef; (b) J. P. McEvoy and G. W. Brudvig, Chem. Rev., 2006, 106, 4455–4483 CrossRef CAS PubMed; (c) L. M. Utsching and M. C. Thurnauer, Acc. Chem. Res., 2004, 37, 439–447 CrossRef PubMed.
- Long-Range Charge Transfer in DNA I & II, in Topics in Current Chemistry, ed. G. B. Schuster, 2004, vol. 219, p. 244 Search PubMed.
- (a) S. Sivakova and S. J. Rowan, Chem. Soc. Rev., 2005, 34, 9–12 RSC; (b) J. L. Sessler, C. M. Lawrence and J. Jayawickramarajah, Chem. Soc. Rev., 2007, 36, 314–325 RSC; (c) F. Pu, J. Ren and X. Qu, Chem. Soc. Rev., 2018, 47, 1285–1306 RSC.
- W. Xu, K. M. Chan and E. T. Kool, Nat. Chem., 2017, 9, 1043–1055 CrossRef CAS PubMed.
- D. C. Ward, E. Reich and L. Stryer, J. Biol. Chem., 1969, 244, 1228 CrossRef CAS.
- E. L. Rachofsky, R. Osman and J. B. Ross, Biochemistry, 2001, 40, 946–956 CrossRef CAS PubMed.
- (a) S. O. Kelly and J. K. Barton, Science, 1999, 283, 375–381 CrossRef PubMed; (b) V. Shafirovich, J. Cadet, D. Gasparutto, A. Douradin, W. Huang and N. E. Geacintov, J. Phys. Chem. B, 2001, 105, 586–592 CrossRef CAS; (c) K. A. Paterson, J. Arlt and A. C. Jones, Methods Appl. Fluoresc., 2020, 8, 025002 CrossRef CAS PubMed.
- (a) J. Jortner, M. Bixon, T. Langenbacher and M. E. Michel-Beyerle, Proc. Natl. Acad. Sci. U. S. A., 1998, 95, 12759–12765 CrossRef CAS PubMed; (b) K. Kawai and T. Majima, Acc. Chem. Res., 2013, 46, 2616–2625 CrossRef CAS PubMed.
- (a) F. Würthner, A. Shahadat, C. Thalacker and T. Debaerdemaeker, Chem. – Eur. J., 2002, 8, 4742–4750 CrossRef; (b) N. Sakai, J. Mareda, E. Vauthey and S. Matile, Chem. Commun., 2010, 46, 4225–4237 RSC; (c) S. V. Bhosale, S. V. Bhosale and S. K. Bhargava, Org. Biomol. Chem., 2012, 10, 6455–6468 RSC; (d) A. Insuasty, S. Maniam and S. J. Langford, Chem. – Eur. J., 2019, 25, 7058–7073 CrossRef CAS PubMed.
- (a) S. R. Greenfield, W. A. Svec, D. Gosztola and M. R. Wasielewski, J. Am. Chem. Soc., 1996, 118, 6767–6777 CrossRef CAS; (b) M. Borgstroem, N. Shaikh, O. Johansson, M. F. Anderlund, S. Styring, B. Aakermark, A. Magnuson and L. Hammarstroem, J. Am. Chem. Soc., 2005, 127, 17504–17515 CrossRef CAS PubMed; (c) S. J. Langford, M. J. Latter and C. P. Woodward, Photochem. Photobiol., 2006, 82, 1530–1540 CAS; (d) I. V. Sazanovich, M. A. H. Alamiry, J. Best, R. D. Bennett, O. V. Bouganov, E. S. Davies, V. P. Grivin, A. J. H. M. Meijer, V. F. Plyusnin, K. L. Ronayne, A. H. Shelton, S. A. Tikhomirov, M. Towrie and J. A. Weinstein, Inorg. Chem., 2008, 47, 10432–10445 CrossRef CAS PubMed.
- (a) S. Bhosale, C. Jani and S. Langford, Chem. Soc. Rev., 2008, 37, 331–342 RSC; (b) S. V. Bhosale, M. Al Kobaisi, R. W. Jadhav, P. P. Morajkar, L. A. Jones and S. George, Chem. Soc. Rev., 2021, 50, 9845–9998 RSC.
- (a) N. Banerji, S. V. Bhosale, I. Petkova, S. J. Langford and E. Vauthey, Phys. Chem. Chem. Phys., 2011, 13, 1019–1029 RSC; (b) D. Srivani, A. Gupta, S. V. Bhosale, K. Ohkubo, R. S. Bhosale, S. Fukuzumi, A. Bilic, L. A. Jones and S. V. Bhosale, Asian J. Org. Chem., 2018, 7, 220–226 CrossRef CAS.
- (a) S. V. Bhosale, S. V. Bhosale, M. B. Kalyankar and S. J. Langford, Org. Lett., 2009, 11, 5418–5421 CrossRef CAS PubMed; (b) S. R. Bobe, S. V. Bhosale, L. Jones, A. L. Puyad, A. M. Raynor and S. V. Bhosale, Tetrahedron Lett., 2015, 56, 4762–4766 CrossRef CAS.
- S. Fukuzumi, K. Ohkubo, F. D’Souza and J. L. Sessler, Chem. Commun., 2012, 48, 9801–9815 RSC.
- D. Egloff, I. A. Oleinich and E. Freisinger, ACS Chem. Biol., 2015, 10, 547–555 CrossRef CAS PubMed.
- (a) H. Vollmann, H. Becker, M. Corell and H. Streeck, Justus Liebigs Ann. Chem., 1937, 531, 1–159 CrossRef CAS; (b) S. V. Bhosale, M. B. Kalyankar, S. V. Bhosale, S. J. Langford, E. F. Reid and C. Hogan, New J. Chem., 2009, 33, 2409–2413 RSC.
- A. Robitaille, S. A. Jenekhe and M. Leclerc, Chem. Mater., 2018, 30, 5353–5361 CrossRef CAS.
- O. Ushchenko, G. Licari, S. Mosquera-Vazquez, N. Sakai, S. Matile and E. Vauthey, J. Phys. Chem. Lett., 2015, 6, 2096–2100 CrossRef PubMed.
- H. A. Benesi and J. H. Hildebrand, J. Am. Chem. Soc., 1949, 71, 2703–2707 CrossRef CAS.
- J. R. Lakowicz, Principles of Fluorescence Spectroscopy, Springer; Singapore, 3rd edn, 2006 Search PubMed.
- M. J. Frisch, G. W. Trucks, H. B. Schlegel, G. E. Scuseria, M. A. Robb, J. R. Cheeseman, G. Scalmani, V. Barone, B. Mennucci, G. A. Petersson, H. Nakatsuji, M. Caricato, X. Li, H. P. Hratchian, A. F. Izmaylov, J. Bloino, G. Zheng, J. L. Sonnenberg, M. Hada, M. Ehara, K. Toyota, R. Fukuda, J. Hasegawa, M. Ishida, T. Nakajima, Y. Honda, O. Kitao, H. Nakai, T. Vreven, J. A. Montgomery Jr., J. E. Peralta, F. Ogliaro, M. Bearpark, J. J. Heyd, E. Brothers, K. N. Kudin, V. N. Staroverov, T. Keith, R. Kobayashi, J. Normand, K. Raghavachari, A. Rendell, J. C. Burant, S. S. Iyengar, J. Tomasi, M. Cossi, N. Rega, J. M. Millam, M. Klene, J. E. Knox, J. B. Cross, V. Bakken, C. Adamo, J. Jaramillo, R. Gomperts, R. E. Stratmann, O. Yazyev, A. J. Austin, R. Cammi, C. Pomelli, J. W. Ochterski, R. L. Martin, K. Morokuma, V. G. Zakrzewski, G. A. Voth, P. Salvador, J. J. Dannenberg, S. Dapprich, A. D. Daniels, O. Farkas, J. B. Foresman, J. V. Ortiz, J. Cioslowski and D. J. Fox, Gaussian 09, Revision C.01, Gaussian, Inc., Wallingford CT, 2010 Search PubMed.
- Avogadro: an open-source molecular builder and visualization tool. Version 1.1.0. https://avogadro.openmolecules.net/.
- M. D. Hanwell, D. E. Curtis, D. C. Lonie, T. Vandermeersch, E. Zurek and G. R. Hutchison, J. Cheminf., 2012, 4, 17 CAS.
- N. M. O’Boyle, A. L. Tenderholt and K. M. Langner, J. Comput. Chem., 2008, 29, 839–845 CrossRef PubMed.
- S. Quinn, E. S. Davies, C. R. Pfeiffer, W. Lewis, J. McMaster and N. R. Champness, ChemPlusChem, 2017, 82, 489–492 CrossRef CAS PubMed.
- N. Gupta, C. Sharma, M. Kumar and R. Kumar, New J. Chem., 2017, 41, 13276–13286 RSC.
- M. Hussain, J. Zhao, W. Yang, F. Zhong, A. Karatay, H. G. Yaglioglu, E. A. Yildiz and M. Hayvali, J. Lumin., 2017, 192, 211–217 CrossRef CAS.
- T. Takada, K. Kawai, X. Cai, A. Sugimoto, M. Fujitsuka and T. Majima, J. Am. Chem. Soc., 2004, 126, 1125–1129 CrossRef CAS PubMed.
Footnotes |
| † Electronic supplementary information (ESI) available. See DOI: https://doi.org/10.1039/d2ma00030j |
| ‡ These students contributed equally to this work. |
| This journal is © The Royal Society of Chemistry 2022 |

