 Open Access Article
Creative Commons Attribution 3.0 Unported Licence
Electrochemical detection of Pb(II) and Cd(II) using bismuth ferrite nanoparticle modified carbon paste electrodes
Yonas
Beyene
 *,
Zelalem
Bitew
 and
Fasika
Fekade
Department of Chemistry, College of Science, Bahir Dar University, Bahir Dar, Ethiopia. E-mail: yonasb94@gmail.com
First published on 1st June 2022
Abstract
This study presents bismuth ferrite nanoparticle (BFO) modified carbon paste electrodes (BFO/CPEs) for the determination of lead and cadmium. XRD and FT-IR spectroscopy were used to characterize the bismuth ferrite nanoparticles synthesized following the procedure described in the Experimental section. Cyclic voltammetry was used to evaluate the electrochemical behavior of the two metals at the modified electrode relative to the unmodified electrode. In contrast to the unmodified carbon paste electrode, the BFO/CPE within the potential range of −1.2 V to 0.0 V vs. Ag/AgCl revealed distinct and undistorted peaks, with a much enhanced peak current showing the electrocatalytic properties of films that may be accounted for the increased conductivity and surface area of the BFO. Under optimized conditions, the differential pulse stripping voltammetric peak current response of the BFO/CPE showed a linear dependence on the concentration in the range of 2–200 μM with limits of detection of 0.03 μM and 0.05 μM for Pb(II) and Cd(II), respectively. Spike recovery results of 90.4–102.4% for Pb(II) validated the applicability of the method for the determination of Pb(II) and Cd(II) in tap water samples.
1. Introduction
The release of pollutants into the environment as a result of industrialization and rapid development of agriculture and urbanization is becoming a great concern to humans.1,2 Heavy metals such as lead, cadmium, chromium, zinc and mercury, which are non-degradable and the most persistent pollutants in the environment, are the most critical since they seriously affect human health.3–5 Heavy metals can accumulate not only in the soil environment but also in plants and groundwater, which may cause adverse effects to the ecosystem safety and pose a threat to animals, plants, and humans.4,5Heavy metals can enter living organisms and the human body via the food chain leading to the slowing of the progression of physical, muscular, and neurological, degenerative processes and incremental of chronic diseases such as cancer.5,6 Contaminated air, ground water, soil, house dust, metal ores, industrial processes, contaminated food, herbal product food via food chain and inhalation are among numerous sources of heavy metal poisoning in humans.6,7
Lead and cadmium are among the most toxic and hazardous heavy metals which cause adverse health effects including the dysfunction of different body organs such as the kidneys, brain, reproductive organs, intelligence and mental retardation in humans.7,8 Various sources of lead exposure for pollution of the environment are anthropogenic activities including industrial emissions, lead paints, manufacturing of lead batteries, ceramic glazes, emissions of automobiles, mining processes, fertilizers, pesticides, and contaminated foods.7–9 Foods like fruits, vegetables, grains and wine may contain lead if the food plants grow on the contaminated land or with contaminated water.8,10
Cadmium is a toxic transition metal with several sources of human exposure including metal industries, production of batteries, stabilizers for plastics, coatings and platings, fertilizers and consumption of tobacco products.11,12 Cadmium, which accumulates primarily in the liver and kidneys and can enter our body by smoking, inhaling air, and through food or drink, has been designated as a human carcinogen according to the World Health Organization's International Agency for Research on Cancer and the United States National Toxicology Program.6,8,11 Cadmium exposure leads to glutathione depletion, inhibition of antioxidant enzymatic activity, osteoporosis, behavioral change, DNA damage, fertility disorders and occurrence of different cancers.9,12 The Itai–Itai disease, which softens the bones because of renal tubular dysfunction, is a well-known health hazard induced by chronic cadmium poisoning.13 Hence, a cheap, sensitive, selective, and environmentally friendly method to monitor the amount of lead and cadmium in different matrices related to human beings is crucial.
Several analytical methods including atomic absorption spectroscopy,14,15 inductively coupled plasma-atomic emission spectrometry,16,17 and inductively coupled plasma-optical emission spectrometry18,19 are among the reported methods for the determination of lead and cadmium in various sample matrices. However, these methods require laborious sample preparation, advanced expertise, high operational costs and long analysis time.20,21 In contrast to these methods, electrochemical methods based on chemically modified electrodes have recently gained attention due to their advantages including higher sensitivity, higher selectivity, low cost, short response time, suitability for on-site detection and friendly to the environment.22–25 Among various electrochemical techniques, stripping voltammetric analysis has been widely applied for the quantification of heavy metal ions owing to its efficient accumulation step and measurements of pre-concentrated target ions in the stripping step.26
In recent years, chemically modified electrodes have been used strategically to improve the conductivity, selectivity, sensitivity, stability and surface area of the working electrode.21,27–29 Carbon paste electrodes (CPEs) have recently attracted a lot of attention due to their benefits such as low background current, easy preparation, quick surface renewal and bulk modification capability.30 Chemically modified CPEs have been used in stripping analyses to improve electrochemical responses because of these advantages.21
Different chemically modified electrodes based on polyamidoamine dendrimer functionalized iron oxide nanoparticles/CPE,21 graphene/gold nanoparticles/modified L-cysteine nanocomposite/GCE,23 Fe3O4/Bi2O3/C3N4 nanocomposite/GCE,27 engineered MWCNTs/GCE,31 Bi/MWCNT-emeraldine base polyaniline-Nafion composite/GCE,32 BiOCl/MWNT/GCE,33 and bismuth nanoparticles/GCE34 are among the electrode materials reported for the simultaneous determination of lead and cadmium in different matrices.
Bismuth modified electrodes have been developed as a successful replacement for toxic mercury electrodes in the determination of trace heavy metals, due to their simple preparation, high sensitivity, longer deposition time, and the very low toxicity.25,32–34 To date, the research on bismuth-based electrodes is mainly focused on bismuth film coated electrodes including Nafion26,35,36 and multiwall carbon nanotube composites32,34 which have exhibited improved sensitivity, and reproducibility in the electrochemical determination of heavy metals. However, these materials are expensive for routine sample analysis. To overcome this limitation, the BFOCPE, which exhibits a new and cheaper approach, has been developed for the determination of heavy metal ions including lead and cadmium.
The introduction of nanoparticles onto the electrode surface led to the improved electrochemical performance of the electrode due to their increased surface area coupled with the enhanced mass transfer effect.34,37,38 Bismuth ferrite, BiFeO3 (BFO), which shows strong ferroelectric and antiferromagnetic properties simultaneously, has attracted considerable attention in recent years.39–41
In this work, the synthesis of bismuth ferrite (Bi24Fe2O39) nanoparticles, fabrication of the BFO/CPE, and characterization and electrochemical sensor application of the BFO/CPE for the electrochemical determination of lead and cadmium are reported. To the best of our knowledge, no work about such an electrode for electrochemical determination of lead and cadmium has been reported to date. The characterization of bismuth ferrite nanoparticles was studied by X-ray diffraction (XRD) and Fourier transform infrared (FTIR) spectroscopy analysis. The electrochemical behaviors of lead and cadmium at the BFO/CPE were studied by cyclic voltammetry. Finally, the electrochemical application of the sensor was verified by the analysis of lead and cadmium using differential pulse stripping voltammetry in water samples.
2. Materials and methods
2.1. Chemicals and apparatus
Bi(NO3)3·5H2O, Fe(NO3)3·9H2O (99%, Trust), ethylene glycol (99%, Alpha), citric acid (99.9%, SELAB), graphite powder (≥99.0%, Blulux laboratories (Pvt) Ltd), Pb(NO3)2 (99.5%, BDH), Cd(NO3)2·4H2O (99.5%, BDH), glacial acetic acid (99.5%, Blulux laboratories (Pvt) Ltd), sodium acetate (98%, Blulux laboratories (Pvt) Ltd), sodium hydroxide (97%, Blulux laboratories (Pvt) Ltd), hydrogen chloride HCl (37%, Blulux laboratories (Pvt) Ltd) and distilled water were among the chemicals used. All the chemicals and reagents were of analytical grade and hence used without further purification.The CHI 760E potentiostat (Austin, Texas, USA), Fourier transform infrared spectrometer (JASCO FT/IR-6600, Japan), X-ray diffractometer (MAXIma7000, SHIMADZU Corporation, Japan), pH meter (Adwa, Hungary), analytical electronic balance (Nimbus, ADAM equipment, USA), heating mantle (Hoven Labs, Korea), mortar and pestle, magnetic stirrer and hot plate (Daihan scientific, Korea) were among the equipment/instruments used.
2.2. Procedures
![[thin space (1/6-em)]](https://www.rsc.org/images/entities/char_2009.gif) :
:![[thin space (1/6-em)]](https://www.rsc.org/images/entities/char_2009.gif) 30 (w/w) were mixed and homogenized thoroughly with a mortar and pestle for 40 min. The homogenized paste was packed into a Teflon tube and a copper wire was inserted on the opposite side of a Teflon tube to provide electrical contact. The BFO modified CPE was prepared by varying the mass of BFO added (15, 20, and 30 mg of BFO) and keeping the amount of the graphite powder and paraffin oil constant (1.0 and 0.429 g, respectively). The mixtures of graphite powder, paraffin, and varied amounts of BFO were homogenized for 40 min and left for further 24 h. Thus, three carbon paste electrodes modified with various amounts of BFO were prepared.
30 (w/w) were mixed and homogenized thoroughly with a mortar and pestle for 40 min. The homogenized paste was packed into a Teflon tube and a copper wire was inserted on the opposite side of a Teflon tube to provide electrical contact. The BFO modified CPE was prepared by varying the mass of BFO added (15, 20, and 30 mg of BFO) and keeping the amount of the graphite powder and paraffin oil constant (1.0 and 0.429 g, respectively). The mixtures of graphite powder, paraffin, and varied amounts of BFO were homogenized for 40 min and left for further 24 h. Thus, three carbon paste electrodes modified with various amounts of BFO were prepared.
2.3. Electrochemical measurements
A three electrode system with Ag/AgCl (3.0 M KCl) as a reference electrode, Pt coil as a counter electrode, and an unmodified CPE or BFO/CPE as a working electrode was used for electrochemical measurements. X-ray diffraction and Fourier transform infrared spectroscopy were used to characterize the BFO thin film, whereas cyclic voltammetry was used to investigate the electrochemical behaviors of Cd(II) and Pb(II) at the surface of the BFO modified CPE. Furthermore, differential pulse stripping voltammetry was employed for the determination of Cd(II) and Pb(II) in tap water samples.3. Results and discussion
3.1. Characterization of BFO thin films
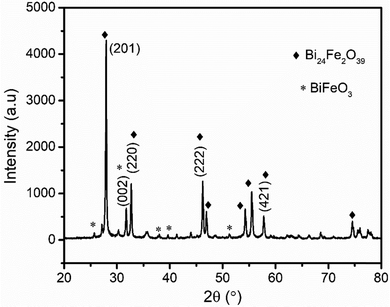
X-Ray diffraction (XRD) and Fourier transform infrared (FT-IR) spectroscopy were applied to characterize the BFO thin film synthesized following the procedure described in the Experimental section.nλ = 2d![[thin space (1/6-em)]](https://www.rsc.org/images/entities/i_char_2009.gif) sin sin![[thin space (1/6-em)]](https://www.rsc.org/images/entities/i_char_2009.gif) θ θ | (1) |
The crystallite size was also calculated by the Debye–Scherer formula (eqn (2)) according to the (201) diffractive peak.
 | (2) |
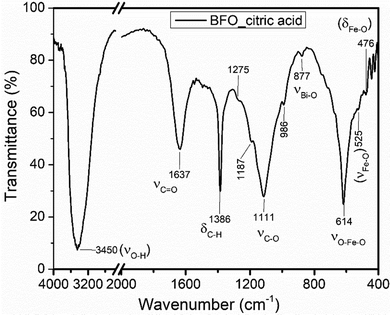
![[double bond, length as m-dash]](https://www.rsc.org/images/entities/char_e001.gif) O stretching at a frequency of 1637 cm−1 signified the presence of the carbonyl functional group, a sharp strong absorption peak at 1386 cm−1 assigned to the C–H bending and a medium broad band that is positioned at 1111 cm−1 confirmed the C–O stretching.45 Furthermore, a weak absorption peak at 877 cm−1 due to the Bi–O stretching vibration and a strong sharp peak positioned at a frequency of 614 cm−1 corresponds to the O–Fe–O stretching. Specifically, strong absorption peaks at 400–600 cm−1 are attributed to the Fe–O stretching and bending which revealed the formation of BFO.6 Hence, the appearance of new peaks or peaks with different features in the mixture and precursor added could be taken as the confirmation of the formation of a new substance, Bi24Fe2O39.
O stretching at a frequency of 1637 cm−1 signified the presence of the carbonyl functional group, a sharp strong absorption peak at 1386 cm−1 assigned to the C–H bending and a medium broad band that is positioned at 1111 cm−1 confirmed the C–O stretching.45 Furthermore, a weak absorption peak at 877 cm−1 due to the Bi–O stretching vibration and a strong sharp peak positioned at a frequency of 614 cm−1 corresponds to the O–Fe–O stretching. Specifically, strong absorption peaks at 400–600 cm−1 are attributed to the Fe–O stretching and bending which revealed the formation of BFO.6 Hence, the appearance of new peaks or peaks with different features in the mixture and precursor added could be taken as the confirmation of the formation of a new substance, Bi24Fe2O39.
3.2. Electrochemical behavior of Pb(II) and Cd(II) at the BFO/CPE
The electrochemical behavior of Pb(II) and Cd(II) ions was evaluated using cyclic voltammetry at the surface of the unmodified CPE and BFO/CPE. To evaluate the sensitivity and selectivity of the BFO/CPE over the unmodified CPE towards the electrochemical reaction of both the analytes, the cyclic voltammograms of the 1.0 mM mixture of Cd(II) and Pb(II) in pH 4.5 ABS (Fig. 3) were recorded. As it can be seen from the figure (red curve), the redox couple peak current responses using the BFO/CPE within the potential range of −1.2 V to 0.0 V electrode vs. Ag/AgCl for both metals were distinct and well-defined peaks, indicating that the bismuth ferrite nanoparticles are responsible for the attractive electroanalytical detection behavior. On the other hand, for both metal analytes, small and weak peaks are observed at the bare CPE (black curve). The observed significant peak current enhancement (ca. 4 times) and a significant decrease in over potential (ca. 193 mV) at the BFO/CPE indicated the electrocatalytic properties of the modifier that may be accounted for the increased conductivity and surface area of the BFO.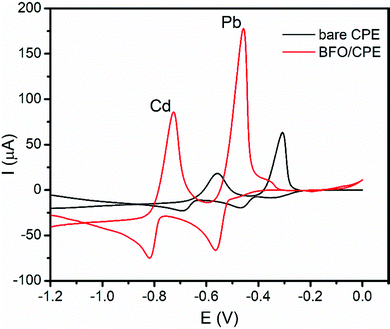 | ||
| Fig. 3 Cyclic voltammograms of a mixture of 1.0 mM Cd(II) and Pb(II) in pH 4.5 ABS at the unmodified (black line) and BFO modified CPE (red line). | ||
3.3. Effect of the scan rate on the peak potential and peak current
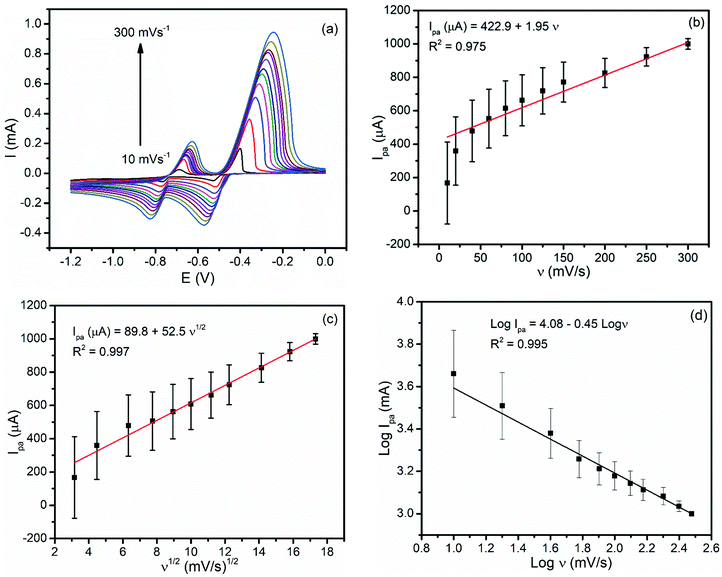
In order to investigate the reversibility and the types of reaction kinetics each metal undergoes at the modified carbon paste electrode, the influence of the scan rate (ν) on the oxidation peak current (Ipa) was evaluated. As illustrated in Fig. 4(a), both the oxidation and reduction peaks showed potential shifts for each metal with a scan rate indicating the irreversibility of the redox process. Moreover, a better correlation coefficient for the dependence of the peak current on the square root of the scan rate (R2 = 0.997 (Fig. 4(c)) than that on the scan rate (R2 = 0.975) (Fig. 4(b)) confirmed that the oxidation reaction of both metals at the BFO modified CPE was controlled by mass transfer.6 The plot of the log of the oxidative peak current versus the log of rate (Fig. 4(d)) with a slope value of 0.45 being close to the ideal value of a diffusion controlled reaction (0.5) confirmed the diffusion mass transport oxidation of both Pb2+ and Cd2+ at the BFO modified CPE.3.4. Optimization of the amount of the BFO film in the carbon paste
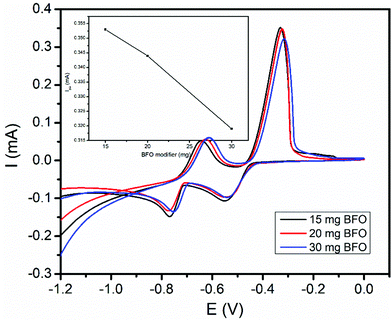
The amount of BFO in the carbon paste had a significant influence on the voltammetric response of the modified electrode. Thus, the effect of the amount of the BFO film on the peak current response of the modified CPE for both the studied metals was checked. Three different carbon paste electrodes with various proportions of the BFO modifier (15, 20, and 30 mg) were prepared. Fig. 5 presents the cyclic voltammograms of a mixture of 1.0 mM Cd(II) and Pb(II) at the BFO/CPE loaded with various amounts of BFO. As illustrated in the inset of Fig. 5, the electrode modified with 15 mg of BFO revealed maximum anodic peaks for both the analytes. Hence, an electrode containing 15 mg of BFO was applied for all the subsequent experiments.3.5. Differential pulse stripping voltammetry for the determination of Pb(II) and Cd(II)
Differential pulse stripping voltammetry (DPSV) was applied for the simultaneous determination of Pb(II) and Cd(II) in the tap water sample because of its remarkably high sensitivity.463.5.1.1. Deposition potential. As the method which was selected for the determination of the two metals in the effluent sample is stripping, the effects of deposition potential and accumulation time on the magnitude of the peak current were investigated.
The effect of deposition potential (Eacc) on the peak current was investigated by changing the potential from −0.9 V to −1.4 V keeping the deposition time at 60 s and the results are illustrated in Fig. 6a. As shown in Fig. 6a, the anodic peak current for both metal ions increase from an Eacc of −0.9 to −1.2 V and then decreased at a deposition potential beyond −1.2 V. Thus, the deposition potential, −1.2 V, was selected as the optimum potential for further experiments.
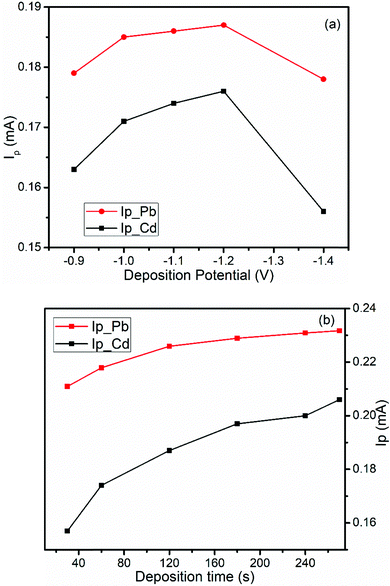 | ||
| Fig. 6 Effects of (a) deposition potential and (b) deposition time on the DPSV peak current of a mixture of 1.0 mM Pb(II) and Cd(II) in pH 4.5 ABS at the BFO/CPE. | ||
3.5.1.2. Accumulation time. The effect of the accumulation time (tacc) on the oxidation peak current at the BFO/CPE was also investigated over the range of 30 s to 270 s keeping an accumulation potential at −1.2 V (Fig. 6b). As can be seen from the figure, the peak current increased with the increase of the pre-concentration time when the accumulation time was varied from 30 to 270 s. There was a rapid increment in the peak current from 30 to 180 s but a further increase of accumulation time results in a steady state accumulation level of the metal ions at the electrode surface. Therefore, 180 s was selected as the optimal deposition time for further analysis.
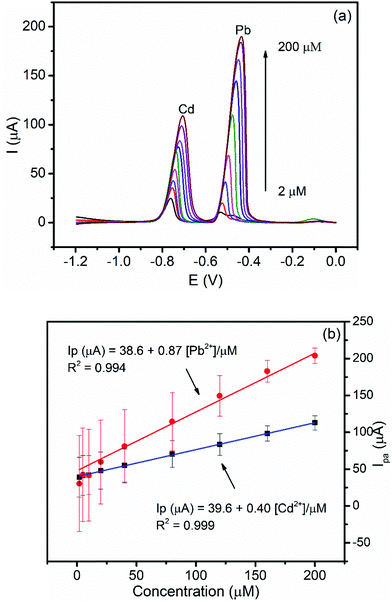
3.5.2.1. Both variable concentration calibration. The dependence of the peak current on the concentrations of Cd(II) and Pb(II) and the inherited sensitivity of the method was investigated under optimized conditions. Fig. 7a shows the back ground corrected DPSV curves of the equimolar various concentrations of Cd(II) and Pb(II) in pH 4.5 ABS at the BFO/CPE. As can be seen from Fig. 7b, the anodic peak current of both analytes showed a linear dependence on the concentration in the studied concentration range (2–200 μM) with correlation coefficients (R2) of 0.994 and 0.999 for Pb(II) and Cd(II), respectively. Moreover, detection limits for the simultaneous determination of Pb(II) and Cd(II) were found to be 0.03 μM and 0.05 μM, respectively.
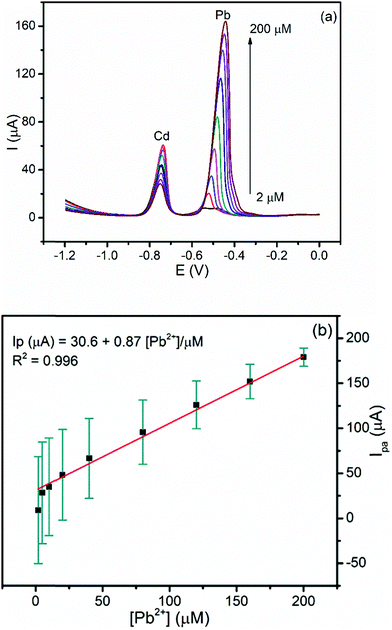
3.5.2.2. Calibration curve of Pb(II) at a constant concentration of Cd(II). The influence of the presence of the constant amount of Cd(II) on the linear dependence of the anodic peak current of Pb(II) on its concentration was investigated. Fig. 8a presents the DPSV curves of various concentrations of Pb(II) while the concentration of Cd(II) was kept constant under the optimized conditions. The anodic peak current for Pb(II) showed a linear dependence in the range of 2–200 μM with a LOD and R2 of 0.03 μM and 0.996, respectively (Fig. 8b). It is worth nothing that the values of the LOD of Pb(II) in the simultaneous and individual determination are similar. This result indicated the possibility for the determination of Pb(II) even in the presence of Cd(II) in real samples including the tap water.
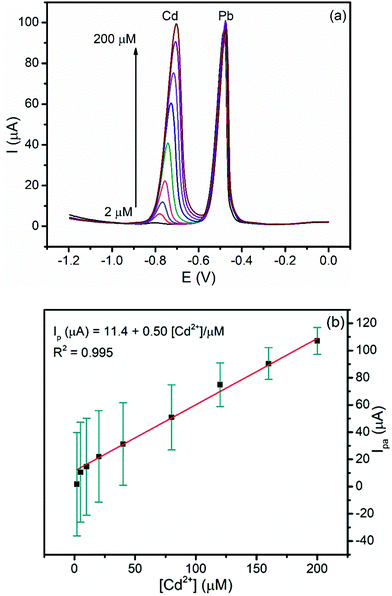
3.5.2.3. Calibration curve of Cd(II) at a constant concentration of Pb(II). In order to investigate the effect of the presence of Pb(II) on the determination of Cd(II), the dependence of the anodic peak current response of the modified electrode on the concentration of Cd(II) in the presence of a fixed concentration of Pb(II) was recorded (Fig. 9a). The anodic peak current of Cd(II) increased linearly with concentration (R2 = 0.995) whereas the anodic peak current for the constant concentration of Pb(II) remained constant. The LOD of Cd(II) is 0.06 μM, which is very close to that obtained in simultaneous determination confirming the possibility of determining Cd(II) even in the presence of Pb(II) in a sample like tap water (Fig. 9b).
3.6. Electrochemical mechanism for sensing Pb(II) and Cd(II)
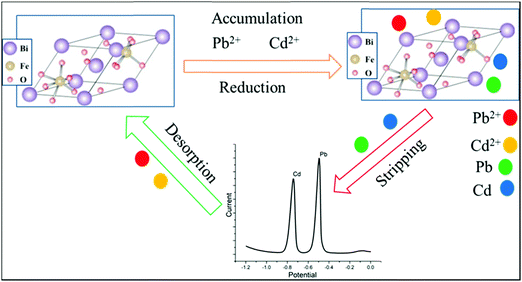
In the simultaneous detection of the metal ions, using DPSV, the electrochemical mechanism could be based on several occurrences. In the process, at the surface of bismuth ferrite, the modified CPE adsorption of metal ions via electrostatic attraction will occur. Certainly, with the role of the electronic vacancies of Pb(II) and Cd(II), a dative covalent bond with a tetragonal crystal structure47 of Bi24Fe2O39 can form. With a spacing distance between 0.161 and 0.280 nm of the synthesized nanoparticle, Pb(II) and Cd(II) having ionic radii of 0.15 nm and 0.095 nm,48 respectively, will intercalate during the accumulation period. Later, during the voltammetric analysis, the metal ions will be reduced with the applied potential to their corresponding atoms. As shown in the schematic illustration in Fig. 10, the ions will be released again to the electrolytic cell after stripping the metals.3.7. Comparison of the present method with previously reported methods
The analytical performance of the proposed method was compared with several methods reported in the literature and the results are summarized in Table 1. The result showed that the limit of determination obtained in this study was comparable to those in the other previously reported methods.| Electrode | Method | LOD (μM) | Ref. | |
|---|---|---|---|---|
| Pb(II) | Cd(II) | |||
| Fe3O4/Bi2O3/C3N4/GCE | SWASV | 0.003 | 0.001 | 27 |
| BiOCl/MWNT-GCE | SWASV | 0.009 | 0.0356 | 33 |
| MnFe2O4@Cys/GCE | SWASV | 0.06 | 0.221 | 49 |
| Stainless steel electrode (Type 304) | SWASV | 0.033 | 0.23 | 50 |
| MWCNT/P1,5-DAN/Pt | SWASV | 0.010 | 0.0284 | 51 |
| screen-printed bismuth oxide/GCE | SWASV | 0.011 | 0.013 | 52 |
| BFO/CPE | DPSV | 0.03 | 0.05 | This work |
3.8. Real sample analysis
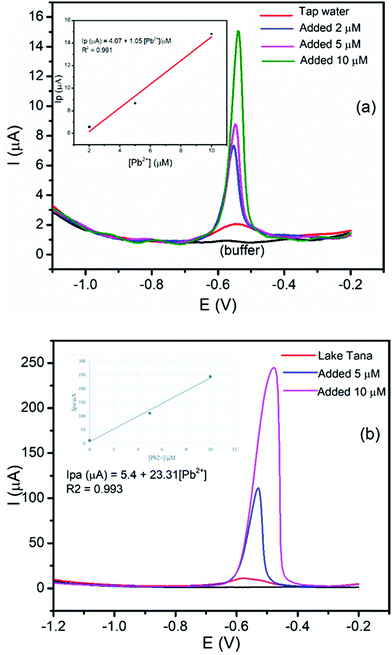
The application and validity of the BFO/CPE for the determination of Pb(II) and Cd(II) were tested by applying it to determine the Pb(II) and Cd(II) contents in the tap water sample collected from the Electroanalytical Chemistry Laboratory, Bahir Dar University, and lake Tana water samples, Bahir Dar, Ethiopia. Tap and lake Tana water samples were prepared following the procedure in the Experimental section. Since the concentration of Pb(II) in these samples is very low, the samples were spiked with 5 or 10 μM Pb(II) for the applicability evaluation. Here, Pb(II) was selected, and the standard addition method was used in tap and lake Tana water samples for the determination of the Pb(II) content by spiking with a known amount of Pb(II). The DPSV responses of the tap and lake Tana water samples by spiking with a known amount of Pb(II) and the corresponding calibration plot of peak currents against the Pb(II) concentration are illustrated in Fig. 11.Moreover, in order to validate the applicability of the developed method for the determination of the amount of Pb(II), recovery studies were carried out by spiking a known amount of Pb(II) to the tap and lake Tana water samples. It can be seen that the percent recoveries obtained were found to be in the range of 90.4–102.4% for Pb(II) (Table 2). The obtained results confirmed the applicability of the developed method for the determination of Pb(II) and Cd(II) in tap and lake Tana water samples.
 , are all shown in Table 3. The results in Table 3 showed that the peak currents of Pb(II) in the presence of interfering ions Fe2+ and Co2+ suffered a little decrease by 2.34 and 9.36%, respectively. This may be attributed as a result of the competition between the analytes Pb(II), and these interfering metal ions on the active sites present on the surface of the modified electrode.53
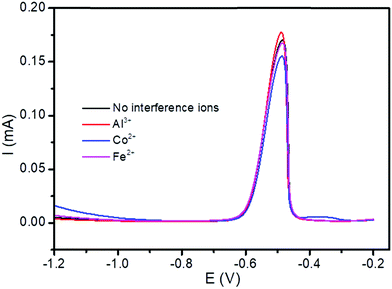 | ||
| Fig. 12 DPSV curves of the BFO/CPE in pH 4.5 ABS containing lake Tana sample solutions spiked with 5 μM Pb(II) in the presence of 5-fold excess potentially interfering ions, Al3+, Fe 2+ and Co2+. | ||
| Interference ions | Peak current of Pb(II) (mA) | Relative signal change (%) |
|---|---|---|
| No interference ions | 0.171 | |
| Al3+ | 0.176 | 2.92 |
| Co2+ | 0.155 | −9.36 |
| Fe2+ | 0.167 | −2.34 |
3.9. Stability studies
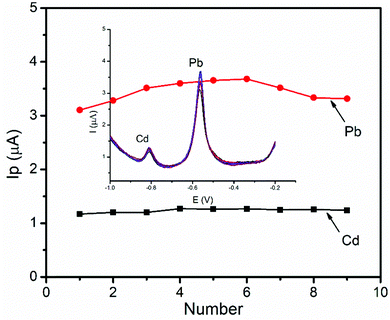
The stability of the BFO/CPE was investigated by using DPSV measurements of a 1 μM of mixture of Pb(II) ions for nine successive measurements under optimized conditions. The relative standard deviation (RSD) was found to be 7.23% and 4.45% for Pb(II) and Cd(II), respectively, indicating that the BFO/CPE exhibits excellent stability and hence the reproducibility of the results in the repeated DPSV detection of heavy metal ions under the optimized experimental conditions (Fig. 13).4. Conclusions
The BFO/CPE was successfully prepared and used as a sensor based on the BFO/CPE in ABS for the electrochemical determination of Pb(II) and Cd(II) in the tap water samples. The synthesized BFO films and hence the modified electrode were characterized using XRD, FT-IR spectroscopy, and cyclic voltammetric techniques. The DPSV method based on the BFO/CPE was used for the determination of Pb(II) and Cd(II) in the tap water samples. The applicability of the developed DPSV method using the BFO/CPE for the electrochemical determination of the two metals in tap water samples was validated using its recovery results in the range of 100.2–102%. In addition, the BFO/CPE modified electrode was confirmed to have low detection limit, high stability and wide linear range. This result reveals that the BFO/CPE can be used for the determination of Pb(II) and Cd(II) and has good potential for the analysis of Pb(II) and Cd(II) in real samples including tap water samples.Conflicts of interest
The authors declare that no conflicts of interest could have appeared to influence the reported work in this paper.Acknowledgements
The authors are grateful to Adama Science and Technology University for providing the XRD facility.References
- T. C. Hoang, M. C. Black, S. L. Knuteson and A. P. Roberts, Environ. Manage., 2019, 63, 433–436 CrossRef PubMed.
- N. M. Thanh, N. D. Luyen, T. Thanh Tam Toan, N. Hai Phong and N. Van Hop, J. Anal. Methods Chem., 2019, 1–11 Search PubMed.
- G. S. Ustabasi and M. Ozcan, J. Electrochem. Soc., 2021, 168, 097508 CrossRef CAS.
- J. P. Vareda, A. J. M. Valente and L. Durães, J. Environ. Manage., 2019, 246, 101–118 CrossRef CAS.
- F. R. Sulaiman and H. A. Hamzah, Ecol. Processes, 2018, 7, 1–11 Search PubMed.
- M. Amare, A. Worku, A. Kassa and W. Hilluf, Heliyon, 2020, 6, e04401 CrossRef PubMed.
- N. Singh, A. Kumar, V. K. Gupta and B. Sharma, Chem. Res. Toxicol., 2018, 31, 1009–1021 Search PubMed.
- T. Oymak, Ş. Tokalıoğlu, V. Yılmaz, Ş. Kartal and D. Aydın, Food Chem., 2009, 113, 1314–1317 CrossRef CAS.
- S. Bakırdere, T. Yaroğlu, N. Tırık, M. Demiröz, A. K. Fidan, O. Maruldalı and A. Karaca, J. Spectrosc., 2013, 1–7 Search PubMed.
- V. A. Lemos and A. L. de Carvalho, Environ. Monit. Assess., 2009, 171, 255–265 CrossRef PubMed.
- M. Waalkes, Mutat. Res., Fundam. Mol. Mech. Mutagen., 2003, 533, 107–120 CrossRef CAS PubMed.
- S. Chatterjee, S. Sarkar and S. Bhattacharya, Chem. Res. Toxicol., 2014, 27, 1887–1900 Search PubMed.
- K. Aoshima, Soil Sci. Plant Nutr., 2016, 62, 319–326 Search PubMed.
- S. Erarpat, G. Özzeybek, D. S. Chormey and S. Bakırdere, Chemosphere, 2017, 189, 180–185 CrossRef CAS PubMed.
- I. C. Ferreira Damin, A. V. Zmozinski, A. R. Borges, M. G. Rodrigues Vale and M. Messias da Silva, Anal. Methods, 2011, 3, 1379 RSC.
- M. D. Ioannidou, G. A. Zachariadis, A. N. Anthemidis and J. A. Stratis, Talanta, 2005, 65, 92 CAS.
- H. Wang, F. Liu, C. Wu, G. Wang, Y. Xu, W. Zhang and J. Zhou, Anal. Methods, 2014, 6, 1936–1940 RSC.
- B. Feist and B. Mikula, Food Chem., 2014, 147, 302–306 CrossRef CAS PubMed.
- A. M. Massadeh, A. A. Alomary, S. Mir, F. A. Momani, H. I. Haddad and Y. A. Hadad, Environ. Sci. Pollut. Res., 2016, 23, 13424–13431 CrossRef CAS PubMed.
- M. B. Gumpu, S. Sethuraman, U. M. Krishnan and J. B. B. Rayappan, Sens. Actuators, B, 2015, 213, 515–533 CrossRef CAS.
- B. Maleki, M. Baghayeri, M. Ghanei-Motlagh, F. Mohammadi Zonoz, A. Amiri, F. Hajizadeh, A. Hosseinifar and E. Esmaeilnezhad, Measurement, 2019, 140, 81–88 CrossRef.
- Y. Lu, X. Liang, C. Niyungeko, J. Zhou, J. Xu and G. Tian, Talanta, 2018, 178, 324–338 CrossRef CAS PubMed.
- T. Priya, N. Dhanalakshmi, S. Thennarasu, V. Karthikeyan and N. Thinakaran, Chem. Phys. Lett., 2019, 731, 136621 CrossRef CAS.
- S. Chaiyo, E. Mehmeti, K. Žagar, W. Siangproh, O. Chailapakul and K. Kalcher, Anal. Chim. Acta, 2016, 918, 26–34 CrossRef CAS PubMed.
- N. M. Thanh, N. Van Hop, N. D. Luyen, N. H. Phong and T. T. Tam Toan, Adv. Mater. Sci. Eng., 2019, 1–11 Search PubMed.
- S. Lee, S. Bong, J. Ha, M. Kwak, S.-K. Park and Y. Piao, Sens. Actuators, B, 2015, 215, 62–69 CrossRef CAS.
- Y. Pu, Y. Wu, Z. Yu, L. Lu and X. Wang, Talanta Open, 2021, 3, 100024 CrossRef.
- M. Akilarasan, E. Tamilalagan, S. M. Chen, S. Maheshwaran, T. W. Chen, A. M. Al-Mohaimeed, W. A. Al-Onazi and M. S. Elshikh, Microchim. Acta, 2021, 188, 72 CrossRef CAS PubMed.
- S. Maheshwaran, M. Akilarasan, T. W. Chen, S. M. Chen, E. Tamilalagan, T. Y. Jiang, E. A. Alabdullkarem and M. Soylak, Microchim. Acta, 2021, 188, 102 CrossRef CAS PubMed.
- M. Ghanei-Motlagh and M. A. Taher, Biosens. Bioelectron., 2018, 109, 279–285 CrossRef CAS PubMed.
- X. Li, H. Zhou, C. Fu, F. Wang, Y. Ding and Y. Kuang, Sens. Actuators, B, 2016, 236, 144–152 CrossRef CAS.
- G. Zhao, Y. Yin, H. Wang, G. Liu and Z. Wang, Electrochim. Acta, 2016, 220, 267–275 CrossRef CAS.
- S. Cerovac, V. Guzsvány, Z. Kónya, A. M. Ashrafi, I. Švancara, S. Rončević, Á. Kukovecz, B. Dalmacija and K. Vytřas, Talanta, 2015, 134, 640–649 CrossRef CAS.
- D. Yang, L. Wang, Z. Chen, M. Megharaj and R. Naidu, Microchim. Acta, 2014, 181, 1199–1206 CrossRef CAS.
- D. Li, J. Jia and J. Wang, Talanta, 2010, 83, 332–336 CrossRef CAS PubMed.
- L. Xiao, H. Xu, S. Zhou, T. Song, H. Wang, S. Li, W. Gan and Q. Yuan, Electrochim. Acta, 2014, 143, 143–151 CrossRef CAS.
- M. Akilarasan, S. Kogularasu, S. M. Chen, T. W. Chen and B. S. Lou, RSC Adv., 2018, 8, 39870–39878 RSC.
- S. Kogularasu, M. Akilarasan, S.-M. Chen, E. Elaiyappillai, P. M. Johnson, T.-W. Chen, F. M. A. Al-Hemaid, M. A. Ali and M. S. Elshikh, Electrochim. Acta, 2018, 290, 533 CrossRef CAS.
- Q. Zhang, D. Sando and V. Nagatrajan, J. Mater. Chem. C, 2016, 4(19), 4092–4124 RSC.
- H. Wu, P. Xue, Y. Lu and X. Zhu, J. Alloys Compd., 2018, 731, 471–477 CrossRef CAS.
- T. J. Park, Y. Mao and S. S. Wong, Chem. Commun., 2004, 2708–2709 RSC.
- H. Wang, D. Qian, X. Xiao, C. Deng, L. Liao, J. Deng and Y. W. Lin, Bioelectrochemistry, 2018, 121, 115–124 CrossRef CAS PubMed.
- X. H. Zhu, E. Defaÿ, Y. Lee, B. André, M. Aïd, J. L. Zhu, D. Q. Xiao and J. G. Zhu, Appl. Phys. Lett., 2010, 97, 232903 CrossRef.
- V. V. Jadhav, M. K. Zate, S. Liu, M. Naushad, R. S. Mane, K. N. Hui and S. H. Han, Appl. Nanoscience, 2016, 6, 511–519 CrossRef CAS.
- Y. Hu, L. Fei, Y. Zhang, J. Yuan, Y. Wang and H. Gu, J. Nanomater., 2011, 1–6 Search PubMed.
- J. Li, S. Guo, Y. Zhai and E. Wang, Anal. Chim. Acta, 2009, 649, 196–201 CrossRef CAS PubMed.
- X. H. Zhu, E. Defaÿ, Y. Lee, B. André, M. Aïd, J. L. Zhu, D. Q. Xiao and J. G. Zhu, Appl. Phys. Lett., 2010, 97, 232903 CrossRef.
- N. Blaise, H. G. Valéry, R. Maallah, M. Oubaouz, B. T. D. Justin, E. A. Ofudje and A. Chtaini, J. Anal. Methods Chem., 2022, 1–9 Search PubMed.
- S. F. Zhou, J. J. Wang, L. Gan, X. J. Han, H. L. Fan, L. Y. Mei, J. Huang and Y. Q. Liu, J. Alloys Compd., 2017, 721, 492–500 CrossRef CAS.
- S. A. Kitte, S. Li, A. Nsabimana, W. Gao, J. Lai, Z. Liu and G. Xu, Talanta, 2019, 191, 485–490 CrossRef CAS PubMed.
- H. D. Vu, L. H. Nguyen, T. D. Nguyen, H. B. Nguyen, T. L. Nguyen and D. L. Tran, Ionics, 2015, 21(2), 571–578 CrossRef CAS.
- G. H. Hwang, W. K. Han, J. S. Park and S. G. Kang, Sens. Actuators, B, 2008, 135(1), 309–316 CrossRef CAS.
- L. Zhu, L. Xu, B. Huang, N. Jia, L. Tan and S. Yao, Electrochim. Acta, 2014, 115, 471–477 CrossRef CAS.
| This journal is © The Royal Society of Chemistry 2022 |

