 Open Access Article
Challenges surrounding nanosheets and their application to solar-driven photocatalytic water treatment
Diego T.
Pérez-Álvarez†
*a,
Jacob
Brown
 a,
Elzahraa A.
Elgohary
 b,
Yasser M. A.
Mohamed
b,
Hossam A.
El Nazer
b,
Philip
Davies
a and
Jason
Stafford
b,
Yasser M. A.
Mohamed
b,
Hossam A.
El Nazer
b,
Philip
Davies
a and
Jason
Stafford
 *a
*a
aSchool of Engineering, University of Birmingham, UK. E-mail: d.t.perez-alvarez@bham.ac.uk
bPhotochemistry Department, National Research Center, Dokki, Giza 12622, Egypt. E-mail: j.stafford@bham.ac.uk
First published on 26th April 2022
Abstract
Industrialisation has deepened the water crisis in arid climates, where wastewater runoff from heavy industry has polluted groundwater sources so heavily that traditional methods of water treatment have proven ineffective. Photocatalysis is an emerging technology which has the potential to treat water using only sunlight, but is unrealised using traditional, inefficient photocatalysts (e.g. TiO2). Recently, a slew of visible light active 2D nanomaterials such as MoS2 and g-C3N4, have shown great promise, with others playing an essential supporting role in larger composites (e.g. graphene). Scalable synthesis of these nanosheets has remained elusive, as they require careful synthesis tailored towards their role within a photocatalytic composite. Along with recovering the nanosheets post-treatment, these remain the greatest challenges barring the adoption of these materials more generally. Through this review, we find that research into nanosheet-based photocatalysis should focus on developing materials from a systems level perspective, with careful consideration taken to how the material presented is to be applied in clean water technologies and synthesised from its base components.
1 Motivation
Increasing populations, weather extremes and rapid industrialisation (with poor regulation) has led to a scarcity of clean water sources in many developing countries, rendering them unsuitable even for irrigation.1 This is especially true in arid, drought-prone climates, where intermediate water sequestration systems like dams and rainwater catchment are less relevant. Egypt's freshwater consumption for example, is much greater than its freshwater production, and with the extra competition for water upstream of the Nile, the crisis here is only set to deepen in the short term.2,3 The WHO estimates that although the number of people who have access to water has increased since the millennium, most are drinking from polluted sources, with an estimated three out of every ten people lacking access to clean water.5 In this vein, it is paramount to develop cost-efficient methods of water treatment, especially for arid climates.Traditional methods of water treatment often struggle with the diversity of contaminants in such highly polluted waters. Chlorination for example has always been problematic, as it ends up creating even more toxic by-products;4 other chemical treatments have historically been avoided due to mass-scale unforeseen medical consequences.6 Traditionally, coagulation or adsorption are used, but by their nature simply concentrate the contaminants which remain after processing.7 Membrane filtration systems have consistently suffered from complicated issues stemming from the fouling of the membranes and inefficient removal of pollutants,8 leading to increased costs incurred by using progressively smaller meshes from ultra-filtration to reverse-osmosis.
In the context of a small community, SOlar water DISinfection (SODIS) has been touted by the WHO for its passive ability to clean water; where post filtering, it takes 6 hours under less than 50% cloud cover to produce clean drinking water. This process requires low turbidity water, and kills pathogens owing to a combination of Ultra-Violet light (UV)-induced DNA damage, thermal inactivation, and photo-oxidative destruction.9 Some heavier pollutants such as dyes and metals require excessively long exposure for inactivation, and much more intense treatment for timely remediation.
Photocatalysis is one of a subset of Advanced Oxidation Processes (AOPs)10 which are able to hasten the natural degradation of these heavier pollutants by using light to catalyse the reactions directly,11,12 along with its own antimicrobial effect.13 This degradation pathway has been examined using gas chromatography techniques, revealing phenols as the main degradation intermediary (for Methylene Blue), which subsequently break down into CO2 and H2O.14,15 Photocatalysts (PCs) have been successfully applied to many fields beyond water treatment, from water splitting,16–18 the production of ammonia through N2 fixation,19–21 to the reduction of CO2 into synthetic fuels.22–26
Conventional renewables can also be used to power high energy light sources for photocatalysis, which can be tailored to suit the activation range of a particular photocatalyst, whilst simultaneously degrading pollutants by direct UV excitation and allowing treatment to continue at night.27 The primary byproducts of photocatalytic water treatment are CO2 and H2O.28 Notably, hydrogen, a sustainable fuel source, is another byproduct that can be produced in reasonable quantities if the catalyst is optimised.29,30 This is beneficial as hydrogen from pollutant degradation is more thermodynamically favourable than from photocatalytic water splitting,29 making use of would be waste products.
Photocatalytic systems offer benefits on many levels, as an inherently clean, low-cost and environmentally friendly solution to many of these problems.31 The cutting edge of photocatalytic research focuses on novel, Visible Light Active (VLA) PCs, which rely heavily on nanomaterial composites, especially those based on 2D nanosheets. Since their application to photocatalysis, it has been difficult to intensify the procedure, as a number of life cycle considerations remain unaddressed:32
• Production – particularly towards 2D PCs. They are difficult and expensive to produce which currently make them impractical at scale.
• Application – it is not clear what is best practice in applying PCs at scale, especially 2D PCs.
• Recovery and reuse – by virtue of their size, nanomaterials represent an intrinsic difficulty to separate photocatalyst from solute post treatment.
From rooftop to industrial scale setups, solar-driven photocatalysis has the potential to fundamentally change the way water treatment is realised. Fig. 1 provides a visualisation of areas that would benefit the most from widespread adoption of such a technique. Many Middle-Eastern to northeast African countries are currently experiencing an extremely high strain on their freshwater resources, with Egypt in excess of 1000%. They also experience a high amount of solar radiation, making them a prime candidate for solar photocatalysis.
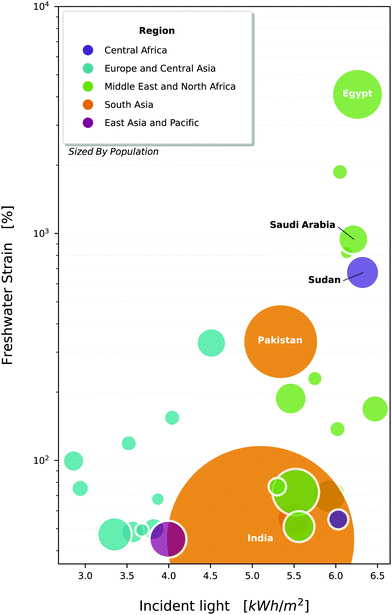 | ||
| Fig. 1 Countries of the world, plotted against their strain on freshwater resources1 and average daily incident light.33 Bubbles are sized by population, and coloured by economic area denoted by the world bank. Selected countries are all experiencing withdrawals above 40% (high water stress), and have a population >5 million, though data is not available for all countries. Note that withdrawals exceed 100% in a number of countries, which indicates that the local freshwater is being sourced unsustainably (e.g. from aquifers) or heavy use of desalination. | ||
Clean drinking water is a global problem, which will only come to affect more people. New technologies are essential to keep pace with human and climate developments. The discovery of efficient and generalised methods of preparing, applying and reusing PCs would open the door to this new industry, providing cheap and accessible freshwater to many of the regions which need it the most.
2 Introduction
Since the discovery of the photocatalytic properties of TiO2 in 1972,35 photocatalytic materials have garnered attention due to their thermal stability, biocompatability and sustainability.31 In the wake of TiO2 other metallic powders such as WO3, ZnO and Bi2O3 have all demonstrated the photocatalytic effect to varying degrees.36–39 TiO2 has gone on to moderate success as the only commercially available PC (P25-degussa), though it has not broken into the the water treatment sector due to its low efficiency and difficult recovery.The general photocatalytic process for semi-conducting materials can be described as follows. An incident photon with energy greater than or equal to the PC band gap can excite electrons from the valence band to the conduction band creating an electron-hole pair.40,41 This electron-hole pair can interact with adsorbed compounds to directly degrade pollutants, or to generate redox species capable of degrading organic pollutants into CO2, water, and mineral acids.42–44 It is generally agreed that the oxidative ˙OH degradation pathway is dominant.44 A schematic representation of this process is given in Fig. 2 for a 2D nanosheet, and more detail on the reaction mechanisms in Section 4. The inability to use visible light in legacy bulk PCs stems from the large band gap required for excitation, but even when excited they are invariably inefficient, owing for the tendency of electron-holes to recombine at any point as they migrate to activation sites on the surface of the photocatalyst.45
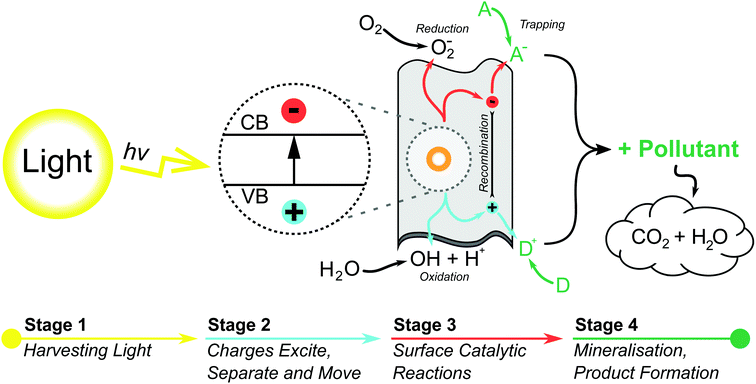 | ||
| Fig. 2 A schematic diagram for a heterogenous photocatalytic process over a 2D photocatalyst surface, detailing some of the many reactions that can occur to pollutants through the use of photogenerated charge carriers. (A and D) Represent the surface adsorbed acceptor and donor species respectively.34 | ||
Novel developments in nanomaterials with tunable geometries have, however, opened new avenues of experimentation. What is striking about these materials is the diversity of structures they can take, from 0D nanospheres46,47 to 1D nanorods/nanotubes48–51 and 2D nanosheets.52–55 Regardless of morphology, nano-scale PCs outperform their bulk counterparts in all cases.56 Of these structures, many behave completely differently in terms of photocatalysis, and 2D nanosheets in particular offer some unique advantages arising from their structure.
(1) They have a large surface area per amount of material, maximising the space available for photocatalytic reactions.
(2) Their ultra-thin nature reduces the migration distance for electrons and holes to reach active sites, increasing the efficiency of photocatalytic reactions and reducing the possibility of electron-hole recombination.
Nowadays, there is a large body of research discussing the nanostructure of PCs, and it is clear that these materials offer a much better solution than their bulk counterparts. To give an example, TiO2 nanosheets show an increase in activity when compared to their bulk phase counterparts, accompanied by a change in their band gap.12 Li et al.57 provides a comprehensive review into the design of these 2D based PCs, including many of the different construction strategies for tuning a PC's activity under different wavelengths of light. In the stride to boost catalytic performance, many researchers have taken to doping graphene and 2D materials using a variety of material sources.58 Even so, the literature tends to point towards a 2D atomic structure being the main component in the design of future PCs.
In essence, the lack of more widespread use of nanoscale PCs is due to the high synthesis and characterisation cost these materials entail. Take graphene as an example, at the time of writing 100 g of current commercial few-layer graphene costs within the region of € 200. This, coupled with the fact that only 20% of commercial sources consist of true mono to few layered graphene59 hints at the great difficulty that the synthesis of 2D materials entails. Production intensification and international standards for graphene60 offer a pathway to a wide range of commercial composites with reliable and remarkably enhanced photocatalytic activity, such is its prevalence within photocatalysis.61 Importantly, 2D semi-conductors that support solar-driven photocatalysis (e.g. MoS2 nanosheets) currently have less commercial focus than graphene-based materials. This impacts on the availability and cost of high quality 2D materials for use in large-scale water treatment.
Table 1, provides a summary of a number of different cost estimations for photocatalytic reactors, which demonstrates how much more expensive they are when compared to current methodologies costing near € 0.39 m−3 on average,65 (dependant on the original contamination of the groundwater source). These sources nearly all use the commercial P25-degussa,66 which is non-optimal. The use of more efficient nano-composite PCs would dramatically improve efficiency across the board. Lowering the cost of these materials requires high-throughput methods of synthesis, but this cannot come at the expense of quality, as nanosheet quality is intrinsically linked to its performance. Because of this, both aspects are looked at in parallel in Section 5.
| Catalyst | Notes | Cost | Ref. |
|---|---|---|---|
| TiO2 – P25 slurry reactor | Measured the destruction of pesticides EPTC, butiphos and γ-lindane beginning at concentrations of 500 μg L−1 and ending at their maximum permissible level (0.1 μg L−1), and the four-log inactivation of E. faecalis bacteria. Tested using a 500 m2 CPC array with a calculated capacity of 42 L h−1 m−2. | 1.1 | 62 |
| TiO2 – P25 slurry reactor | Measured the complete removal of ECs (emerging contaminants, includes a wide variety of compounds such as pharmaceuticals, personal care products, hormones, industrial additives and household chemicals, with most ECs not yet regulated.) and 20% reduction in TOC (total organic carbon) levels. Tested with a 0.25 m2 CPC array at a maximum of 24 L min−1, in semi-batch operation. | TOC: 2.14 EC: 2.87 | 63 |
| TiO2 coated rotating drum reactor | Illuminated by a combination of artificial UV lights and solar radiation. Specific enhancing conditions such as the acidic pH 4 and presence of H2O2 at 250 mg L−1 noted. Measured the removal of 10 mg L−1 aniline solution in deionised water (100% after 10 minutes), and the removal of TOC (85% after 120 minutes). | 0.72 | 64 |
Material synthesis is only part of the problem; in reality, the full life cycle of the photocatalyst must be examined, and as suggested before, the issues surrounding the application of these materials are as prevalent. Hence, there has been a push to evaluate the effectiveness of PCs at large scale, beginning with two small pilot plants in Morrocco and Spain.67 These examined a range of different techniques, but centered on employing Compound-Parabolic-Concentrators (CPCs) to maximise the incident light intensity.68 Since the turn of the millennium, pilot plants such as these have begun to appear with greater frequency and complexity (complete with 1–2 axes solar tracking), mainly due to funding by the EU through projects such as SOLWATER and AQUACAT.69
These pilot facilities have invariably used bulk PCs, as opposed to atomic scale materials, and therein circumvent one of the large issues surrounding nano-scale PCs; PC removal/recovery.71 Separation of a nano-scale photocatalyst implies the post-process is as laborious as some of the aforementioned nano-filtration techniques, if standard methods are used. This suggests that the ideal photocatalytic material must have some thought for its reuse. This could either be intrinsic to the photocatalyst material itself, or through some external implementation. This opens up other methods of application, such as photoelectrocatalysis,72 where the photocatalyst is held within an anode, in contact with the water but not allowed to mix directly. This makes practical sense at a cost to efficiency,73 implying that the ideal implementation is one that looks at photocatalysis as an entire process when designing a PC, thereby ensuring that the material developed covers both efficient and practical application.74,75 A holistic consideration of these trade offs is an essential part of selecting a suitable photocatalytic system.
3 2D photocatalysts
2D materials are traditionally best known for their enhanced mechanical, optical and electrical properties.76,77 They have been rising steadily in popularity along with other low-dimensional materials due to their enhanced photocatalytic properties, which have been under investigation even before the discovery of graphene in 2004.78,79 The benefits of nanostructure PCs stem primarily from the enhanced surface area available per amount of material. Though 0D & 1D PCs maximise these properties,80 2D materials are able to effectively utilise incident sunlight because of their light-scattering properties (Fig. 3), with the absorption and band gap being dependant on the depth of light penetrated.12,81 This also means that the number of atomic layers (or equivalently, the thickness) of these 2D materials is critical to the effective absorption of 2D PCs,82 as shown in Fig. 4.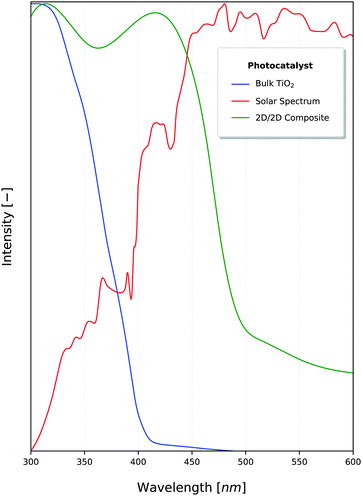 | ||
| Fig. 3 Intensity of sunlight (red) in juxtaposition to the photocatalytic activation (normalised) of TiO267 and a 2D nanocomposite constructed using graphitic carbon nitride (g-C3N4).16 A total of 46% of the solar energy falls within the visible light range.70 | ||
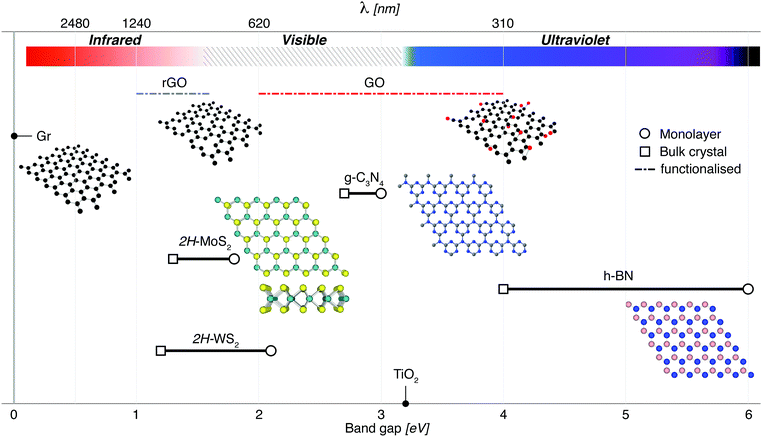 | ||
| Fig. 4 2D materials which have been a focus for photocatalysis research include g-C3N4, transition metal dichalcogenides such as MoS2, insulators such as h-BN for composites, and other graphene-related materials (Gr, rGO and GO). Apart from graphene, which has a zero band gap, these materials can be exfoliated from their bulk materials to engineer nanosheets with a direct band gap. In the case of rGO and GO, modifications to the band gap are made possible by removing/adding functional groups. TiO2 has been included for reference, illustrating the advantages of narrow band gap nanosheets that can target visible wavelengths for solar-driven photocatalysis. For g-C3N4, a triazine structure is shown inset. This material also has an heptazine structure which is shown in Fig. 8. | ||
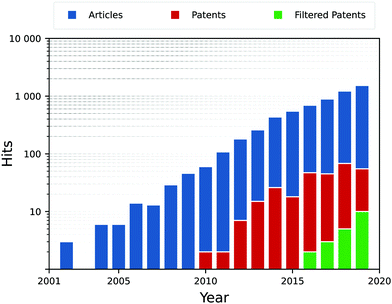
The rise in publications shown in Fig. 5, describes the current prominence of nanosheets within research. Interestingly, most hits for unfiltered patents are false positives, and most simply are patenting a specific material and its method of production. This is slightly disingenuous, as generalised methodologies for the application of photocatalytic substances is prominent throughout patent searches, simply that few target the nano-scale PCs in particular. This principally demonstrates the lag between research and industrial uptake, but also tells of how important the synthesis route is to these PCs, as it effectively determines how the catalyst is to be used and reused.
The range of materials discovered so far only scratches the surface of a variety of naturally occurring materials held together by van der Waals forces,83–85 and with novel developments in computational pre-screening of materials in terms of photocatalytic activity,86,87 highly-active PCs can be found at an astonishing rate. The most active of which typically work in conjunction with other PCs in the form of composites.88,89 In fact, the search in Fig. 5 found that one-third of all hits on articles/papers were directly examining functional composites of several different materials to improve photocatalytic activity.
Composites themselves vary dramatically in terms of structure and functionality. On an individual level, the dimensionality of a photocatalyst is clearly important (as discussed in Section 2), but compositing adds a level of inter-dependency between dissimilar materials which brings dimensionality to the fore.90 At this point, interfacing between dissimilar materials can critically impact photocatalytic activity, for instance by altering the transfer rate of charge carriers between co-catalysts. 2D materials are again naturally suited to this, as they exhibit a large specific surface area, which gives reason for the rise in 2D/2D (one 2D material layered over another different 2D material) heterostructures.25,91,92
As an example, most PCs can be doped with graphene61 to enhance the separation of charge carriers from the parent photocatalyst, and in this regard graphene outperforms carbon nanotubes.93 The same study reported the highest activity using 2D/2D titania-graphene nanosheet structures. This demonstrates a type II Heterostructure, which due to their differing band gaps promote the movement of charge carriers between the titania and graphene. These types of heterostructures in particular have been rising in prominence because of this charge separating interaction.94,95
Though metal oxides have been extensively researched as one of the first consistently active photocatalytic materials, other categories have been found which demonstrate good photocatalytic activity. Transitional Metal Dichalcogenides (TMDs) being the most notable,12,53,96 as they exhibit similar or even better absorption of light, with MoS2 nanosheets having suitable band-gap structure (1.35–1.8 eV97) for the absorption of visible light.98 Even graphene, a zero band-gap material that is inactive by itself, can be functionalised by nitrogen doping (and other dopants) to work as a visible light photocatalyst.99,100 Functionalised graphene (GO, r-GO) makes up a small portion of a large number of non-metal based PCs. The most prominent non-metal is g-C3N4,101,102 belonging to a larger group of Covalent Organic Frameworks (COFs).
This is by no means an exhaustive list, and other nanosheet materials and their composites used in wastewater treatment are presented in Table 2. Furthermore, linking computational pre-screening techniques for photocatalytic activity86,87,103 with large explorational studies of layered materials held together by van der Waals forces83,85 provides the possibility to find new, exciting materials which have not been synthesized as of yet.104
| Photocatalyst | Water contaminant | Radiation source | Photocatalytic reaction results | Ref. |
|---|---|---|---|---|
a Red sea water sample containing: 386 ppm Ca, 14![[thin space (1/6-em)]](https://www.rsc.org/images/entities/char_2009.gif) 310 ppm Na, 742 ppm Mg, 210 ppm K, 22 310 ppm Na, 742 ppm Mg, 210 ppm K, 22![[thin space (1/6-em)]](https://www.rsc.org/images/entities/char_2009.gif) 219 ppm Cl, 146 ppm HCO3, 3115 ppm SO4, 15 ppm NO3, HPC >6500 CFU per mL, 42 219 ppm Cl, 146 ppm HCO3, 3115 ppm SO4, 15 ppm NO3, HPC >6500 CFU per mL, 42![[thin space (1/6-em)]](https://www.rsc.org/images/entities/char_2009.gif) 840 ppm TDS, 1320 ppm Total hardness at pH = 8.2.
b Direct sunlight irradiation is known to fluctuate with time, in some cases these sources do not specify time, date, or position.
c Unspecified light source – spectra unknown.
d Organic dyes are known to have a sensitisation effect, potentially modifying the light adsorption spectra of a photocatalyst and affecting the apparent degradation.137–139
e [sic] Methyl Orange. 840 ppm TDS, 1320 ppm Total hardness at pH = 8.2.
b Direct sunlight irradiation is known to fluctuate with time, in some cases these sources do not specify time, date, or position.
c Unspecified light source – spectra unknown.
d Organic dyes are known to have a sensitisation effect, potentially modifying the light adsorption spectra of a photocatalyst and affecting the apparent degradation.137–139
e [sic] Methyl Orange.
|
||||
| Hydrothermal method (HT) | ||||
| TiO2-GO | Methylene Blue (MB)d | Visible light, solar simulator (100 mW cm−2) | MB concentration fraction after 80 min: 0.20 for TiO2 NW-GO | 112 |
| 0.56 for TiO2 NP-GO | ||||
| rGO/Pd/TiO2 | Rhodamine B (RhB)d | UV light, 400 W mercury lamp | RhB degradation % after 40 min with 0.03 g catalyst and 10 ppm dye initial concentration: 79% for rGO/Pd/TiO2-NPs | 113 |
| 90% for rGO/Pd/TiO2-NWs, after 5 cycles photocatalyst was stable with slight decrease in degradation %. | ||||
| WO3/rGO | Methylene Blue (MB)d | Visible light, 300 W xenon lamp | 83% dye degradation % within 70 min, 20 mg catalyst and 10 mg L−1 dye. | 114 |
| Boron-doped TiO2/GO | Bisphenol A (BPA) | Visible light, 300 W xenon lamp | 47.66% BPA degradation % after 4 h with GO amount equal to 2% of titania mass. | 115 |
| ZnO–TiO2/rGO | Methylene Blue (MB)d | UV light, TUV 11W | 99.83% MB degradation after 120 min at pH 9 with 40 mg catalyst and 20 mg L−1 MB. | 116 |
| WO3/rGO | Rhodamine B (RhB)d ciprofloxaxin (CIP) antibiotic | Visible light, 300 W metal halide lamp | 96% RhB and 90% CIP degradation for WO3/rGO-40 photocatalyst after 120 min with 20 μM pollutant, 20 mg L−1 catalyst. | 117 |
| g-C3N4 | Rhodamine B (RhB)d tetracycline (TC) antibiotic | Visible light, 300 W xenon lamp | 100% RhB degradation rate after 15 min | 118 |
| 100% TC degradation rate after 60 min with 20 mg catalyst and 20 mg L−1 pollutant. | ||||
| Solvothermal method (ST) | ||||
| Ag/GO/TiO2 | Paraoxon pesticide | Visible light, 570 W xenon lamp | Nanocomposite with 6 wt% Ag and 1 wt% graphene content has the best photocatalytic activity and showed 100% TOC removal after 110 min with 31 mg L−1 pesticide and 0.2 g L−1 catalyst. | 119 |
| g-C3N4 fluorine doped/g-C3N4 (F-CNS) | Rhodamine B (RhB)d | Visible light, 500 W xenon lamp | Degradation rate of RhB by F-CNS was 1.6 times that of CNS after 2 h with 30 mg of catalyst, 10 mg L−1 dye. | 120 |
| MoS2/CdS | Methylene Orange (MO)de | Visible light, 350 W xenon lamp | 100% MO degradation rate by MoS2/CdS 1–220 (1![[thin space (1/6-em)]](https://www.rsc.org/images/entities/char_2009.gif) : :![[thin space (1/6-em)]](https://www.rsc.org/images/entities/char_2009.gif) 1 molar ratio prepared at 220 °C) within 60 min with 30 mg L−1 dye and 60 mg catalyst. 1 molar ratio prepared at 220 °C) within 60 min with 30 mg L−1 dye and 60 mg catalyst. |
121 |
| MnFe2O4/graphene sand composite (GSC) | Methylene Blue (MB)d | Sunlight irradiationb | 100% MB degradation rate after 180 min with 10 mg L−1 of MB and 0.25 g L−1 catalyst at pH 7.65 in presence of 5 mL of H2O2 | 122 |
| ZnO/GO | Neutral red (NR)d crystal violet (CV)d congo red (CR)d methyl orange (MO)d | UV-light, 40 W | Dye degradation % with 400 mg L−1 catalyst and 10 ppm dye was: 100% NR after 20 min, 97% CV after 80 min, 68% CR after 150 min, 66% MO after 150 min. | 123,124 |
| Self-assembly method | ||||
| GO/CdS | Escherichia coli (E. coli) Bacillus subtilis (B. subtilis) Acid Orange 7 (AO7) Rhodamine B (RhB)d photoreduction of Cr6+ | Visible light, solar light simulator (100 mW cm−2) | 100% of both E. coli and B. subtilis were inactivated within 25 min with 5 mg catalyst. 80% AO7 and 90% RhB were degraded within 60 min by 20 mg catalyst and 20 mg L−1 dye. 70% Cr6+ was photoreduced after 120 min and 15 mg catalyst. | 125 |
| γ-Fe2O3/GO | Methylene Blue (MB)d | UV irradiation, 250 W high pressure Hg lamp | 100% MB degradation after 80 min with 10 mg of catalyst and 50 mg L−1 dye. | 126 |
| SnO2/rGO | Methylene Blue (MB)d | Sunlight Irradiationb, Tiruchirappalli city, August | 100% MB disappearance by SnO2![[thin space (1/6-em)]](https://www.rsc.org/images/entities/char_2009.gif) : :![[thin space (1/6-em)]](https://www.rsc.org/images/entities/char_2009.gif) rGO (1 rGO (1![[thin space (1/6-em)]](https://www.rsc.org/images/entities/char_2009.gif) : :![[thin space (1/6-em)]](https://www.rsc.org/images/entities/char_2009.gif) 3 ratio) at less than 3 minutes with 20 mg of catalyst and 5ppm MB. Rapid disappearance is noted to be due to the effective adsorption properties of SnO2 3 ratio) at less than 3 minutes with 20 mg of catalyst and 5ppm MB. Rapid disappearance is noted to be due to the effective adsorption properties of SnO2![[thin space (1/6-em)]](https://www.rsc.org/images/entities/char_2009.gif) : :![[thin space (1/6-em)]](https://www.rsc.org/images/entities/char_2009.gif) rGO (1 rGO (1![[thin space (1/6-em)]](https://www.rsc.org/images/entities/char_2009.gif) : :![[thin space (1/6-em)]](https://www.rsc.org/images/entities/char_2009.gif) 3). 3). |
127 |
| Co-precipitation method | ||||
| Fe3O4/graphene/sulfur-doped g-C3N4 (Fe3O4/GE/SCN) | Ranitidine drug N-nitrosodimethylamine (NDMA) | Visible light, 300 W xenon lamp | 100% ranitidine removal and 57.3% reduction in NDMA formation potential by 20%-Fe3O4/GE/SCN composite after 60 min with 1 g L−1 catalyst and 2 mg L−1 pollutant initial concentration at pH 7.0 | 128 |
| Chemical vapor deposition (CVD) technique | ||||
| Graphene | Rhodamine B (RhB)d Janus Green (JG)d | Sunlight irradiationb | Graphene nanosheets (GNS) synthesized from black carbon collected from diesel engine. 98.65% RhB and 96.34% JG degraded by GNS after 120 minutes with 0.90 g L−1 catalyst and 10 mM dye at pH = 6. | 129 |
| Ag/ReS2 | Escherichia coli (E. coli) | Visible lightc | Complete inactivation of E. coli within 30 min by Ag(3)/ReS2 with 1.72 mg L−1 catalyst and 104 CFU per mL E. coli. After 5 consecutive cycles the photocatalytic disinfection performance for the photocatalyst is not reduced. | 130 |
| Graphene/anatase-TiO2 (G/a-TiO2) | Methyl Orange (MO)d | UV light, 250 W high-pressure mercury lamp | 88% MO degradation rate by bilayer G-60/a-TiO2 composite after 40 min with 10 mg catalyst and 12.5 mg L−1 dye | 131 |
| Sonication-photo-biosynthesis combined method | ||||
| Ag/Au/rGO | Red sea water samplea | Visible light, halogen lamp | An ultra-pure water is obtained with zero micro-organisms (HPC), salts, TDS, and Total hardness at pH = 7 after 5 h irradiation with 10 mg catalyst, 100 mL red seawater and 120 °C. Photocatalyst was stable for 3 cycles. | 132 |
| Water/oil microemulsion method | ||||
| Ag/AgBr/rGO-Si | p-Nitrophenol (PNP) | Visible light, 75 W halogen lamp | With 1 wt% catalyst and 1 mmol PNP: 95% photoreduction of PNP to p-aminophenol after 20 min. | 133 |
| 93% photoreduction of PNP to paracetamol after 8 min with 1 mmol acetic anhydride. | ||||
| 92% photoreduction reached after 3 cycles. | ||||
| Ultra-sonication exfoliation method | ||||
| Ag-FeCo2O4/RGO | Rhodamine B (RhB)d benzimidazole | Solar lightb | 86% RhB degradation rate after 120 min. | 134 |
| 54.46% benzimidazole degradation rate after 140 min. | ||||
| g-C3N4 | Rhodamine B (RhB)d | Direct sunlightb, solar radiation on that particular day was 843 ± 2 W m−2, and temperature was 26 °C. | 59% RhB degradation rate after 60 min with 5 mg catalyst and 5 mg L−1 | 111 |
| High shear mechanical exfoliation method | ||||
| MXene (Ti3C2) | Methylene Blue (MB)d | Visible light, 300 Wc | 98% MB degradation rate by MXene-blender (MX-B) nanosheets within 60 min, 2 ppm dye and 1 mg catalyst. | 135 |
| Electrochemical exfoliation method – followed by hydrothermal treatment | ||||
| TiO2 | Methylene Blue (MB)d | UV, 8 W, characteristic wavelength = 254 nm | 87% MB degradation rate after 20 min with 0.2 g L−1 catalyst and 5 ppm dye. | 136 |
| Thermal exfoliation (thermal etching) method | ||||
| g-C3N4 | Rhodamine B (RhB)d | Direct sunlightb, solar radiation on that particular day was 843 ± 2 W m−2, and temperature was 26 °C. | 86% RhB degradation rate after 60 min with 5 mg catalyst and 5 mg L−1 | 111 |
| 0.4% photocatalytic activity lost after 4 cycles | ||||
The morphology of these nanosheets is often as important as the type of photocatalyst itself. In bulk PCs, the crystalline structure affects photocatalytic performance, as demonstrated by the difference in activity between the different crystalline structures of TiO2.105,106 In 2D materials, oxidising graphene into Graphene Oxide (GO) or introducing defects along the edges or basal plane is known to affect the electron mobility of the sheets and indeed their photocatalytic activity.107–110 Inclusions are commonly introduced during synthesis, and exemplify the importance of maintaining reliable production techniques which are also scalable. The search for scalable synthesis is what first gave rise to GO and its variants, accentuating the great difficulty in creating pristine nanosheets.59 Thus the synthesis route plays a key role, impacting morphology, defect density, and ultimately, photocatalytic performance.111
4 Photocatalysis mechanisms
As discussed briefly in the introduction photocatalysis occurs when a semiconductor is irradiated by a photon with energy greater than or equal to its band gap in order to produce an electron-hole pair which can interact with adsorped molecules to create redox couples (Fig. 2) or directly degrade adsorped pollutants. There are a number of techniques used to enhance the creation of redox couples such as heterojunctions, doping, reducing the material morphology to the nanoscale (Fig. 4), and defect engineering.This article is not intended to serve as a comprehensive review of these mechanisms and there are several articles which cover these topics in greater detail. Li et al. produced a detailed review of charge recombination including heterojunctions, electron donors, and spin polarisation regulation.140 Although somewhat dated now, Wang et al. provided a thorough introduction to heterojunction photocatalysts.141 In a recent review from a different group of authors, Wang et al. included detail on different classifications of semiconductor materials, heterojunctions and photocatalysis applications.142 For information regarding active sites, although not specific to photocatalytic water treatment, Low et al.,143 Bo et al.,144 and Li et al.145 Finally, Serrá et al. have written a comprehensive review of photocatalytic treatment of natural waters including a summary of the reactions which take place to generate redox species, and the effects of environmental conditions such as solution pH.146 These reactions are summarised as follows:
| H2O + h+ → ˙OH + H+ | (R1) |
| O2 + e− → O2˙− | (R2) |
| H2O2 + e− → ˙OH + OH− | (R3) |
![[thin space (1/6-em)]](https://www.rsc.org/images/entities/char_2009.gif) 147(R4 and R5).
147(R4 and R5).| O2˙− + H+ → HO2˙ | (R4) |
| HO2˙ + HO2˙→H2O2 + O2 | (R5) |
Reactions which include the addition of e−(R2 and R3) occur at the conduction band of the semiconductor, and reactions involving h+(R1) occur at the valence band. The generated oxidising species (˙OH, O2˙−) can go on to degrade pollutants (R6).
| Pollutant + ˙OH/O2˙− → H2O + CO2 + H | (R6) |
Reaction (R2) requires the donation of a photoexcited electron from the semiconductor to the O2. This electron has a minimum energy of −0.33 V vs. NHE142,148,149 (normal hydrogen electrode). If the energy level of the photocatalyst conduction band is not sufficiently low (<−0.33 V) then the reaction will not take place. Similarly, reaction (R1) requires the H2O to donate an electron to the valence band of the semiconductor in order to fill the h+ formed during photoexcitation. If the valence band energy level is too negative (<2.32 V142,148,149) this reaction will not occur.150 This is illustrated in Fig. 6.
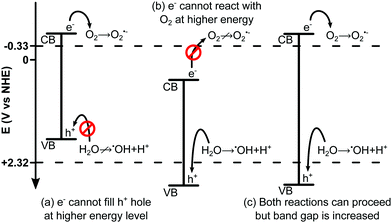 | ||
| Fig. 6 Schematic illustration of redox potential for ˙OH and O2˙− showing (a) a semiconductor with sufficiently negative CB to allow O2 + e−, but VB too negative to allow H2O + h+ as H2O cannot donate an electron to fill the more negative hole in the VB of the semiconductor. (b) A semiconductor with sufficiently positive VB such that H2O may donate an electron to fill the hole, however the CB is too positive meaning O2 cannot accept e−. (c) A semiconductor with both a sufficiently negative CB, and a sufficiently positive VB. This semiconductor would be capable of facilitating both reactions but has an increased band gap, limiting its solar spectrum adsorption range. Heterojunctions (Fig. 7) can be used to reduce this band gap whilst maintaining the redox potentials. Figure is for illustrative purposes only and is not drawn to scale. | ||
4.1 Heterojunctions
For efficient solar photocatalysis it is preferential to decrease the band gap energy such that a larger proportion of the solar spectrum can be used for the excitation of electrons and thus creation of redox couples. This reduced band gap comes at the cost of reduced oxidation and or reduction potentials.152The irony of photocatalysis is that generally speaking it is preferable to have a small band gap to enhance the range of useful light irradiation, but a large band gap to enhance the creation of redox couples. By using two semiconductor materials in a heterojunction photocatalyst the redox potential of a photocatalyst can be increased without increasing the band gap.152
Fig. 7 gives a brief overview of the heterojunction schemes that are applicable to photocatalysis. The S-scheme (direct Z-scheme) is the most appropriate heterojunction for photocatalysis.140 Type II heterojunctions do work but are inferior to the S-scheme due to the increased charge recombination and narrowed band gap leading to reduced redox potential, and minimised redox couple generation. In some instances,153 this can lead to the absence of ˙OH, leaving only the weaker oxidising ˙O2−. S-Scheme heterojunctions can be p–n, n–p, n–n, or p–p type151 where p (positive) and n (negative) refer to the charge on the two photocatalysts composing the heterojunction.
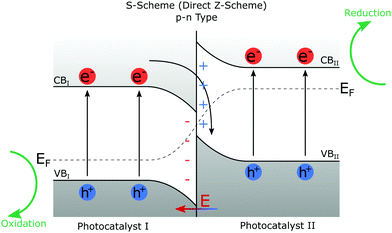 | ||
| Fig. 7 Schematic diagram of a p–n type S-scheme heterojunction. EF represents the Fermi level of the two photocatalysts and is seen to bend at the interface.151 VB and CB are valence and conduction bands. Both photocatalyst I and photocatalyst II undergo photoexcitation, creating electron-hole pairs. Electrons in CBI and holes in VBII combine leaving strong redox potential electron-hole pairs in CBII and VBI. The redox potential of the heterojunction photocatalyst is greater than either of the catalysts individually, and the band gaps have not been increased to achieve this. | ||
In the S-scheme, also known as the direct Z-scheme, heterojunctions of both photocatalyst I (PCI) and photocatalyst II (PCII) can undergo photoexcitation to create electron-hole pairs. The excited electrons from PCI combine with the holes of PCII leaving an electron-hole pair in which the electrons are in the conduction band of PCII (CBII) and the holes in the valence band of PCI (VBI) making it harder for them to recombine. This also allows the resulting CB and VB (and thus the redox potential) to be higher than that of Type II heterojunction in which CBI and VBII define the redox potential.140
4.2 Active sites
For 2D TMD nanomaterials, active sites occur mainly on the edge planes, leaving the basal planes mostly inert.154,155 It has also been reported that GO is edge plane active156 due to electron transfer mechanics at the edges, and that graphene (although not photocatalytically active on its own) has an electrochemically inert basal plane.157 Other photocatalysts such as g-C3N4 have active sites on both the basal and edge planes.145 Photocatalytic active sites require two things; (1) capability to accept charge carriers, (2) adsorption of the reactant molecule.143 (1) Some 2D photocatalysts, such as g-C3N4, are unable to freely transfer electrons resulting in charge trapping. In g-C3N4 the bridged N1 atom (Fig. 8) prevents the transfer of charges between structural units.145 This can result in charge recombination if there are no reactant molecules adsorbed on that structural unit. (2) For other 2D photocatalysts such as MoS2 molecules are unable to be adsorbed onto the basal plane but are readily adsorbed to appropriate edge structures.158The lack of active sites on the basal plane of most 2D photocatalysts can be addressed by a number of techniques. For example g-C3N4 has been shown to benefit from heteroatom doping creating defects in the basal plane where reactants can be adsorbed and which can also reduce charge trapping by the bridged N1 atom. Creating defects in g-C3N4 can also lead to nitrogen vacancies which can act as sites for charge recombination, decreasing the photocatalytic activity.145
5 Synthesis & morphology
Each technique used to synthesise nanosheets comes with its own trade-offs. For synthesis, high yields must be balanced with suitable nanosheet quality and morphology, as this has a significant effect on material performance. Large scale production should be developed with this in mind. The benefits of atomically thin PCs are well known,12 but what is less understood is how the introduction of defects to the structure of PCs can increase the photo-activity of nanosheets.159 Among these defects; pores, vacancies, pits and distortions can all act to impact the viability of the photocatalyst. Defects can be introduced directly through the initial synthesis route or by post-processing stages such as annealing.160–162 Crucially, both pristine nanosheets and defective nanosheets are required, and many papers fail to fully characterise their findings in this sense.163 This leaves a gap in research for examining the synthesis of nanosheets for photocatalysis in a practical sense. Synthesis of nanosheets can be divided into two areas:• Top-down, where nanosheets are extracted through the exfoliation of a natural or synthetic layered material.
• Bottom-up, where nanosheets are constructed from base molecules through chemical reactions.
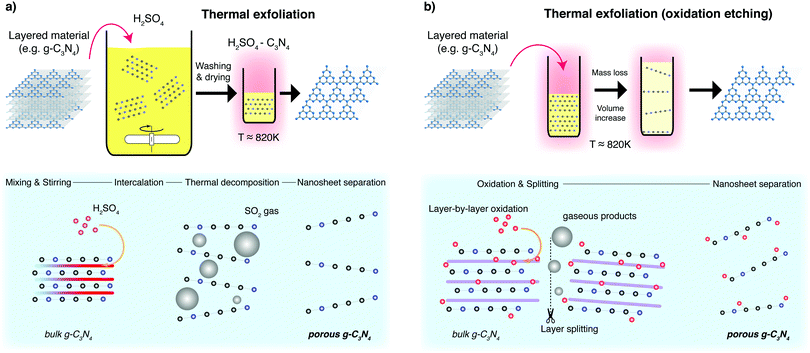
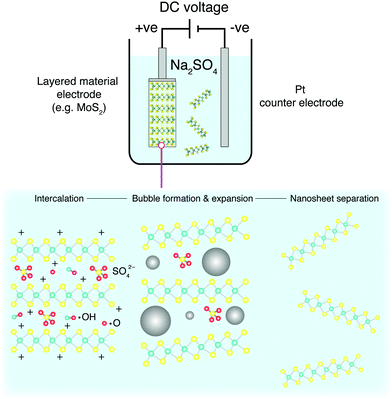
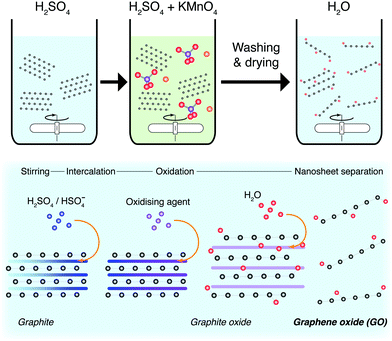
Most methods of synthesis discussed in this section are top-down processes, as they are inherently scalable164 and many are generally applicable to a wide variety of 2D materials (Table 2). Nanosheet synthesis through exfoliation of a precursor material is a primary top-down route, which can be achieved using a number of techniques illustrated in Fig. 9. Facile synthesis of pristine nanosheets would ultimately lower the cost of manufacture for composite-PCs and allow researchers and practitioners to streamline the production of their own advanced PCs. Take g-C3N4 as an example, with a straightforward synthesis route which can be realised through a number of different methods,165 has led to many papers discussing its excellent photocatalytic properties;166 however, most use inherently unscalable production processes.167 The use of appropriate techniques which can move synthesis of nanosheets away from the lab scale and into industry are essential in the long-term.
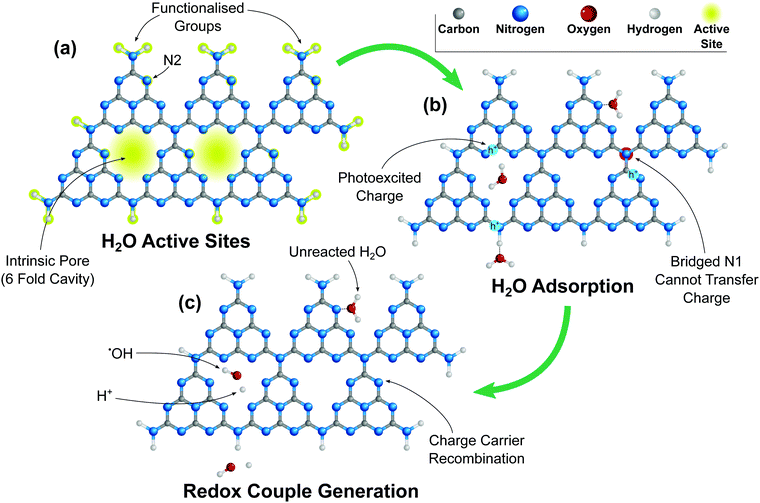 | ||
| Fig. 8 Schematic diagram of g-C3N4 (tri-s-triazine (heptazine)) showing (a) H2O adsorption sites, highlighted in yellow (b) H2O adsorption onto g-C3N4 active sites, and electron trapping due to the bridged N1 preventing electron transfer between structural elements.145 (c) Subsequent dissociation of H2O into ˙OH/O+ redox couple where sufficient charge carriers are available. | ||
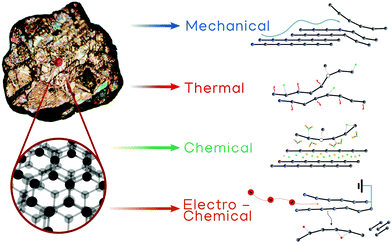 | ||
| Fig. 9 Schematic representation of the different exfoliation techniques discussed in this review: liquid-phase “mechanical”, thermal, chemical and electro-chemical exfoliation. | ||
Importantly, there are many characteristics to consider with varying levels of importance depending on the end-use. Production rate, defects introduced to the nanosheets, power consumption, yield and morphology can be sensitive to the synthesis method and accompanying post-processing operations (e.g. centrifugation settings).168 Therefore, a direct comparison of different synthesis routes is non-trivial. To accommodate this, each process subsection has been ranked against each other in Fig. 10 which separates the issue of production into five sub-topics, in the spirit of Raccichini's work,169 scored out of a maximum of 3.
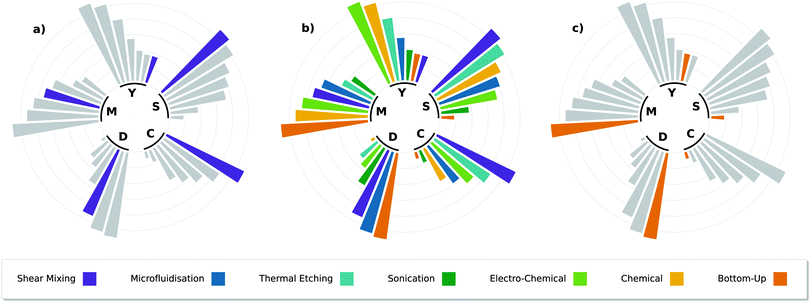 | ||
| Fig. 10 Circular barplot of all the synthesis techniques discussed in this section, ranked according to the process parameters of scalability (S), yield (Y), morphology (M), defects (D) and cost (C), subplot (b). Subplot (a) isolates shear mixing, a technique which suffers almost exclusively from its poor yield (typ. ∼ 1–10 wt%). Subplot (c) isolates bottom-up methods, in this case Chemical Vapour Deposition (CVD) has been used as an example. CVD can be used to grow different materials on substrates, and is currently the most widespread technique for fabricating pristine monolayered graphene on copper substrates.170 | ||
• Scalability (S), the quality of a process that can be scaled up, through larger process volumes and concentration.
• Yield (Y), the mass concentration of nanosheets with respect to the initial precursor concentration. Note that a process which is scalable can often be cost-effective even at a low yield through sheer volume.
• Morphology (M), encompasses the shape and thickness of the final product. Products with low number of atomic layers scores highly.
• Defects (D), takes into account the defects present in a material due to the method of production (e.g. basal plane vacancies). A low score indicates a defective nanosheet (which can be beneficial).
• Cost (C), a low cost efficient system (by starting capital and running costs) scores highly in this examination.
5.1 Mechanical exfoliation in liquids
Mechanical exfoliation is the process of taking a layered precursor material composed of 2D nanosheets held together by weak van der Waals forces, and breaking it down into its constituent nanosheets through the application of an external mechanical force. Many of the techniques described here involve liquid-phase dispersion routes to exfoliation, and are termed Liquid-Phase Exfoliation (LPE) methods. LPE has been seen as a facile and scalable route to synthesis since soon after the discovery of graphene.171 It typically requires additional post-processing steps to separate the synthesised nanosheets from the unexfoliated bulk material.LPE processes disperse layered materials in an appropriate solvent, with the precursor predominantly in the form of microscale particles or flakes. The choice of solvent in suspensions is key, as the dispersion of the nanosheets must match the dispersion of the solvent in order for the solution to be stable and avoid re-aggregation of the sheets.172 This can be achieved through traditional solvents (e.g. N-methyl-2-pyrrolidone, NMP), co-solvents, or the addition of surfactants in aqueous solutions that resist nanosheet restacking by steric or electrostatic repulsion.168 Furthermore, an adequate choice of solvent can act to enhance exfoliation.173 For example, the bio-compatible solvent cyrene has been shown to have the same dispersion characteristics as graphene, and methods using this combination are showing greatly improved exfoliation yields than previous attempts with other high-performance toxic solvents (e.g. NMP).174
Another aspect to these techniques is that they are generally applicable to all layered materials, and tend to produce defect-free nanosheets compared to other techniques, due to their being a mechanical route to exfoliation. Some defects can be introduced in the process; sonication produces localised regions of high shear rate through the rapid collapse of microbubbles during cavitation, which although exfoliating, can also begin to produce holes in the nanosheet lattice. Shear mixing also produces high localised shear rates, at a lower magnitude, exfoliating nanosheets without basal plane defects. Microfluidisation can achieve some of the largest shear rates (>106 s−1) to effectively overcome van der Waals forces but suffers from a high power consumption to instigate turbulent flows in microscale channels. Hence, there can be a number of trade-offs to consider when selecting synthesis strategies for photocatalytic materials that are producible on a large scale.
In this review, we focus on three techniques that are commonly used to produce nanosheets through liquid exfoliation. A variety of other non-oxidising techniques can be found documented elsewhere.168
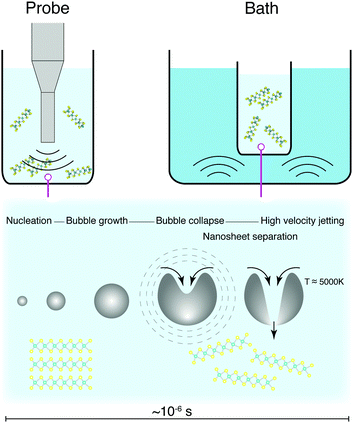
Sonication suffers from difficulties surrounding scalability, as the rate of production does not scale well with increasing volume.177 A peak in nanosheet production has been observed depending on concentration and volume used,178–180 which is a difficulty for large scale production of nanosheets. Large sonicating probes are available industrially, but are prohibitively expensive, and can require the implementation of batch-type processes. Sonication can also cause defects within the exfoliated nanosheets, such as holes within the basal plane, but it is not clear yet whether this is to do with extended exposure to a high shear environment.181,182
The method has demonstrated complete conversion of graphite into micro/nano-platelets with thicknesses up to 70–200 nm.167 However, the yield of few-layer graphene with average number of atomic layers less than 10 has been found to be typical of other high-performance shear exfoliation techniques at around 3%.183 Other critical examinations of this methodology are required to address some of the practicalities for scale-up.
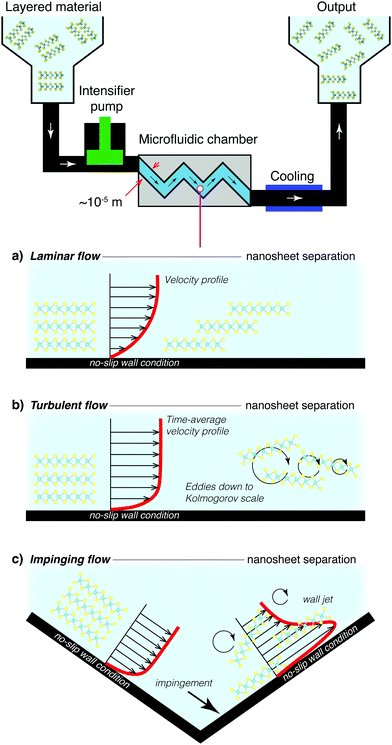
The microscale channels are often similar dimensions to the particle precursor (∼10–100 μm), and can agglomerate within the small channels leading to clogging. Blockages in these systems can clearly be laborious to halt and clean. High shear stresses within the reactor result in viscous heating and large increases in temperature within the microfluidic device. Both high pumping power and cooling contribute to the total power required for operation when considering process efficiency. These items may be seen as minor or secondary issues in low volume laboratory or pilot synthesis. Extending the approach to high-throughput operation and varied starting materials, however, and batch failures, product variability, process down-time and energy use become important factors for material quality and cost.
![[small gamma, Greek, dot above]](https://www.rsc.org/images/entities/i_char_e0a2.gif) > 1 × 10⁴ s−1 for graphene and
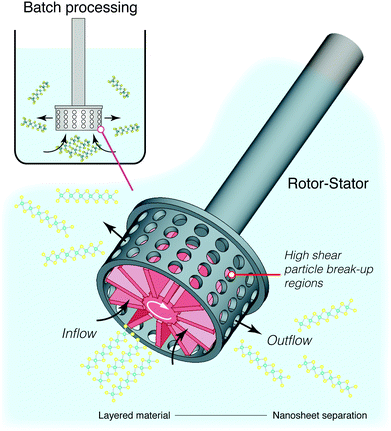
> 1 × 10⁴ s−1 for graphene and ![[small gamma, Greek, dot above]](https://www.rsc.org/images/entities/i_char_e0a2.gif) > 3 × 10⁴ s−1 for semi-conductors MoS2 and WS2.164,185 This kind of setup is inherently scalable and much of the technology is already widely used in large scale batch mixers, or even in small scale kitchen blenders.177 These systems are however not optimised for nanosheet synthesis, and a purpose built system could reduce energy consumption and ensure a more homogeneous distribution of shearing forces within the mixture. Current high shear mixing designs focus on localised shear using batch homogenisers,164 such as the rotor-stator arrangment illustrated in Fig. 13. This will obviously require further process optimisation, either through targeted computational fluid dynamics studies186 or through repeated design iterations. Nonetheless, the groundwork is there for a successful process which would work on multiple materials and have minimal impact on quality or defects.
> 3 × 10⁴ s−1 for semi-conductors MoS2 and WS2.164,185 This kind of setup is inherently scalable and much of the technology is already widely used in large scale batch mixers, or even in small scale kitchen blenders.177 These systems are however not optimised for nanosheet synthesis, and a purpose built system could reduce energy consumption and ensure a more homogeneous distribution of shearing forces within the mixture. Current high shear mixing designs focus on localised shear using batch homogenisers,164 such as the rotor-stator arrangment illustrated in Fig. 13. This will obviously require further process optimisation, either through targeted computational fluid dynamics studies186 or through repeated design iterations. Nonetheless, the groundwork is there for a successful process which would work on multiple materials and have minimal impact on quality or defects.
5.2 Thermal exfoliation
Thermal exfoliation consists of exposing a precursor, or a suspended precursor mixture to high temperatures (≈500 °C depending on the material). The variations on this method are illustrated in Fig. 14 for the synthesis of g-C3N4 nanosheets. The first example exposes a bulk material containing an intercalant to high temperatures which lead to the decomposition of layers in the lattice through the release of gases. This also promotes the formation of pores in the basal plane that can increase surface area for photocatalysis.187 The second example exposes a bulk material to high temperatures in air, driving layer-by-layer oxidation, together with layer splitting and large volumes of gaseous product release.188 This exfoliates and thins layered precursors, as well as leading to particle fragmentation and pore formation. For both synthesis routes, the precursor is usually dry, and can be exposed to an inert environment in some cases to avoid doping the nanosheets with oxygen. When applied to 2D materials, the process shown in Fig. 14b) is sometimes labeled thermal etching, which is indicative of a much more targeted application of heat; though this is rarely the case in practical use and is more aptly termed thermal annealing.This basic methodology is widely known to create defective nanosheets with vacancies (see Fig. 15), inclusions and even large holes.189 Depending on the purpose, this type of synthesis can have beneficial effects on the performance of the photocatalyst.111 This approach is most prominently used in conjunction with g-C3N4, where it has been proven as a highly effective photocatalyst.190 In contrast, thermal annealing of graphite produces highly defective graphene, which does not perform well as a charge carrier, but can be used as a photocatalyst in its own right.
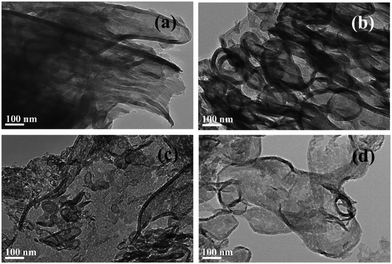 | ||
| Fig. 15 TEM images of bulk g-C3N4 (a), alongside porous g-C3N4 exfoliated at 450 °C (b), 500 °C (c), 550 °C (d). The heat decomposes certain areas of the nanosheets, leaving the resultant sheets ranging from slightly exfoliated and porous to fully exfoliated and with large holes. Reproduced with permission from ref. 188. Copyright 2015 Elsevier B.V. | ||
A system like this is inherently scalable, and may provide a reasonable yield, though the quality and defectiveness of the nanosheets produced is not always adequate. Although these defects are easy to introduce, it is significantly challenging to remedy with post-processing. Therein, this method of synthesis is applicable to a few specific cases, and should be treated as a purpose-dependant method of synthesis.
5.3 Intercalation
Non-mechanical routes to exfoliation typically involve chemically intercalating foreign molecules or atoms in between the layers of the crystal to exfoliate the precursor directly, or to assist mechanical exfoliation. These routes often oxidise, to an even higher degree than that of thermal exfoliation. Non-oxidising routes to exfoliation can be preferred to oxidising routes, as the introduction of new defects is much easier than the removal of pre-exsisting defects. Intercalation is oxidising, as it is unavoidable that some of the intercalated ions adhere to the nanosheets after exfoliation. Intercalation alone can also leave small parts of the precursor material untouched, and therefore it is usually complimented in the literature with some form of mechanical exfoliation to assist the decomposition of these leftover unexfoliated materials.As highlighted, defective PCs can be advantageous, therein, this technique does seem to offer a scalable route to production for many suitable photocatalytic materials. However, many of these bulk materials range in conductivity, indicating that some of the potential difference applied to the electrodes will be spent overcoming the internal resistance of such a system. This can be mitigated by the use of a conducting additive such as Li+, but this complicates the process.192 Furthermore, the product is not strictly composed of mono- or few-layers, but can contain stacked unexfoliated precursor particles which break off and subsequently cannot be exfoliated further due to their distance to the electrodes.
When applied to graphite, this methodology is known as the modified Hummers’ method, and produces highly functionalised GO.196 The sheets produced are morphologically well-formed large mono- and few-layers, with some pores induced through the exothermic reaction. These sheets require intensive post-processing to form reduced-GO (rGO) nanosheets with a reduced defect quantity. By themselves, functionalised GO sheets can perform as PCs, but do not perform well as charge carriers.197
5.4 Composites
Photocatalytic composites account for approximately one third of the total published research online (when comparing “synthesis photocat” to “synthesis photocat composite” on the Web of Knowledge). Of which, half mention the use of TiO2 while just under a quarter include graphene. Both of these materials are excellent supporting materials for visible light active PCs, but do not perform well on their own.Combining charge carriers and dedicated PCs as a composite material provides a route for electron-hole pairs to separate efficiently and react with the surrounding water. Prefabricated nanosheets mixed in solution are essential to all of these methods. In that regard, the methods discussed here are approaches that can further the viability of composites in photocatalysis and enable the intrinsic advantages of nanosheet PCs to be fully exploited.
 | ||
| Fig. 18 Schematic representation of the solvo- or hydrothermal synthesis process for producing nanosheets and nanocomposites. | ||
Hydro/Solvothermal synthesis has been used with great success to apply nanomaterial coatings to nanosheets. Graphene is one of the most prominent materials here, with many inorganic nanocrystals being successfully deposited on its surface, irrespective of its oxidised state. These materials include Metal Oxides, Nitrides and Chalcogenides, among others.198 These composites can take a variety of shapes and forms as shown in the example in Fig. 19 for rGO coated TiO2 nanoparticles.199
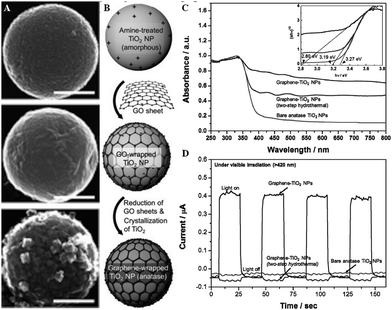 | ||
| Fig. 19 An example of a hydrothermal route to composite synthesis, with corresponding SEM images (A) and photocatalytic activity. (B) shows a schematic representation of the route, where rGO coated TiO2 nanoparticles (NPs) were created through a combination of electrostatic interactions and in-solution mixing, followed by simultaneous hydrothermal reduction of the GO into rGO and crystallisation of the initially amorphous TiO2 NPs (graphene-TiO2 NPs). These NPs were compared to separately crystallised TiO2 followed by the same electrostatic-assembly and hydrothermal reduction (two-step hydrothermal), and bare anatase NPs, in terms of their photocatalytic (C) and photoelectric activity (D). The scale bars shown in (A) represent 200 nm. Figure adapted from Lee et al.199 Reproduced with permission from ref. 199. Copyright 2012 John Wiley & Sons Inc. | ||
The most commmonly templated nanomaterial is again graphene, however these processes are more sensitive to oxidised graphene, meaning that epitaxial growth of nanostructures has only been demonstrated on pristine graphene sheets, manufactured out of solution.166 Therefore, full epitaxial growth of 2D/2D heterostructures is currently reserved for the lab scale and unsuitable for the large scale synthesis required for photocatalysis. A variety of 2D nanosheets have since been grown on in-solution graphene, including the main classes of photocatalysts discussed here.200 These nanostructures often have much better adhesion to the templated material, demonstrating a greatly enhanced photocatalytic activity. Templated assembly (self-assembly) defines the materials to be fully formed before combination. These assembly techniques (much like hydro/solvothermal methods) often require some external energy or take advantage of the electrostatic interactions between materials.197
6 Treatment & reuse
Much like synthesis can affect morphology, practicality plays a role in the implementation of photocatalytic materials for real-world water treatment applications. With this in mind, the groundwork of specific treatment and reuse cases can be broken down into three parts:• The treatment stage, or the application of a photocatalyst to water purification.
• The separation or filtration of the photocatalyst from the water.
• The reapplication and re-usability of the photocatalyst after the first use.
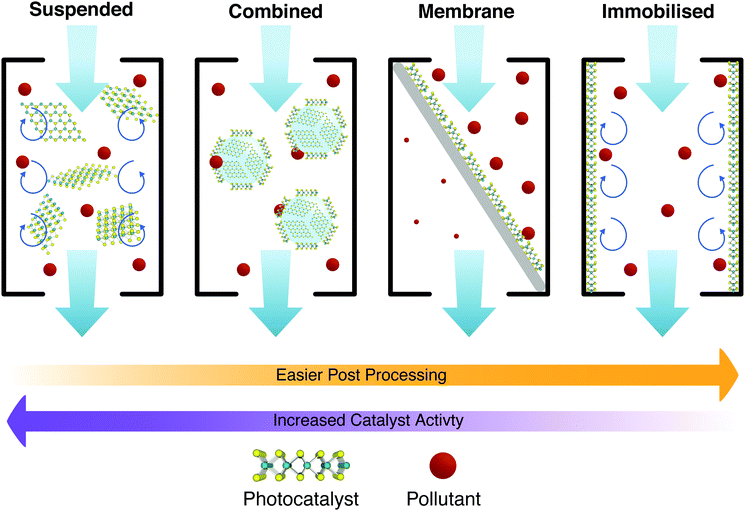
These factors can be tightly interlinked as shown in the schematic of Fig. 20 for different approaches. Each individual photocatalyst then brings its own pros and cons. Some obvious ones include material activity, ease of synthesis and processing. Other features such as the PCs tendency to aggregate to other particles, or the average size of the photocatalyst, are less obvious. 2D materials are inherently difficult to separate from treated water, as any technique utilising the photocatalyst in suspension must then apply suitable filtration to remove the catalyst from the water. This adds resistance to the flow, and additional treatment stages and complexities, ultimately increasing the running costs to the point where it is unsustainable.202 Therefore, the larger the photocatalyst, the more trivial the separation and reuse; but any decrease in the surface area of the photocatalyst in contact with the water has a detrimental effect on the photocatalytic activity, and vice versa. This interdependence marks most trade-offs and choices for the application of PCs in water treatment, and is illustrated in Fig. 20.
Generally it would appear that the reuse of PCs is effective with little loss in efficacy with each reuse cycle. Panthi et al.203 show two studies testing the reuse of PCs, neither of which show a substantial loss in overall treatment efficiency, or treatment time. Xu et al.204 also show two studies with similar results. PCs can be applied in many ways, so long as they make contact with the water, are irradiated with light with energy greater than or equal to their band gap (see Fig. 3 and 4), and have a suitable band gap to create redox potentials (see Fig. 6). These factors should ideally be maximised but due to practical limitations, this cannot always be the case. Treatment methods are hence split into two groups depending on how the photocatalyst is allowed to contact the water, e.g. whether it has been immobilised on a substrate or whether it is suspended within the fluid (or allowed to mix liberally).205
6.1 Immobilised
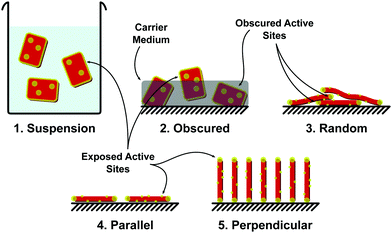
Immobilised PC are at first glance the more practical in terms of large scale implementation, with systems trading efficacy (due to reduced active sites in contact with the fluid) for simplified operating procedures, negating the requirement for a recovery stage. In terms of cost scaling, these methods increase in efficiency when scaled.206Limited active site availability has been discussed earlier in this review with methods such as heteroatom doping to increase the number of active sites on a 2D photocatalyst introduced. It is also important when considering immobilised photocatalysts that the exposure of active sites be considered. Many immobilisation techniques such as dip coating, immobilisation within a carrier medium, inclusion in a membrane precursor dope, can act to block active sites. Methods to increase the active sites on the basal plane of a material are still of importance, especially when particles are aligned parallel to the deposition surface. When considering immobilised photocatalysts at the 2D material scale, a number of configurations may be possible, including: (1) suspension (non-immobilised), (2) obscured (in a carrier or membrane dope), (3) randomly immobilised, (4) parallel immobilisation, and/or (5) perpendicular immobilisation (Fig. 21).
Issues with PCCs stem from their highly reactive nature, which in turn make them sensitive to environmental conditions in terms of mass loss and colour change.214 Though PCCs remain active and can slightly increase in activity throughout their life as the coating is degraded exposing new active sites,215 the effect of PCCs leaching nanomaterial into water supplies at a large scale would impact water quality downstream and have unknown health effects.216 At industrial scale, PCCs become difficult to implement as the space required for effective throughput scales poorly compared to suspended methods.
As well as the previously discussed PCCs which immobilise the PC in a carrier medium, such as a paint, PCs can also be coated directly onto a surface. Bayat et al.217 immobilised MoS2 nanosheets on Fluorine-doped Tin Oxide (FTO) slides for hydrogen evolution reaction. Using FTO negated the need for a binder material, reducing the potential for mass loss and coating degradation. This approach has the same scalability concerns as previously mentioned and is not applicable in urban spaces such as for NOx remediation.
Zheng et al.228 provides an exhaustive list of the myriad of factors which can influence their performance, and notes that they have been used with success to treat campus sewage, pharmaceutical waste and micro pollutants, among others. PMRs can also be readily deployed in many ways as a continuous, semi-batch or batch process. One of the main challenges to this technique is the fouling of the membranes, which can be abated to some extent via good reactor design,229 though efficiency dictates that reactors are designed such that the flow passes through and not along the photocatalytic membrane for optimal performance (aptly named “flow-through” membranes).230 Hence, PMRs behave like enchanced PCCs, yet are on the whole more difficult to construct and bring about issues with membrane fouling.
6.2 Suspended
Suspending PCs in water provides the highest quantity of active sites to be exposed at all times. The downsides of this method include turbidity in the liquid, caused by pollutants or PCs, and the requirement for an additional processing step to remove PCs from the effluent. Suspended applications usually require batch processes which can be less advantageous than continuous flow processes.There are still some unanswered questions to their function, with competing separator design (magnet orientation, location, attempts to make the process continuous-flow are complex etc.) being one of the smaller concerns.236 Moreover, the stability of MNPCs is still in question. Although nanosheets themselves offer better chemical and photo-stability than their microscopic counterparts, this is often not well characterised within previous literature reviewing MNPCs. Simply put, many are touted as “stable” over repeated cycles, but with no supporting evidence as to whether this is the case.237 Macro-ZnO for example, is usually prone to photocorrosion, but is generally stable at the nano-scale. Nonetheless, photostability remains a concern across the board, and as VLA photocatalysis has been demonstrated with MNPCs utilising a wide range of materials,236,238 this system remains a promising technique.
6.3 A combined approach
Previously discussed PCs are either immobilised on a solid or porous substrate, or used in suspension. Another approach would be to immobilise the PC onto a substructure which is then placed in suspension (see Fig. 20). This can be done to maximise mixing, and aid in the PC's retention or facilitate recovery. Some ways in which this approach can be applied are by; immobilising a PC on ceramic beads,239,240 permeable hydrogel beads,241–243 large inert carriers238 or cilia-like constructions which are fixed on one end and allowed to move freely,244 or forced to move using an external magnetic field.245 Most of these systems which immobilise the PC onto a larger suspended particle will require further post processing similarly to a slurry style reactor, however this processing is simplified by the increased size of the PC and thus a coarser filter can be used for separation.Zeolite has been experimented with for some time as a micro-scale TiO2 carrier that when agitated within flow, releases TiO2 which is then free for reactions, but also crucially reabsorbs TiO2 when left to settle, allowing the TiO2 to be recovered.246 These systems may require post-process filtering stages or are challenging to synthesize, but eliminate the need for fine meshes or membranes, which reduces their cost. Leeching is also a problem with these systems, as certain carriers degrade over time (such as the UV degradation of hydrogels242), leading to possible contamination of the freshwater output. Unfortunately, these methods, though better than static PCCs, still reduce the number of active sites and are therein less effective than suspended PCs.247
6.4 Photocatalytic reaction chambers (PRCs)
PRCs in practice vary in design depending on the light source, necessary recovery processes, immobilisation method, and the PC used. A non-exhaustive list of possible designs could be:• A sunlight irradiated PRC, using a stirred vessel with internal walls coated in a PCC.
• A lamp driven, actively mixed PRC, which employs a MNPC. MNPCs would typically be used in batch processes, this could imply a high capital cost but would maximise the effectiveness of the photocatalyst.
• A UV-tube lamp surrounded by glass beads with PC immobilised on their surface.
• A sunlight irradiated membrane with PC incorporated into the membrane. Mirrors could be used to concentrate sunlight onto the membrane surface. This could form a continuous flow, modular system.
• A sunlight irradiated tank utilising PC doped hydrogel beads which float and can be skimmed from the surface of the treated water.
Implementation thus dictates the design of the reactor, and its effectiveness.248 Suspended PC reactors are much more active than immobilised systems, providing a near threefold improvement in degradation rate over contemporary PCCs.249 Suspended reactors, often dubbed photocatalytic Slurry Reactors (SR, Fig. 22) are the most efficient method of applying PCs, yet operate on the assumption that the PC recovery process occurs elsewhere in the system, effectively separating the challenge of recovery and application. The numerical modelling of such photocatalytic systems can be extremely challenging250 due to the combined effect of particle-fluid modelling (multi-phase flows) with combined radiation and chemical reaction modelling. Hence, full models examining steady-state PRC operation are largely in their infancy.251
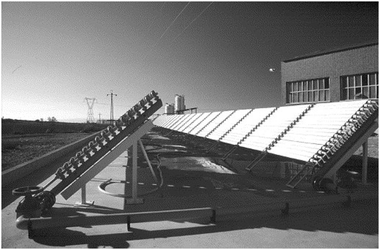 | ||
| Fig. 22 One of the first pilot plants for photocatalysis, employing a slurry reactor (in a static concentrator array) installed at latitude 40° (Arganda del Rey, Madrid, Spain). Costing estimates in Section 1 for plant scale PCs are taken from this plant's operation.62 Reproduced with permission from ref. 67. Copyright 2002 Elsevier B.V. | ||
Moving away from SR, there are a wide variety of PRCs designed to be implemented with PCCs and PMRs. Thin-film PRCs have been examined thoroughly, especially for use with immobilised252 and suspended253,254 PCs. These systems have largely fallen out of favour due to the generally low throughput and inherent drawbacks to immobilised photocatalysts.249 Moreover, scaling these processes would require increasing footprint area, potentially making this system unfeasible for industry.
7 Recommendations for photocatalysis research
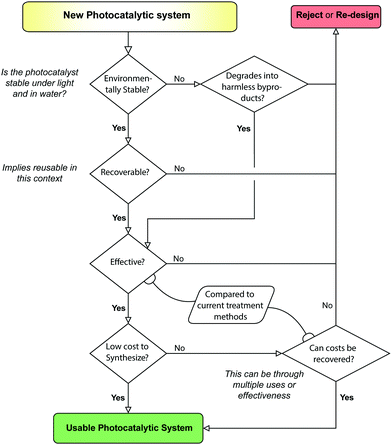
Throughout the writing of this review, the authors have come to several conclusions over what is best practice in the manufacture of photocatalytic composites. Foremost of these is a holistic view for PCs; Treatment, synthesis and recoverability should all be considered in unity when establishing the utility of a PC. This type of PC design is thus termed a Photocatalytic Systems (PCSs) approach (see Fig. 23). A PCSs view is key for both material synthesis and design, as well as certain recovery techniques, such as MNPCs and PMRs.Environmental stability is one such factor which is consistently omitted from most papers, even though longevity and stability have a sizeable bearing on whether the system will be realistically worthwhile. TiO2 is widely available simply because of this fact, appearing in a large chunk of the literature.12 As P-25 is still in production, it proves low-cost and simple photocatalysts have their place in the market, but not yet widespread in industry. Putting effort into making a full product, from nanomaterial to device scales, can thus offset a number of hurdles for industrial adoption down the line.
A particular concern is an apparent lack of standardisation in solar-driven photocatalytic materials research. This inhibits reproducibility, prevents direct comparisons between materials systems, and ultimately delays the translation of research for large-scale water treatment. Table 3 highlights a sample of recent publications on photocatalytic materials or systems. In just these seven publications, ten different model pollutants have been used, eight of which are known to have sensitisation effects.139 No less than six different light sources, from ‘Visible Light’ to a commercial solar simulator, have been stated with varying levels of detail given. Additionally, each has different conventions for interpreting and displaying data, and differing time scales for pollutant removal. A common claim in much of the literature is a seemingly enormous % removal of pollutant which upon closer inspection appears to be simply a large % removal via adsorption and then a subsequent, smaller than claimed, photocatalytic degradation of pollutant. These inconsistencies between experiments lead to a number of suggestions for future photocatalytic materials research:
| Material | Immobilisation | Pollutant | Radiation | Efficacy | Source |
|---|---|---|---|---|---|
| a Organic dyes are known to have a photocatalytic sensitisation effect150 (Table 2). b Unspecified – spectra unknown. | |||||
| Ag3PO4 doped MoS2, ZIF-8, h-BN | 16 wt% in 150 μm thick PVDF MMM, glass slide cast | Drimaren Orange (P2R)a | 150 W halogen lamp placed near | Constant flow treatment. P2R removal efficiencies between feed and effluent streams of 89, 79, 98% in 80 minutes measured using UV spectrophotometer. No mention of allowing membranes to reach P2R adsorption equilibrium in dark conditions. 15 L of water was treated. Pseudo first order removal rates 0.02487, 0.04093, 0.06139 | 219 |
| MoS2TiO2 | In suspension | Methylene Blue (MB)a, crystal violet (CV)a, rhodamine B (RhB)a, Methyl Orange (MO)a | Solar simulator (Asahi Spectra HAL 320) | ≈92% removal of MB using 50 wt% MoS2:TiO2 including significant adsorption. Stated removal % is inclusive of adsorption and photocatalytic degradation. Degradation measured using UV-Vis spectrophotometer. | 255 |
| MoS2g-C3N4 | In suspension | E. Coli | Visible lightb | Up to 99.99% sterilisation of E. Coli was observed with good repeatability (less than 0.23% decrease in efficiency after 6 cycles) | 256 |
| ZnS nanospheres | Activated carbon | Congo Red (CR)a | Visible lightb | 88% CR removal after 100 minutes inclusive of significant (37%) adsorption and photocatalytic degradation. Initial CR concentration 25 mg L. CR concentrations measured via UV-Vis spectrophotometer. | 257 |
| TiO2 | Dip coated onto Fe-PPG | Methyl Orange (MO)a | 45 W fluorescent lamp | Removed up to 95.3% of MO in 60 minutes with 23.3 mg g MO TiO2 adsorbed for a removal rate of 0.083. Initial pollutant concentration 20 mg L−1. Pollutant concentrations measured using direct spectrophotometer (464 nm) | 258 |
| MoS2TiO2 | Vacuum filtered onto PAN membrane | Rhodamine B (RhB)a, Methyl Orange (MO)a, rhodamine 6G (RG6)a, Malachite Green (MG)a, Methylene Blue (MB)a | 500 W xenon lamp 30 cm from liquid surface | Membranes allowed to float on water surface. Total fluid volume maintained at 50 mL by addition of DI water throughout. 83.88–97.73% removal of organic dye compounds from initial concentration 5 mg L−1 in 120 minutes. Pollutant adsorption unspecified however virgin PAN membrane showed 89.53% MB removal suggesting significant adsorption for all samples. No dark period to reach adsorption equilibrium is mentioned. Pollutant degradation measured via UV-Vis spectrophotometer. | 221 |
| MCU(DMSO)-C3N4 | Vacuum filtered with PEG and GA cross linkers onto PVDF Membrane | Rhodamine B (RhB)a, Tetracycline Hydrochloride (TC) | 300 W Xenon lamp | Up to 84.24% removal of RhB in 250 minutes. Up to 71.26% removal of TC in 375 minutes. Initial pollutant concentrations were 5 mg L−1 and removal rates were 0.00748 and 0.00352 respectively. 1 hour of dark environment adsorption prior to photocatalytic effect but it is not mentioned if this is included in the final removal figures or not | 222 |
(1) Light source and intensity be properly documented including the type of light and its intensity at the photocatalyst. Solar photocatalysis is a sustainable route forwards and as such the spectrum of the used light should be provided and compared to that of natural sunlight. Where possible light intensity at the catalyst should be equal to approximately 1 Sun. If possible, light should be collimated and if not this should be documented.
(2) Pollutants used should inhibit a light sensitisation effect with the photocatalyst. Examples might include salicylic acid and phenol.137 Ideally, pollutants which undergo different degradation pathways should be used to gain a holistic view of the degradation of different organic pollutants.
(3) Systems should be allowed to reach adsorption equilibrium, and measured periodically whilst in dark conditions to confirm that adsorption equilibrium has been reached. For constant flow membrane systems, the effluent should be recycled until a constant effluent pollutant concentration is reached under dark conditions. At which point the light should be turned on and the measurement of photocatalytic % degradation should be taken from the time the light is turned on instead of initial pollutant concentration in dark conditions.
(4) UV-Vis spectrophotometry can be used to determine the removal of compounds but it would be more rigorous to confirm these values, as well as the degradation of the initial pollutant and any degradation products, using methods such as thermogravimetric analysis and chemical oxygen demand.
8 Conclusions
Nanoscale photocatalyst materials are quintessentially one of many applications within water treatment (incl. nano-adsorbents & membrane nanotechnology, disinfection, sensing) where nanosheets are poised to play a major role in the coming years.202 2D PCs in particular are gaining increased attention due to their increased quantum efficiency, surface area, facile construction of composites and crucially, their visible light active performance. Though the benefits of using 2D materials are well understood, scalable and sustainable routes to synthesis for many of the base 2D materials are lacking. These are required for manufacturing high performing photocatalytic composites at large scales. Most published research and patent-protected developments focus on the final PC, while those that focus on material synthesis struggle to balance high yields with defect-engineered nanosheet production. In most cases, a lack of standardisation for industry to adhere to has resulted in insufficient material quality that stymies progress in many fields using 2D materials, including sustainable photocatalysis. This highlights the critical need for material quality control and assurance methods to support with developments in international standardisation.For applications in photocatalysis, scaling up production of nanomaterials is key for industrialised water treatment. Top-down methods have provided the primary synthesis for 2D semiconductors, charge carrier materials, and nanocomposites used in photocatalytic pollution remediation research. However, no single synthesis technique can address the breadth of photocatalytic materials possible. This highlights the importance for a variety of synthesis routes to be designed with considerations for sustainable and resource-efficient large-scale production and post-processing.
VLA-PCs are often constructed from a variety of different nanomaterials as composites, and though they are pioneering at the lab scale, they do not account for any systematic recovery of the composite essential for pilot plants. Development of new materials and composites which can maintain performance and permit easy removal and re-use is key. Even trading a little efficiency for facile separation is a worthwhile trade-off, as the costs for separating nanoparticles can be steep. Further materials research is necessary to achieve this balance, though a systems approach to these problems can guide research in the future. Modular approaches to PCs simply do not account for the entire life cycle of the photocatalyst, opting for a narrow view without addressing the factors preventing the adoption of nanosheet PCs.
Through writing this review, the authors have noted a marked difficulty in the comparison between different photocatalytic systems (Table 3 and Section 7). There are no well-defined metrics which allow for direct comparisons between photocatalytic systems such as PCCs, PMRs, PRCs etc. There have been rapid research developments focused on engineering VLA-PCs to achieve high pollution remediation efficiencies. This has grown the library of suitable 2D nanosheets and nanocomposite materials. However, this performance objective has been favoured over basic concerns of manufacture, stability and application, under the assumption that these issues can be addressed later. Due to the intertwined nature of synthesis, photocatalytic performance, application and recovery, more holistic approaches are necessary to engineer 2D photocatalysts for large-scale use. In summary, the main points barring the adoption of nanosheet PCs and others into water treatment are:
(1) Reduce the cost of nanosheet production while fully characterising the product – specific nanosheets required for VLA photocatalysts are prohibitively expensive. Lowering costs through production scaling will improve industrial accessibility for nanosheet-derived photocatalysts. This must be combined with accurate descriptions of the average nanosheet size including their length, width and number of layers along with their associated distributions and the typical lattice structure including any systematic defects present in the final material.
(2) Approach the design of nanosheet PCs at a systems level – nanosheet PCs are consistently designed without foresight towards their life-cycle. In order for them to be seen as a usable alternative to TiO2, nanosheet PCs must be facile to synthesise and separate from inception, with PRCs being designed around their unique properties.
(3) Clearly state the stability of PCs over multiple cycles – most research discussing novel PCs (not exclusive to nanosheet-PCs) decline to provide any information on the stability of the PC in question, instead assuming inherent stability due to them being nano-sized. At a minimum, PCs should demonstrate sufficient stability so as to be cost effective with TiO2-derived compounds. Standardisation across the research community would support this.
(4) Create simple, transferable metrics for comparing photocatalytic systems – many PC systems define throughput under differing conditions and metrics. This complicates comparisons between systems, and leaves a gap to derive standardised tests259 and metrics for photocatalytic water treatment that can then be stated clearly when proposing new photocatalysts.
Nevertheless, solving these issues do not preclude the deployment of industrial water treatment. TiO2-derived PCs have historically been much less effective in operation and slightly more expensive to set up when compared to other contemporary light absorption based AOPs (UV/O3, UV/H2O2).260 A shift to visible light absorbing, nanosheet-based PCs would close this gap; so long as material manufacture and recovery concerns are addressed.
Future research focus
Cost and real-world effectiveness are the primary reasons for the lack of competitive solar-driven photocatalytic systems today. To address these challenges, a number of key research focus areas and their corresponding Technology Readiness Level (TRL) are summarised in Fig. 24. Topics within TRL 1–5 should be considered holistically and with a systems thinking approach described previously (Fig. 23). Discovery and development of new photocatalytic materials and composites which are stable, maximise catalytic activity, and that can be produced on a large scale from abundant precursor sources will improve the cost and sustainability of nanosheet-based solutions. Similarly, scalable synthesis approaches with the ability to engineer material properties for targeted application-specific water treatments will be advantageous.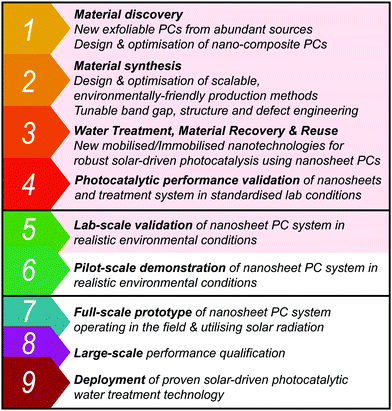 | ||
| Fig. 24 Summary of future research focus areas according to Technology Readiness Level (TRL). Topics within TRL 1–4 align with the photocatalytic systems approach presented in Fig. 23. TRL 5 is highlighted as the prescribed TRL for laboratory research on solar photocatalytic water treatment to successfully transition to the pilot-scale demonstration stage in realistic environments. | ||
On top of this, nanomaterial separation post-treatment remains a lasting issue, with some promising leads (MNPCs, membrane technology). Despite the recent work, significant effort is required to address this challenge and create a suite of viable solutions for material recovery and reuse. Nanotechnology advancements, either at the material discovery/synthesis level and/or the larger water treatment system level, are required to create efficient treatment and re-use processes that minimise operational and whole-life costs. A push towards greener treatment methods will be favourable for solar-driven photocatalysis, and with the correct incentives it can be made competitive with other AOPs.
Currently, the TRL for industrial scale photocatalytic water treatment systems is 5, as though some large scale demonstration plants have been made, most research is still focused on the small scale, seeking to push the boundaries of photocatalytic efficiency. Fundamental research efforts should continue, supported by the development of new standards for assessing photocatalytic performance using nanomaterials. This would ensure scientific repeatability and robust performance comparisons between different materials and devices.
The step between lab-scale validation and pilot-scale demonstration (TRL 5 to TRL 6) is non-trivial, however, a systems approach can ultimately lower the risk of a photocatalytic water treatment technology failing to progress beyond TRL 6. Pilot-scale demonstrations are often smaller than the full-scale prototype (TRL 7–9). Proving out the technology at this smaller pilot-scale may also open up other opportunities. Intensifying the passive nature of solar photocatalytic technology lends itself well to small, off-grid water purification strategies. Attempting to force photocatalysis to work at large scales is currently challenging, due primarily to how inexpensive other methods are in comparison, but also to a lesser extent the large footprint needed for a high-throughput system,261 and the decreased effect they have against complex mixtures of organic pollutants in real wastewater.262 Therefore, tailoring small scale photocatalytic reactors as air or water purifiers, could be another way to advance the commercialisation of fundamental research from TRL 1–5, allowing businesses to develop the viability of the technology and further strengthening the systems approach to designing nanomaterials for sustainable, solar-driven photocatalytic water treatment.
Abbreviations
| SODIS | Solar water disinfection is a passive approach to water cleaning which kills pathogens via sunlight exposure |
| AOPs | Advanced oxidation processes are a subset of treatment techniques which produce highly reductive/oxidising species |
| PCs | Photocatalysts absorb light to directly catalyse reactions |
| VLA | Visible light active refers to the property of a PC to absorb within the visible light spectra |
| CPC | Compound parabolic concentrator |
| TOC | Total organic carbon |
| EC | Emerging contaminents |
| TMDs | Transitional metal dichalcogenides are transition metals covalently bonded to a chalcogenide pair |
| GO | Graphene oxide are graphene monolayers with high functionalisation |
| LPE | Liquid phase exfoliation is a subset of processes for constructing nanosheets dispersed in liquid |
| NPs | Nano-particles |
| PCCs | Photocatalytic coatings, where a photocatalyst is either coated directly onto a surface or immobilised in a carrier material such as a paint |
| FTO | Fluorine tin oxide, glass coated with a fluorine tin oxide layer to make it conductive |
| PMRs | Photocatalytic membrane reactors |
| MMMs | Mixed matrix membranes are a subset of photocatalytic membranes in which the photocatalyst is included within the material used to fabricate the membrane |
| MNPCs | Magnetic nano-photocatalysts |
| PRCs | Photocatalyitic reaction chambers |
| SR | Slurry reactors |
| NWs | Nano-wires |
| TDS | Total dissolved solids, a measure of the amount of dissolved material in a sample of water |
| HPC | Heterotrophic plate count, a procedure for estimating the number of live, culturable, heterotrophic bacteria in a water sample |
| rGO | Reduced graphene oxide |
| TRL | Technology readiness level |
| PCS | Photocatalytic systems |
Author contributions
DP and JB: investigation, formal analysis, visualization and writing – original draft. EE, YM and HE: visualization and writing – review & editing. PD and JS: conceptualization, supervision, visualization and writing – review & editing.Conflicts of interest
There are no conflicts to declare.Acknowledgements
The authors acknowledge funding from the British Council Newton Fund – Institutional Links (Ref: 525463513). DP, JB and JS acknowledge funding from the EPSRC DTP (Ref: EP/T517926/1). JS also acknowledges funding from The Royal Society (Ref: RGS\R2 202379).Notes and references
- H. Ritchie, Water Use and Stress, 2017, https://ourworldindata.org/water-use-stress, (accessed November 2021).
- A. G. Yehia, K. M. Fahmy, M. A. Mehany and G. G. Mohamed, J. Water Clim. Change, 2017, 8, 484–494 CrossRef.
- D. Conway, Global Environ. Change, 2005, 15, 99–114 CrossRef.
- D. L. Sedlak and U. von Gunten, Science, 2011, 331, 42–43 CrossRef CAS PubMed.
- Progress on drinking water, sanitation and hygiene: 2017 update and SDG baselines, 2017, World Helath Organisation (WHO) and the United Nations Childrens Fund (UNICEF).
- V. Gitis and N. Hankins, J. Water Process Eng., 2018, 25, 34–38 CrossRef.
- J.-Q. Jiang, Curr. Opin. Chem. Eng., 2015, 8, 36–44 CrossRef.
- J. Mansouri, S. Harrisson and V. Chen, J. Mater. Chem., 2010, 20, 4567–4586 RSC.
- K. G. McGuigan, R. M. Conroy, H.-J. Mosler, M. du Preez, E. Ubomba-Jaswa and P. Fernandez-Ibañez, J. Hazard. Mater., 2012, 235-236, 29–46 CrossRef CAS PubMed.
- D. B. Miklos, C. Remy, M. Jekel, K. G. Linden, J. E. Drewes and U. Hübner, Water Res., 2018, 139, 118–131 CrossRef CAS PubMed.
- J. Schneider, D. Bahnemann, J. Ye, G. L. Puma and D. D. Dionysiou, Photocatalysis: fundamentals and perspectives, Royal Society of Chemistry, 2016 Search PubMed.
- B. Luo, G. Liu and L. Wang, Nanoscale, 2016, 8, 6904–6920 RSC.
- K. Sunada, Y. Kikuchi, K. Hashimoto and A. Fujishima, Environ. Sci. Technol., 1998, 32, 726–728 CrossRef CAS.
- Y. A. Attia and Y. M. A. Mohamed, New J. Chem., 2022, 46, 1677–1686 RSC.
- B. Wang, B. Dong, M. Xu, C. Chi and C. Wang, Chem. Eng. Sci., 2017, 168, 90–100 CrossRef CAS.
- J. Ran, W. Guo, H. Wang, B. Zhu, J. Yu and S. Z. Qiao, Adv. Mater., 2018, 30, 1800128 CrossRef PubMed.
- T. Oshima, D. Lu, O. Ishitani and K. Maeda, Angew. Chem., Int. Ed., 2015, 54, 2698–2702 CrossRef CAS PubMed.
- Q. Liu, H. Lu, Z. Shi, F. Wu, J. Guo, K. Deng and L. Li, ACS Appl. Mater. Interfaces, 2014, 6, 17200–17207 CrossRef CAS PubMed.
- G. Zhang, C. D. Sewell, P. Zhang, H. Mi and Z. Lin, Nano Energy, 2020, 71, 104645 CrossRef CAS.
- Y. Zhao, Y. Zhao, R. Shi, B. Wang, G. I. N. Waterhouse, L.-Z. Wu, C.-H. Tung and T. Zhang, Adv. Mater., 2019, 31, 1806482 CrossRef PubMed.
- Y. M. A. Mohamed, H. A. E. Nazer, E. A. Elgohery and M. M. Khan, in Chalcogenide-Based Nanomaterials as Photocatalysts, ed. M. M. Khan, Elsevier, 2021, pp. 285–294 Search PubMed.
- W. Tu, Y. Zhou, Q. Liu, Z. Tian, J. Gao, X. Chen, H. Zhang, J. Liu and Z. Zou, Adv. Funct. Mater., 2012, 22, 1215–1221 CrossRef CAS.
- W. Tu, Y. Zhou, S. Feng, Q. Xu, P. Li, X. Wang, M. Xiao and Z. Zou, Chem. Commun., 2015, 51, 13354–13357 RSC.
- Q. Xiang, B. Cheng and J. Yu, Angew. Chem., Int. Ed., 2015, 54, 11350–11366 CrossRef CAS PubMed.
- G. S. Shanker, A. Biswas and S. Ogale, J. Phys.: Energy, 2021, 3, 022003 CAS.
- D. Liu, S. Chen, R. Li and T. Peng, Acta Phys.-Chim. Sin., 2021, 37, 2010017 Search PubMed.
- R. A. Monteiro, C. Rodrigues-Silva, F. V. Lopes, A. M. Silva, R. A. Boaventura and V. J. Vilar, Chem. Eng. J., 2015, 280, 409–416 CrossRef CAS.
- B. L. Abrams and P. C. K. Vesborg, in Catalysts for Environmental Remediation—Examples in Photo- and Heterogeneous Catalysis, ed. S. L. Suib, Elsevier, 2013, pp. 63–85 Search PubMed.
- A. Rioja-Cabanillas, D. Valdesueiro, P. Fernández-Ibáñez and J. A. Byrne, J. Phys.: Energy, 2020, 3, 012006 Search PubMed.
- Z. Wei, M. Xu, J. Liu, W. Guo, Z. Jiang and W. Shangguan, Chin. J. Catal., 2020, 41, 103–113 CrossRef CAS.
- V. L. Colvin, Nat. Biotechnol., 2003, 21, 1166–1170 CrossRef CAS PubMed.
- S. K. Loeb, P. J. J. Alvarez, J. A. Brame, E. L. Cates, W. Choi, J. Crittenden, D. D. Dionysiou, Q. Li, G. Li-Puma, X. Quan, D. L. Sedlak, T. David Waite, P. Westerhoff and J.-H. Kim, Environ. Sci. Technol., 2019, 53, 2937–2947 CrossRef CAS PubMed.
- Global Photovoltaic Power By Country, 2020, https://solargis.com, (accessed November 2021).
- J.-M. Herrmann, Appl. Catal., B, 2010, 99, 461–468 CrossRef CAS.
- A. Fujishima and K. Honda, Nature, 1972, 238, 37–38 CrossRef CAS PubMed.
- J. Huang, X. Xu, C. Gu, G. Fu, W. Wang and J. Liu, Mater. Res. Bull., 2012, 47, 3224–3232 CrossRef CAS.
- G. R. Bamwenda and H. Arakawa, Appl. Catal., A, 2001, 210, 181–191 CrossRef CAS.
- L. Zhang, W. Wang, J. Yang, Z. Chen, W. Zhang, L. Zhou and S. Liu, Appl. Catal., A, 2006, 308, 105–110 CrossRef CAS.
- A. Harriman, J. M. Thomas, W. Zhou and D. A. Jefferson, J. Solid State Chem., 1988, 72, 126–130 CrossRef CAS.
- V. K. Saharan, D. V. Pinjari, P. R. Gogate and A. B. Pandit, Advanced Oxidation Technologies for Wastewater Treatment, Elsevier, 2014, pp. 141–191 Search PubMed.
- D. Vione, T. Picatonotto and M. Carlotti, J. Cosmet. Sci., 2003, 54, 513–524 CAS.
- L. Chen, P. Xu and H. Wang, J. Hazard. Mater., 2021, 127493 Search PubMed.
- A. Chauhan, M. Rastogi, P. Scheier, C. Bowen, R. V. Kumar and R. Vaish, Appl. Phys. Rev., 2018, 5, 041111 Search PubMed.
- J. Jing, M. Liu, V. L. Colvin, W. Li and W. W. Yu, J. Mol. Catal. A: Chem., 2011, 351, 17–28 CrossRef CAS.
- J. Schneider, M. Matsuoka, M. Takeuchi, J. Zhang, Y. Horiuchi, M. Anpo and D. W. Bahnemann, Chem. Rev., 2014, 114, 9919–9986 CrossRef CAS PubMed.
- W. Ho, J. Yu and S. Lee, Chem. Commun., 2006, 1115–1117 RSC.
- Y. Kondo, H. Yoshikawa, K. Awaga, M. Murayama, T. Mori, K. Sunada, S. Bandow and S. Iijima, Langmuir, 2008, 24, 547–550 CrossRef CAS PubMed.
- H. An, B. Zhu, J. Li, J. Zhou, S. Wang, S. Zhang, S. Wu and W. Huang, J. Phys. Chem. C, 2008, 112, 18772–18775 CrossRef CAS.
- L. Amirav and A. P. Alivisatos, J. Phys. Chem. Lett., 2010, 1, 1051–1054 CrossRef CAS.
- X. Yue, S. Yi, R. Wang, Z. Zhang and S. Qiu, Nano Energy, 2018, 47, 463–473 CrossRef CAS.
- H. Rongan, L. Haijuan, L. Huimin, X. Difa and Z. Liuyang, J. Mater. Sci. Technol., 2020, 52, 145–151 CrossRef.
- J.-H. Choy, H.-C. Lee, H. Jung, H. Kim and H. Boo, Chem. Mater., 2002, 14, 2486–2491 CrossRef CAS.
- Q. Lu, Y. Yu, Q. Ma, B. Chen and H. Zhang, Adv. Mater., 2016, 28, 1917–1933 CrossRef CAS PubMed.
- Q. Han, B. Wang, J. Gao, Z. Cheng, Y. Zhao, Z. Zhang and L. Qu, ACS Nano, 2016, 10, 2745–2751 CrossRef CAS PubMed.
- J. Fu, Q. Xu, J. Low, C. Jiang and J. Yu, Appl. Catal., B, 2019, 243, 556–565 CrossRef CAS.
- S. Leong, A. Razmjou, K. Wang, K. Hapgood, X. Zhang and H. Wang, J. Membr. Sci., 2014, 472, 167–184 CrossRef CAS.
- Y. Li, C. Gao, R. Long and Y. Xiong, Mater. Today Chem., 2019, 11, 197–216 CrossRef CAS.
- L. Wang, Z. Sofer and M. Pumera, ACS Nano, 2020, 14, 21–25 CrossRef CAS PubMed.
- A. P. Kauling, A. T. Seefeldt, D. P. Pisoni, R. C. Pradeep, R. Bentini, R. V. B. Oliveira, K. S. Novoselov and A. H. Castro Neto, Adv. Mater., 2018, 30, 1803784 CrossRef PubMed.
- ISO/TS 21356-1:2021(E), Nanotechnologies – Structural characterization of graphene – Part 1: Graphene from powders and dispersions, International Organization for Standardization Standard, 2021 Search PubMed.
- X. Li, J. Yu, S. Wageh, A. A. Al-Ghamdi and J. Xie, Small, 2016, 12, 6640–6696 CrossRef CAS PubMed.
- A. Vidal, A. I. Díaz, A. E. Hraiki, M. Romero, I. Muguruza, F. Senhaji and J. González, Catal. Today, 1999, 54, 283–290 CrossRef CAS.
- D. H. Quiñones, P. M. Álvarez, A. Rey and F. J. Beltrán, Sep. Purif. Technol., 2015, 149, 132–139 CrossRef.
- A. Durán, J. Monteagudo, I. San Martín and S. Merino, J. Environ. Manage., 2018, 210, 122–130 CrossRef PubMed.
- E. Moral Pajares, L. Gallego Valero and I. M. Román Sánchez, Water, 2019, 11, 423 CrossRef.
- B. Ohtani, O. Prieto-Mahaney, D. Li and R. Abe, J. Photochem. Photobiol., A, 2010, 216, 179–182 CrossRef CAS.
- S. Malato, J. Blanco, A. Vidal and C. Richter, Appl. Catal., B, 2002, 37, 1–15 CrossRef CAS.
- J. Ajona and A. Vidal, Sol. Energy, 2000, 68, 109–120 CrossRef CAS.
- S. Malato, J. Blanco, D. C. Alarcón, M. I. Maldonado, P. Fernández-Ibáñez and W. Gernjak, Catal. Today, 2007, 122, 137–149 CrossRef CAS.
- E. Casbeer, V. K. Sharma and X.-Z. Li, Sep. Purif. Technol., 2012, 87, 1–14 CrossRef CAS.
- B. Van der Bruggen, M. Mänttäri and M. Nyström, Sep. Purif. Technol., 2008, 63, 251–263 CrossRef CAS.
- H. Rajput, E. E. Kwon, S. A. Younis, S. Weon, T. H. Jeon, W. Choi and K.-H. Kim, Chem. Eng. J., 2021, 412, 128612 CrossRef CAS.
- H. Wu, H. L. Tan, C. Y. Toe, J. Scott, L. Wang, R. Amal and Y. H. Ng, Adv. Mater., 2020, 32, 1904717 CrossRef CAS PubMed.
- M.-Q. Yang, N. Zhang, M. Pagliaro and Y.-J. Xu, Chem. Soc. Rev., 2014, 43, 8240–8254 RSC.
- M. Lu and P. Pichat, Photocatalysis and Water Purification: From Fundamentals to Recent Applications, John Wiley & Sons, Incorporated, Weinheim, Germany, 2013 Search PubMed.
- A. H. Castro Neto, F. Guinea, N. M. R. Peres, K. S. Novoselov and A. K. Geim, Rev. Mod. Phys., 2009, 81, 109–162 CrossRef CAS.
- A. K. Geim and K. S. Novoselov, Nat. Mater., 2007, 6, 183–191 CrossRef CAS PubMed.
- Y. Ebina, T. Sasaki, M. Harada and M. Watanabe, Chem. Mater., 2002, 14, 4390–4395 CrossRef CAS.
- M. Harada, T. Sasaki, Y. Ebina and M. Watanabe, J. Photochem. Photobiol., A, 2002, 148, 273–276 CrossRef CAS.
- K. Nakata and A. Fujishima, J. Photochem. Photobiol., C, 2012, 13, 169–189 CrossRef CAS.
- Y. Li, Y.-L. Li, B. Sa and R. Ahuja, Catal. Sci. Technol., 2017, 7, 545–559 RSC.
- C. Daulbayev, F. Sultanov, B. Bakbolat and O. Daulbayev, Int. J. Hydrogen Energy, 2020, 45, 33325–33342 CrossRef CAS.
- R. Frisenda, Y. Niu, P. Gant, M. Muñoz and A. Castellanos-Gomez, npj 2D Mater. Appl., 2020, 4, 38 CrossRef.
- J. N. Coleman, M. Lotya, A. O’Neill, S. D. Bergin, P. J. King, U. Khan, K. Young, A. Gaucher, S. De, R. J. Smith, I. V. Shvets, S. K. Arora, G. Stanton, H. Y. Kim, K. Lee, G. T. Kim, G. S. Duesberg, T. Hallam, J. J. Boland, J. J. Wang, J. F. Donegan, J. C. Grunlan, G. Moriarty, A. Shmeliov, R. J. Nicholls, J. M. Perkins, E. M. Grieveson, K. Theuwissen, D. W. McComb, P. D. Nellist and V. Nicolosi, Science, 2011, 331, 568–571 CrossRef CAS PubMed.
- V. Nicolosi, M. Chhowalla, M. G. Kanatzidis, M. S. Strano and J. N. Coleman, Science, 2013, 340, 1226419 CrossRef.
- A. K. Singh, K. Mathew, H. L. Zhuang and R. G. Hennig, J. Phys. Chem. Lett., 2015, 6, 1087–1098 CrossRef CAS PubMed.
- Y. Zhao, S. Zhang, R. Shi, G. I. Waterhouse, J. Tang and T. Zhang, Mater. Today, 2020, 34, 78–91 CrossRef CAS.
- S. J. Moniz, S. A. Shevlin, D. J. Martin, Z.-X. Guo and J. Tang, Energy Environ. Sci., 2015, 8, 731–759 RSC.
- K. Ren, K. Wang, Y. Cheng, W. Tang and G. Zhang, Nano Futures, 2020, 4, 032006 CrossRef CAS.
- Z. Saleem, E. Pervaiz, M. U. Yousaf and M. B. K. Niazi, Catalysts, 2020, 10, 464–499 CrossRef CAS.
- W.-J. Ong and K. P. Y. Shak, Sol. RRL, 2020, 4, 2000132 CrossRef CAS.
- T. Su, Z. Qin, H. Ji and Z. Wu, Nanotechnology, 2019, 30, 502002 CrossRef CAS PubMed.
- Y. Zhang, Z.-R. Tang, X. Fu and Y.-J. Xu, ACS Nano, 2011, 5, 7426–7435 CrossRef CAS PubMed.
- K. Ren, J. Yu and W. Tang, J. Alloys Compd., 2020, 812, 152049 CrossRef CAS.
- H. Ji, P. Du, D. Zhao, S. Li, F. Sun, E. C. Duin and W. Liu, Appl. Catal., B, 2020, 263, 118357 CrossRef CAS.
- H. A. El Nazer and Y. M. A. Mohamed, in Chalcogenide-Based Nanomaterials as Photocatalysts, ed. M. M. Khan, Elsevier, 2021, pp. 173–183 Search PubMed.
- H. S. Lee, S.-W. Min, Y.-G. Chang, M. K. Park, T. Nam, H. Kim, J. H. Kim, S. Ryu and S. Im, Nano Lett., 2012, 12, 3695–3700 CrossRef CAS PubMed.
- Z. Wang and B. Mi, Environ. Sci. Technol., 2017, 51, 8229–8244 CrossRef CAS PubMed.
- T.-F. Yeh, C.-Y. Teng, S.-J. Chen and H. Teng, Adv. Mater., 2014, 26, 3297–3303 CrossRef CAS PubMed.
- Y. Xia, B. Cheng, J. Fan, J. Yu and G. Liu, Sci. China Mater., 2020, 1–14 CAS.
- Z. Zhao, Y. Sun and F. Dong, Nanoscale, 2015, 7, 15–37 RSC.
- C. Lai, N. An, B. Li, M. Zhang, H. Yi, S. Liu, L. Qin, X. Liu, L. Li and Y. Fu, et al. , Chem. Eng. J., 2020, 126780 Search PubMed.
- X. Zhang, Z. Zhang, D. Wu, X. Zhang, X. Zhao and Z. Zhou, Small Methods, 2018, 2, 1700359 CrossRef.
- H. L. Zhuang and R. G. Hennig, J. Phys. Chem. C, 2013, 117, 20440–20445 CrossRef CAS.
- J. Zhang, P. Zhou, J. Liu and J. Yu, Phys. Chem. Chem. Phys., 2014, 16, 20382–20386 RSC.
- L. Liu, H. Zhao, J. M. Andino and Y. Li, ACS Catal., 2012, 2, 1817–1828 CrossRef CAS.
- S. Pei and H.-M. Cheng, Carbon, 2012, 50, 3210–3228 CrossRef CAS.
- Y. Zhu, S. Murali, W. Cai, X. Li, J. W. Suk, J. R. Potts and R. S. Ruoff, Adv. Mater., 2010, 22, 3906–3924 CrossRef CAS PubMed.
- T. Sreeprasad and V. Berry, Small, 2013, 9, 341–350 CrossRef CAS PubMed.
- L. Vicarelli, S. J. Heerema, C. Dekker and H. W. Zandbergen, ACS Nano, 2015, 9, 3428–3435 CrossRef CAS PubMed.
- N. Rono, J. K. Kibet, B. S. Martincigh and V. O. Nyamori, J. Mater. Sci.: Mater. Electron., 2021, 32, 687–706 CrossRef CAS.
- M. Najafi, A. Kermanpur, M. R. Rahimipour and A. Najafizadeh, J. Alloys Compd., 2017, 722, 272–277 CrossRef CAS.
- H. Safajou, H. Khojasteh, M. Salavati-Niasari and S. Mortazavi-Derazkola, J. Colloid Interface Sci., 2017, 498, 423–432 CrossRef CAS PubMed.
- X. Hu, P. Xu, H. Gong and G. Yin, Materials, 2018, 11, 147 CrossRef PubMed.
- I. Altin, X. Ma, V. Boffa, E. Bacaksz and G. Magnacca, Mater. Sci. Semicond. Process., 2021, 123, 105591 CrossRef CAS.
- H. V. Bao, N. M. Dat, N. T. H. Giang, D. B. Thinh, L. T. Tai, D. N. Trinh, N. D. Hai, N. A. D. Khoa, L. M. Huong, H. M. Nam, M. T. Phong and N. H. Hieu, Surf. Interfaces, 2021, 23, 100950 CrossRef CAS.
- T. Govindaraj, C. Mahendran, V. S. Manikandan, J. Archana, M. Shkir and J. Chandrasekaran, J. Alloys Compd., 2021, 868, 159091 CrossRef CAS.
- H. Fattahimoghaddam, T. Mahvelati-Shamsabadi and B.-K. Lee, J. Hazard. Mater., 2021, 403, 123703 CrossRef CAS PubMed.
- A. H. Keihan, R. Hosseinzadeh, M. Farhadian, H. Kooshki and G. Hosseinzadeh, RSC Adv., 2016, 6, 83673–83687 RSC.
- W. Lin, K. Lu, S. Zhou, J. Wang, F. Mu, Y. Wang, Y. Wu and Y. Kong, Appl. Surf. Sci., 2019, 474, 194–202 CrossRef CAS.
- M. Alomar, Y. Liu, W. Chen and H. Fida, Appl. Surf. Sci., 2019, 480, 1078–1088 CrossRef CAS.
- A. J. R. Luciano, L. de Sousa Soletti, M. E. C. Ferreira, L. F. Cusioli, M. B. de Andrade, R. Bergamasco and N. U. Yamaguchi, J. Environ. Chem. Eng., 2020, 8, 104191 CrossRef CAS.
- R. Atchudan, T. N. J. I. Edison, S. Perumal, M. Shanmugam and Y. R. Lee, J. Photochem. Photobiol., A, 2017, 337, 100–111 CrossRef CAS.
- A. A. Yaqoob, N. H. B. Mohd Noor, A. Serrà and M. N. Mohamad Ibrahim, Nanomaterials, 2020, 10, 932 CrossRef CAS PubMed.
- P. Gao, J. Liu, D. D. Sun and W. Ng, J. Hazard. Mater., 2013, 250–251, 412–420 CrossRef CAS PubMed.
- F. Wang, X. Yu, M. Ge, S. Wu, J. Guan, J. Tang, X. Wu and R. O. Ritchie, Environ. Pollut., 2019, 248, 229–237 CrossRef CAS PubMed.
- P. J. Sephra, P. Baraneedharan, M. Sivakumar, T. D. Thangadurai and K. Nehru, Mater. Res. Bull., 2018, 106, 103–112 CrossRef CAS.
- L. Wang, Q. Sun, Y. Dou, Z. Zhang, T. Yan and Y. Li, J. Hazard. Mater., 2021, 413, 125288 CrossRef CAS PubMed.
- A. M. Ramesh, A. Gangadhar, M. Chikkamadaiah, J. Krishnegowda and S. Shivanna, J. Environ. Chem. Eng., 2020, 8, 104071 CrossRef CAS.
- Y. Zhang, Y. Liu, P. Cheng, W. Song, X. Zhang, S. Rong, X. Gao, G. Zhou, Z. Zhang and J. Liu, Chem. Eng. J., 2022, 430, 132918 CrossRef CAS.
- H. Liu, Z. Chen, L. Zhang, D. Zhu, Q. Zhang, Y. Luo and X. Shao, J. Phys. Chem. C, 2018, 122, 6388–6396 CrossRef CAS.
- Y. A. Attia, Y. M. A. Mohamed and T. A. Altalhi, Desalin. Water Treat., 2016, 57, 26014–26021 CrossRef CAS.
- Y. A. Attia and Y. M. A. Mohamed, Appl. Organomet. Chem., 2019, 33, e4757 CrossRef.
- A. Irshad, F. Farooq, M. Farooq Warsi, N. Shaheen, A. Y. Elnaggar, E. E. Hussein, Z. M. El-Bahy and M. Shahid, FlatChem, 2022, 31, 100325 CrossRef CAS.
- V. Thirumal, R. Yuvakkumar, P. S. Kumar, S. P. Keerthana, G. Ravi, D. Velauthapillai and B. Saravanakumar, Chemosphere, 2021, 281, 130984 CrossRef CAS PubMed.
- H. Jing, Q. Cheng, J. M. Weller, X. S. Chu, Q. H. Wang and C. K. Chan, J. Mater. Res., 2018, 33, 3540–3548 CrossRef CAS.
- N. Barbero and D. Vione, Environ. Sci. Technol., 2016, 50, 2130–2131 CrossRef CAS PubMed.
- M. Grätzel, Acc. Chem. Res., 2009, 42, 1788–1798 CrossRef PubMed.
- S. Malato, P. Fernández-Ibáñez, M. I. Maldonado, J. Blanco and W. Gernjak, Catal. Today, 2009, 147, 1–59 CrossRef CAS.
- F. Li, L. Cheng, J. Fan and Q. Xiang, J. Mater. Chem. A, 2021, 9, 23765–23782 RSC.
- H. Wang, L. Zhang, Z. Chen, J. Hu, S. Li, Z. Wang, J. Liu and X. Wang, Chem. Soc. Rev., 2014, 43, 5234 RSC.
- H. Wang, X. Li, X. Zhao, C. Li, X. Song, P. Zhang, P. Huo and X. Li, Chin. J. Catal., 2022, 43, 178–214 CrossRef CAS.
- J. Low, J. Ma, J. Wan, W. Jiang and Y. Xiong, Acc. Mater. Res., 2022, 3, 331–342 CrossRef CAS.
- Y. Bo, C. Gao and Y. Xiong, Nanoscale, 2020, 12, 12196–12209 RSC.
- Y. Li, X. Li, H. Zhang, J. Fan and Q. Xiang, J. Mater. Sci. Technol., 2020, 56, 69–88 CrossRef.
- A. Serrà, L. Philippe, F. Perreault and S. Garcia-Segura, Water Res., 2021, 188, 116543 CrossRef.
- V. Diesen and M. Jonsson, J. Phys. Chem. C, 2014, 118, 10083–10087 CrossRef CAS.
- H. Tran Huu, M. D. N. Thi, V. P. Nguyen, L. N. Thi, T. T. T. Phan, Q. D. Hoang, H. H. Luc, S. J. Kim and V. Vo, Sci. Rep., 2021, 11, 14787 CrossRef CAS PubMed.
- S. Pasternak and Y. Paz, Chem. Phys. Chem., 2013, 14, 2059–2070 CrossRef CAS PubMed.
- S. Mozia, A. W. Morawski, R. Molinari, L. Palmisano and V. Loddo, Photocatalytic membrane reactors: fundamentals, membrane materials and operational issues, Elsevier, 2013, pp. 236–295 Search PubMed.
- Q. Xu, S. Wageh, A. A. Al-Ghamdi and X. Li, J. Mater. Sci. Technol., 2022, 124, 171–173 CrossRef.
- Q. Xu, L. Zhang, B. Cheng, J. Fan and J. Yu, Chem, 2020, 6, 1543–1559 CAS.
- B. Chai, J. Yan, G. Fan, G. Song and C. Wang, Chin. J. Catal., 2020, 41, 170–179 CrossRef CAS.
- A. A. Daryakenari, B. Mosallanejad, E. Zare, M. A. Daryakenari, A. Montazeri, A. Apostoluk and J.-J. Delaunay, Int. J. Hydrogen Energy, 2021, 46, 7263–7283 CrossRef CAS.
- Y. Liu, L. Ren, Z. Zhang, X. Qi, H. Li and J. Zhong, Sci. Rep., 2016, 6, 22516 CrossRef CAS PubMed.
- O. Akhavan, E. Ghaderi and R. Rahighi, ACS Nano, 2012, 6, 2904–2916 CrossRef CAS PubMed.
- J.-Y. Lin, C.-Y. Chan and S.-W. Chou, Chem. Commun., 2013, 49, 1440 RSC.
- K. K. Ghuman, S. Yadav and C. V. Singh, J. Phys. Chem. C, 2015, 119, 6518–6529 CrossRef CAS.
- J. Xiong, J. Di, J. Xia, W. Zhu and H. Li, Adv. Funct. Mater., 2018, 28, 16163028 Search PubMed.
- H. Liu, S. Ma, L. Shao, H. Liu, Q. Gao, B. Li, H. Fu, S. Fu, H. Ye, F. Zhao and J. Zhou, Appl. Catal., B, 2020, 261, 118201 CrossRef CAS.
- Y. Li, T. Liu, Z. Cheng, Y. Peng, S. Yang and Y. Zhang, Chem. Eng. J., 2020, 127868 Search PubMed.
- C. Feng, L. Tang, Y. Deng, J. Wang, Y. Liu, X. Ouyang, H. Yang, J. Yu and J. Wang, Appl. Catal., B, 2021, 281, 119539 CrossRef CAS.
- R. Shi, Y. Zhao, G. I. N. Waterhouse, S. Zhang and T. Zhang, ACS Catal., 2019, 9, 9739–9750 CrossRef CAS.
- K. R. Paton, E. Varrla, C. Backes, R. J. Smith, U. Khan, A. O’Neill, C. Boland, M. Lotya, O. M. Istrate, P. King, T. Higgins, S. Barwich, P. May, P. Puczkarski, I. Ahmed, M. Moebius, H. Pettersson, E. Long, J. Coelho, S. E. O’Brien, E. K. McGuire, B. M. Sanchez, G. S. Duesberg, N. McEvoy, T. J. Pennycook, C. Downing, A. Crossley, V. Nicolosi and J. N. Coleman, Nat. Mater., 2014, 13, 624–630 CrossRef CAS PubMed.
- A. Thomas, A. Fischer, F. Goettmann, M. Antonietti, J. O. Müller, R. Schlögl and J. M. Carlsson, J. Mater. Chem., 2008, 18, 4893–4908 RSC.
- J. Fu, J. Yu, C. Jiang and B. Cheng, Adv. Energy Mater., 2018, 8, 1701503 CrossRef.
- P. G. Karagiannidis, S. A. Hodge, L. Lombardi, F. Tomarchio, N. Decorde, S. Milana, I. Goykhman, Y. Su, S. V. Mesite, D. N. Johnstone, R. K. Leary, P. A. Midgley, N. M. Pugno, F. Torrisi and A. C. Ferrari, ACS Nano, 2017, 11, 2742–2755 CrossRef CAS PubMed.
- J. Stafford, A. Patapas, N. Uzo, O. K. Matar and C. Petit, AIChE J., 2018, 64, 3246–3276 CrossRef CAS.
- R. Raccichini, A. Varzi, S. Passerini and B. Scrosati, Nat. Mater., 2015, 14, 271–279 CrossRef CAS PubMed.
- C. Tsakonas, M. Dimitropoulos, A. C. Manikas and C. Galiotis, Nanoscale, 2021, 13, 3346–3373 RSC.
- Y. Hernandez, V. Nicolosi, M. Lotya, F. M. Blighe, Z. Sun, S. De, I. McGovern, B. Holland, M. Byrne and Y. K. Gun’Ko, et al. , Nat. Nanotechnol., 2008, 3, 563–568 CrossRef CAS PubMed.
- K. D. Ausman, R. Piner, O. Lourie, R. S. Ruoff and M. Korobov, J. Phys. Chem. B, 2000, 104, 8911–8915 CrossRef CAS.
- G. Cunningham, M. Lotya, C. S. Cucinotta, S. Sanvito, S. D. Bergin, R. Menzel, M. S. Shaffer and J. N. Coleman, ACS Nano, 2012, 6, 3468–3480 CrossRef CAS PubMed.
- H. J. Salavagione, J. Sherwood, M. D. Bruyn, V. L. Budarin, G. J. Ellis, J. H. Clark and P. S. Shuttleworth, Green Chem., 2017, 19, 2550–2560 RSC.
- M. Choucair, P. Thordarson and J. A. Stride, Nat. Nanotechnol., 2009, 4, 30 CrossRef CAS PubMed.
- Z. Li, R. J. Young, C. Backes, W. Zhao, X. Zhang, A. A. Zhukov, E. Tillotson, A. P. Conlan, F. Ding, S. J. Haigh, K. S. Novoselov and J. N. Coleman, ACS Nano, 2020, 14, 10976–10985 CrossRef CAS PubMed.
- E. Varrla, K. R. Paton, C. Backes, A. Harvey, R. J. Smith, J. McCauley and J. N. Coleman, Nanoscale, 2014, 6, 11810–11819 RSC.
- J. N. Coleman, Adv. Funct. Mater., 2009, 19, 3680–3695 CrossRef CAS.
- J. N. Coleman, Acc. Chem. Res., 2013, 46, 14–22 CrossRef CAS PubMed.
- A. Ciesielski and P. Samori, Chem. Soc. Rev., 2014, 43, 381–398 RSC.
- M. V. Bracamonte, G. I. Lacconi, S. E. Urreta and L. E. F. Foa Torres, J. Phys. Chem. C, 2014, 118, 15455–15459 CrossRef CAS.
- C. Backes, T. M. Higgins, A. Kelly, C. Boland, A. Harvey, D. Hanlon and J. N. Coleman, Chem. Mater., 2017, 29, 243–255 CrossRef CAS.
- K. R. Paton, J. Anderson, A. J. Pollard and T. Sainsbury, Mater. Res. Express, 2017, 4, 20531591 Search PubMed.
- N. Jeffers, J. Stafford, C. Conway, J. Punch and E. Walsh, Exp. Fluids, 2016, 57, 17 CrossRef.
- S. Biccai, S. Barwich, D. Boland, A. Harvey, D. Hanlon, N. McEvoy and J. N. Coleman, 2D Mater., 2019, 6, 015008 CrossRef CAS.
- J. Stafford, N. Uzo, U. Farooq, S. Favero, S. Wang, H.-H. Chen, A. L’Hermitte, C. Petit and O. K. Matar, 2D Mater., 2021, 8, 025029 CrossRef CAS.
- X. Yuan, C. Zhou, Y. Jin, Q. Jing, Y. Yang, X. Shen, Q. Tang, Y. Mu and A.-K. Du, J. Colloid Interface Sci., 2016, 468, 211–219 CrossRef CAS PubMed.
- F. Dong, Y. Li, Z. Wang and W.-K. Ho, Appl. Surf. Sci., 2015, 358, 393–403 CrossRef CAS.
- J. Ran, T. Y. Ma, G. Gao, X.-W. Du and S. Z. Qiao, Energy Environ. Sci., 2015, 8, 3708–3717 RSC.
- P. Niu, L. Zhang, G. Liu and H.-M. Cheng, Adv. Funct. Mater., 2012, 22, 4763–4770 CrossRef CAS.
- C.-Y. Su, A.-Y. Lu, Y. Xu, F.-R. Chen, A. N. Khlobystov and L.-J. Li, ACS Nano, 2011, 5, 2332–2339 CrossRef CAS PubMed.
- Y. Yang, H. Hou, G. Zou, W. Shi, H. Shuai, J. Li and X. Ji, Nanoscale, 2019, 11, 16–33 RSC.
- N. Liu, P. Kim, J. H. Kim, J. H. Ye, S. Kim and C. J. Lee, ACS Nano, 2014, 8, 6902–6910 CrossRef CAS PubMed.
- J. Xu, L. Zhang, R. Shi and Y. Zhu, J. Mater. Chem. A, 2013, 1, 14766–14772 RSC.
- I. Papailias, N. Todorova, T. Giannakopoulou, N. Ioannidis, N. Boukos, C. P. Athanasekou, D. Dimotikali and C. Trapalis, Appl. Catal., B, 2018, 239, 16–26 CrossRef CAS.
- A. M. Dimiev and J. M. Tour, ACS Nano, 2014, 8, 3060–3068 CrossRef CAS PubMed.
- C. Hu, T. Lu, F. Chen and R. Zhang, J. Chin. Adv. Mater. Soc., 2013, 1, 21–39 CrossRef CAS.
- X. Huang, C. Tan, Z. Yin and H. Zhang, Adv. Mater., 2014, 26, 2185–2204 CrossRef CAS PubMed.
- J. S. Lee, K. H. You and C. B. Park, Adv. Mater., 2012, 24, 1084–1088 CrossRef CAS PubMed.
- C. Tan, J. Chen, X.-J. Wu and H. Zhang, Nat. Rev. Mater., 2018, 3, 20588437 Search PubMed.
- A. Reina, X. Jia, J. Ho, D. Nezich, H. Son, V. Bulovic, M. S. Dresselhaus and J. Kong, Nano Lett., 2009, 9, 30–35 CrossRef CAS PubMed.
- X. Qu, J. Brame, Q. Li and P. J. J. Alvarez, Acc. Chem. Res., 2013, 46, 834–843 CrossRef CAS PubMed.
- G. Panthi, M. Park, H.-Y. Kim, S.-Y. Lee and S.-J. Park, J. Ind. Eng. Chem., 2015, 21, 26–35 CrossRef CAS.
- B. Xu, M. B. Ahmed, J. L. Zhou, A. Altaee, G. Xu and M. Wu, Sci. Total Environ, 2018, 633, 546–559 CrossRef CAS PubMed.
- M. Dijkstra, A. Michorius, H. Buwalda, H. Panneman, J. Winkelman and A. Beenackers, Catal. Today, 2001, 66, 487–494 CrossRef CAS.
- B. Srikanth, R. Goutham, R. Badri Narayan, A. Ramprasath, K. Gopinath and A. Sankaranarayanan, J. Environ. Manage., 2017, 200, 60–78 CrossRef CAS PubMed.
- H. S. Russell, L. B. Frederickson, O. Hertel, T. Ellermann and S. S. Jensen, Catalysts, 2021, 11, 20734344 CrossRef.
- Y. Chen and D. Dionysiou, Appl. Catal., B, 2006, 69, 24–33 CrossRef CAS.
- J. Zeng, S. Liu, J. Cai and L. Zhang, J. Phys. Chem. C, 2010, 114, 7806–7811 CrossRef CAS.
- D. Sugiyana, M. Handajani, E. Kardena and S. Notodarmojo, J. JSCE, 2014, 2, 69–76 CrossRef.
- J. E. Duran, M. Mohseni and F. Taghipour, AIChE J., 2011, 57, 1860–1872 CrossRef CAS.
- R. Portela, S. Suárez, R. Tessinari, M. Hernández-Alonso, M. Canela and B. Sánchez, Appl. Catal., B, 2011, 105, 95–102 CrossRef CAS.
- C. S. Turchi and D. F. Ollis, J. Phys. Chem., 1988, 92, 6852–6853 CrossRef CAS.
- N. S. Allen, M. Edge, G. Sandoval, J. Verran, J. Stratton and J. Maltby, Photochem. Photobiol., 2005, 81, 279–290 CrossRef CAS PubMed.
- M. T. Islam, A. Dominguez, R. S. Turley, H. Kim, K. A. Sultana, M. Shuvo, B. Alvarado-Tenorio, M. O. Montes, Y. Lin, J. Gardea-Torresdey and J. C. Noveron, Sci. Total Environ., 2020, 704, 135406 CrossRef CAS PubMed.
- M. Rani, Keshu, J. Yadav, Meenu and U. Shanker, Environmental, legal, health, and safety issues of green nanomaterials, Elsevier, 2022, pp. 567–594 Search PubMed.
- A. Bayat, M. Zirak and E. Saievar-Iranizad, ACS Sustainable Chem. Eng., 2018, 6, 8374–8382 CrossRef CAS.
- L. Ni, T. Wang, H. Wang and Y. Wang, Chem. Eng. J., 2022, 429, 132457 CrossRef CAS.
- A. V. Sonawane and Z. V. P. Murthy, J. Membr. Sci., 2022, 641, 119939 CrossRef CAS.
- S. A. Gokulakrishnan, G. Arthanareeswaran, Z. László, G. Veréb, S. Kertész and J. Kweon, Chemosphere, 2021, 281, 130891 CrossRef CAS PubMed.
- X. Zhang, K. Fu and Z. Su, Mater. Sci. Eng., B, 2021, 269, 115179 CrossRef CAS.
- J. Huang, J. Hu, Y. Shi, G. Zeng, W. Cheng, H. Yu, Y. Gu, L. Shi and K. Yi, J. Colloid Interface Sci., 2019, 541, 356–366 CrossRef CAS PubMed.
- T. Dou, L. Zang, Y. Zhang, Z. Sun, L. Sun and C. Wang, Mater. Lett., 2019, 244, 151–154 CrossRef CAS.
- P. Argurio, E. Fontananova, R. Molinari and E. Drioli, Processes, 2018, 6, 162 CrossRef CAS.
- X. Chen, Y. Hu, Z. Xie and H. Wang, in Materials and Design of Photocatalytic Membranes, ed. A. Basile, S. Mozia and R. Molinari, Elsevier, 2018, book section 3, pp. 71–96 Search PubMed.
- S. Samsami, M. Mohamadi, M.-H. Sarrafzadeh, E. R. Rene, M. Firoozbahr, M. Mohamadizaniani and E. R. Rene, Process Safety Environ. Protection: Trans. Insti. Chem. Eng., Part B, 2020, 143, 138–163 CrossRef CAS.
- I. Bellobono, B. Barni and F. Gianturco, J. Membr. Sci., 1995, 102, 139–147 CrossRef CAS.
- X. Zheng, Z. P. Shen, L. Shi, R. Cheng and D. H. Yuan, Catalysts, 2017, 7, 20734344 Search PubMed.
- W. Zhang, L. Ding, J. Luo, M. Y. Jaffrin and B. Tang, Chem. Eng. J., 2016, 302, 446–458 CrossRef CAS.
- C. Regmi, S. Lotfi, J. C. Espíndola, K. Fischer, A. Schulze and A. I. Schäfer, Catalysts, 2020, 10, 2073–4344 CrossRef.
- Y. S. Chung, S. B. Park and D.-W. Kang, Mater. Chem. Phys., 2004, 86, 375–381 CrossRef CAS.
- S. A. Heidari-Asil, S. Zinatloo-Ajabshir, O. Amiri and M. Salavati-Niasari, Int. J. Hydrogen Energy, 2020, 45, 22761–22774 CrossRef CAS.
- B. Weng, M.-Y. Qi, C. Han, Z.-R. Tang and Y.-J. Xu, ACS Catal., 2019, 9, 4642–4687 CrossRef CAS.
- W. Wu, C. Jiang and V. A. L. Roy, Nanoscale, 2015, 7, 38–58 RSC.
- I. Sciscenko, S. Mestre, J. Climent, F. Valero, C. Escudero-Oñate, I. Oller and A. Arques, Water, 2021, 13, 2073–4441 CrossRef.
- J. Gómez-Pastora, S. Dominguez, E. Bringas, M. J. Rivero, I. Ortiz and D. D. Dionysiou, Chem. Eng. J., 2017, 310, 407–427 CrossRef.
- M. Shekofteh-Gohari, A. Habibi-Yangjeh, M. Abitorabi and A. Rouhi, Crit. Rev. Environ. Sci. Technol., 2018, 48, 806–857 CrossRef CAS.
- Q. Wang, Q. Gao, A. M. Al-Enizi, A. Nafady and S. Ma, Inorg. Chem. Front., 2020, 7, 300–339 RSC.
- Z. Isik, Z. Bilici, S. K. Adiguzel, H. C. Yatmaz and N. Dizge, Environ. Technol. Innovation, 2019, 14, 100358 CrossRef.
- N. Daneshvar, D. Salari, A. Niaei, M. H. Rasoulifard and A. R. Khataee, J. Environ. Sci. Health, Part A: Toxic/Hazard. Subst. Environ. Eng., 2005, 40, 1605–1617 CrossRef CAS PubMed.
- D. Xiong, W. Zhao, J. Guo, S. Li, Y. Ye, E. Lei and X. Yang, Sep. Purif. Technol., 2021, 277, 119628 CrossRef CAS.
- W.-H. Lam, M. N. Chong, B. A. Horri, B.-T. Tey and E.-S. Chan, J. Appl. Polym. Sci., 2017, 134, 26 CrossRef.
- J. Feng, H. Ding, G. Yang, R. Wang, S. Li, J. Liao, Z. Li and D. Chen, J. Colloid Interface Sci., 2017, 508, 387–395 CrossRef CAS PubMed.
- D. Zhang, W. Wang, F. Peng, J. Kou, Y. Ni, C. Lu and Z. Xu, Nanoscale, 2014, 6, 5516–5525 RSC.
- M. Sun, Q. Wang, B. Dai, W. Sun, Y. Ni, C. Lu and J. Kou, Energy Fuels, 2020, 34, 10290–10298 CrossRef CAS.
- G. Hu, J. Yang, X. Duan, R. Farnood, C. Yang, J. Yang, W. Liu and Q. Liu, Chem. Eng. J., 2021, 417, 129209 CrossRef CAS.
- M. N. Chong, B. Jin, C. W. Chow and C. Saint, Water Res., 2010, 44, 2997–3027 CrossRef CAS PubMed.
- A. Manassero, M. L. Satuf and O. M. Alfano, Chem. Eng. J., 2017, 326, 29–36 CrossRef CAS.
- A. Rachel, M. Subrahmanyam and P. Boule, Appl. Catal., B, 2002, 37, 301–308 CrossRef CAS.
- Y. Boyjoo, M. Ang and V. Pareek, Chem. Eng. Sci., 2013, 101, 764–784 CrossRef CAS.
- J. Wang, B. Deng, J. Gao and H. Cao, Chem. Eng. J., 2019, 357, 169–179 CrossRef CAS.
- Y. Abdel-Maksoud, E. Imam and A. Ramadan, Catalysts, 2016, 6, 2073–4344 CrossRef.
- G. Li Puma and P. L. Yue, Chem. Eng. Sci., 2003, 58, 2269–2281 CrossRef CAS.
- G. Li Puma, Chem. Eng. Res. Des., 2005, 83, 820–826 CrossRef.
- G. Chandrabose, A. Dey, S. S. Gaur, S. Pitchaimuthu, H. Jagadeesan, N. S. J. Braithwaite, V. Selvaraj, V. Kumar and S. Krishnamurthy, Chemosphere, 2021, 279, 130467 CrossRef CAS PubMed.
- X. Zhang, F. Tian, X. Lan, Y. Liu, W. Yang, J. Zhang and Y. Yu, Chem. Eng. J., 2022, 429, 132588 CrossRef CAS.
- K. S. Bhavsar, P. K. Labhane, V. D. Murade, R. B. Dhake and G. H. Sonawane, Inorg. Chem. Commun., 2021, 133, 108958 CrossRef CAS.
- N. F. Aminuddin, M. A. Nawi, N. N. Bahrudin and A. H. Jawad, Appl. Surf. Sci. Adv., 2021, 6, 100180 CrossRef.
- C. C. Le, M. K. Wismer, Z.-C. Shi, R. Zhang, D. V. Conway, G. Li, P. Vachal, I. W. Davies and D. W. C. MacMillan, ACS Cent. Sci., 2017, 3, 647–653 CrossRef CAS PubMed.
- N. N. Mahamuni and Y. G. Adewuyi, Ultrason. Sonochem., 2010, 17, 990–1003 CrossRef CAS PubMed.
- D. Spasiano, R. Marotta, S. Malato, P. Fernandez-Ibañez and I. Di Somma, Appl. Catal., B, 2015, 170-171, 90–123 CrossRef CAS.
- J. J. Rueda-Marquez, I. Levchuk, P. Fernández Ibañez and M. Sillanpää, J. Cleaner Prod., 2020, 258, 120694 CrossRef CAS.
Footnote |
| † Primary author. |
| This journal is © The Royal Society of Chemistry 2022 |

