 Open Access Article
Electrical response of polymer functionalized ultrafine inorganic particles under frequency conditions: an in situ approach†
Sarit K.
Ghosh
 ,
Venkata K.
Perla
and
Kaushik
Mallick
 *
*
Department of Chemical Sciences, University of Johannesburg, P.O. Box: 524, Auckland Park, 2006, South Africa. E-mail: kaushikm@uj.ac.za
First published on 26th July 2022
Abstract
A wet chemical synthesis method is reported for the preparation of polymer stabilized ultrafine palladium iodide particles within the size range of 5–8 nm. The X-ray photoelectron spectroscopy analysis confirmed the formation of palladium iodide with Pd(I)-like species. The dipolar response of the synthesized organic–inorganic hybrid system has been investigated under different temperature and frequency conditions. The dielectric constant value exhibited an inverse relationship with the temperature and the maximum value of ∼595 was achieved at 100 Hz. The maximum polarization and the remnant polarization values of the palladium iodide nanoparticle based sample were 0.20 μC cm−2 and 0.145 μC cm−2, respectively, under 2 kV mm−1 field conditions at 100 Hz. We also have explored the dielectric and electric field driven polarization performance of the palladium iodide nanoparticles under in situ synthesis conditions.
Introduction
Inorganic nanomaterials, functionalized by a special class of polymers, contribute several interesting properties, such as optical,1 electrical,2 magnetic,3 chemical,4 and mechanical2 properties in the hybrid system. In general, the polymer component typically acts as a stabilizer and provides the flexibility of the hybrid system, whereas the inorganic component introduces the specific functionalities and reinforces the mechanical stability of the system. The organic–inorganic hybrid system very often produces unique properties due to the synergetic effect. The unique physical properties of the polymer functionalized nanostructured material, including high surface area to volume ratios and polymer–particle charge transfer, confer useful attributes to the organic–inorganic hybrid system.Polymer supported nanostructured metal oxides and sulfides are an extremely important class of materials from both a scientific and technological viewpoint and have received significant attention for their versatile applications.5,6 Apart from the oxides and sulfides, metal iodides, particularly copper iodide, have shown potential applications as an antibacterial agent7 and glucose sensor.8 Bismuth iodide based organic–inorganic hybrid materials have attracted interest because of their fascinating electronic and optical properties, where the 6s2 lone pair of the Bi3+ plays an important role.9,10 Aniline stabilized bismuth iodide nanoparticles exhibited a moderate dielectric performance via an interfacial polarization mechanism where the halide ion mediated polaron migration was responsible for controlling the overall relaxation and conductivity properties of the material.11 The organic molecule supported bismuth iodide nanoparticle-based device exhibited non-volatile resistive switching behaviour and the space-charge limited current and trap assisted tunnelling mechanisms were responsible for the charge transport process.12 Bismuth iodide thin films have been reported as a potential candidate for photovoltaic absorbers.13 A report has also been published on the fabrication of a bismuth-based perovskite material, (CH3NH3)3Bi2I9, with moderately high power conversion efficiency.14
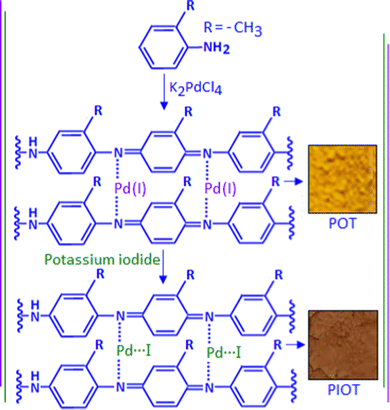
Polymer functionalized nanostructured metallic palladium is well documented as a catalyst in organic transformation reactions,15 oxygen reduction reactions16 and fuel cell applications,17 whereas the preparation and application of a palladium iodide system is rare in the literature.18,19 In the present study, a single-pot two-step wet chemical synthesis method has been applied for the preparation of ultrafine palladium iodide particles using a modified ‘in situ polymerization and composite formation (IPCF)’ route.20–24 The first step involved the reaction between o-toluidine and potassium tetrachloro palladate, which produced a Pd(I)–poly(o-toluidine) complex. The second step was associated with the addition of potassium iodide to the complex and the formation of poly(o-toluidine) stabilized palladium iodide nanoparticles. The dielectric and electric field induced polarization characteristic of the organic–inorganic hybrid system was investigated under different temperature and frequency conditions. In this study, we also explored the dielectric and polarization performance of the palladium iodide nanoparticles under in situ synthesis conditions.
Experimental
Material synthesis
Analytical grade chemicals were used for the material synthesis process. In a typical experiment, 0.09 g of o-toluidine was dissolved in 15 mL of methanol in a conical flask. To this solution, 5 mL of aqueous potassium tetrachloropalladate (K2PdCl4) solution with the concentration of 10−2 mol dm−3 was added slowly. During the addition, a yellow-coloured solid precipitation was formed at the bottom of the conical flask. A fraction of the precipitation was collected and dried, assigned as POT. A freshly prepared potassium iodide solution (3 mL) with the concentration of 10−1 mol dm−3 was added dropwise to the other fraction of the precipitation under stirring conditions. The yellow-coloured precipitation was transformed to chocolate brown colour with time. A schematic representation of the material synthesis is exhibited in Scheme 1. The solid precipitation was collected and dried, assigned as PIOT, and synthesized with an ex situ method.Material characterization and device fabrication
The as-synthesized material was characterized with microscopic (transmission electron microscope, TEM, JEOL, JEM-2100), and surface (X-ray diffraction, XRD, Philips PAN-analytical X’pert diffractometer using Cu-Kα X-ray radiation source, and X-ray photoelectron spectroscopy, XPS, VG MultiLab 2000 system with a monochromatic X-ray source) analytical techniques. To determine the electrical properties of the synthesized materials, a device was fabricated where the material was deposited in the form of a film with a thickness of ∼100 μm on a copper disk (also acting as an electrode) using a drop and dry method. A gold electrode was deposited, using a sputter-coating technique, on the top of the deposited material. The dielectric constant and impedance spectra were determined using a HP 4284A LCR meter under the frequency condition from 100 Hz to 1 MHz. The polarization–electric field (P–E) hysteresis loop was obtained using a modified Sawyer–Tower circuit (PolyK Tech.), where the samples were subjected to a triangular wave of frequency 100 Hz.Result and discussion
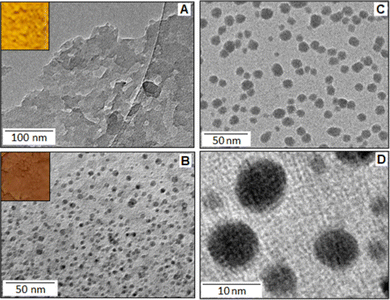
The reaction between o-toluidine and potassium tetrachloropalladate(II) followed the ‘in situ polymerization and composite formation’ type of mechanism20–24 with the formation of a radical cation accompanied by the release of an electron, which is considered as the initiation process of the polymerization reaction. In the reaction, K2PdCl4 acted as an oxidizing agent that initiates a polymerization process for the o-toluidine. During the polymerization process each step involved the release of an electron that participates in the reduction process of Pd(II) ions. In the present scenario, we found evidence for the partial reduction of Pd(II) with the formation of Pd(I), rather than the Pd(0), and produced a Pd(I)–poly(o-toluidine), POT, complex system. The poly(o-toluidine) played the role of a macro-ligand that can coordinate with Pd(I) through the lone pair of the nitrogen and formed a stable complex. The X-ray photoelectron spectroscopy (XPS) analysis confirmed the formation of the Pd(I)-like species. The TEM images showed no evidence for the formation of palladium nanoparticles. The example of partial reduction of Pd(II) to Pd(I) is also available in the literature as Pd(I)-carbonyl carboxylate25 and Pd (I)-cationic phosphine26 complex systems. The addition of potassium iodide to Pd(I)–poly(o-toluidine) ultimately formed poly(o-toluidine) stabilized palladium(I) iodide nanoparticles, PIOT.Fig. 1A shows the TEM image of the Pd(I)–poly(o-toluidine) complex and the inset is the optical image of the complex material. Fig. 1B shows the TEM image of poly(o-toluidine) stabilized palladium iodide nanoparticles, where the dark spots are the palladium iodide particles within the size range of 5–8 nm. A histogram, of particle size as a function of particle frequency, of the palladium iodide nanoparticles is displayed in Fig. S1, ESI.† The inset, Fig. 1B, is the optical image of the polymer stabilized nanoparticle hybrid system. Fig. 1C and D, also show TEM images of poly(o-toluidine) stabilized palladium iodide nanoparticles with different magnifications.
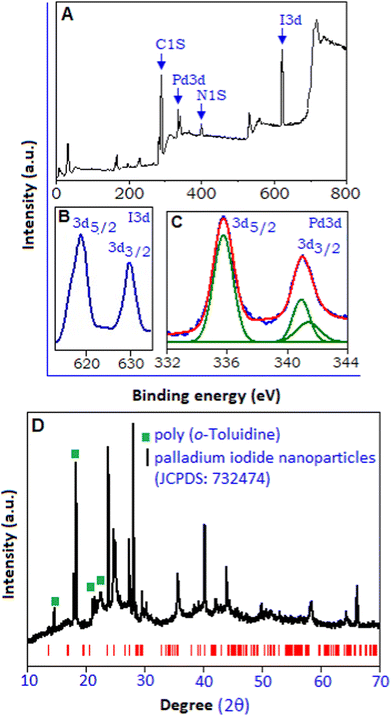
The X-ray photoelectron spectroscopy (XPS) analysis was also implemented to explore the chemical composition and the various electronic states of palladium iodide based hybrid system. The overall survey spectrum is represented in Fig. 2A, which indicates the presence of C, N, I and Pd within the sample. The high resolution I 3d spectrum, Fig. 2B, shows core level spectra for I 3d3/2 and I 3d5/2 peaks with the binding energy of 630.45 and 618.8 eV, respectively.27 The high resolution Pd 3d spectrum, Fig. 2C, shows a broad doublet spectrum within the range from 333.0 to 343.0 eV, with the peaks positioned at 335.7 and 340.9 eV, corresponding to Pd 3d5/2 and Pd 3d3/2 states, respectively, originating from the spin–orbital splitting. Palladium was observed in its various oxidation states, including the metallic form of palladium, Pd(0), with the binding energy value of 335.1 eV28 and Pd(II) with the binding energy value of 336.5 eV.29 In the present sample, polymer stabilized palladium iodide, the XPS spectrum exhibited a single symmetric peak at 335.7 eV, which corroborates with the Pd(I) state.30 The de-convolution of the peak, responsible for the Pd 3d3/2 state, resulted in two peaks with the binding energy values of 340.9 and 341.35 eV. The relatively smaller peak at 341.35 eV related to Pd(II)31 originating from un-reacted K2PdCl4. As the TEM image shows no evidence of formation of metallic palladium, the peak with the binding energy value of 340.9 eV can be considered for the Pd(I) state. The binding energy peak responsible for metallic palladium for the Pd 3d3/2 state appears at 339.2 eV.31 The X-ray diffraction pattern of poly(o-toluidine) stabilized palladium iodide nanoparticles, Fig. 2D, within the range (2θ) from 10° to 70°, exhibits a high intensity peak at 18.4° (130 plane) and low intensity peaks at 14.2° (110 plane), 21.4° (111 plane) and 21.9° (![[1 with combining macron]](https://www.rsc.org/images/entities/char_0031_0304.gif) 31 plane), which correspond to the polymeric form of o-toluidine, marked with the green symbol.32 The strong intensity of the peaks revealed the semi-crystalline nature of the polymer. The other intense peaks (below 30°) positioned at 23.5° (111 plane) and 27.8° (200 plane) validate the formation of nano-crystalline palladium iodide particles along the preferred direction. A similar diffraction pattern has been reported in the sub-stoichiometric oxidation state of palladium.33,34 Towards a high angle, above 30°, the peaks positioned at 35.5°, 40.2°, 43.7°, 49.8°, 57.8° and 65.8° are matched according to the monoclinic structure (space group P21/C) of the palladium iodide system (JCPDS: 732474, red colour bar) with lattice parameters of a = 6.69 Å, b = 8.60 Å, c = 6.87 Å and β = 103.50°.35
31 plane), which correspond to the polymeric form of o-toluidine, marked with the green symbol.32 The strong intensity of the peaks revealed the semi-crystalline nature of the polymer. The other intense peaks (below 30°) positioned at 23.5° (111 plane) and 27.8° (200 plane) validate the formation of nano-crystalline palladium iodide particles along the preferred direction. A similar diffraction pattern has been reported in the sub-stoichiometric oxidation state of palladium.33,34 Towards a high angle, above 30°, the peaks positioned at 35.5°, 40.2°, 43.7°, 49.8°, 57.8° and 65.8° are matched according to the monoclinic structure (space group P21/C) of the palladium iodide system (JCPDS: 732474, red colour bar) with lattice parameters of a = 6.69 Å, b = 8.60 Å, c = 6.87 Å and β = 103.50°.35
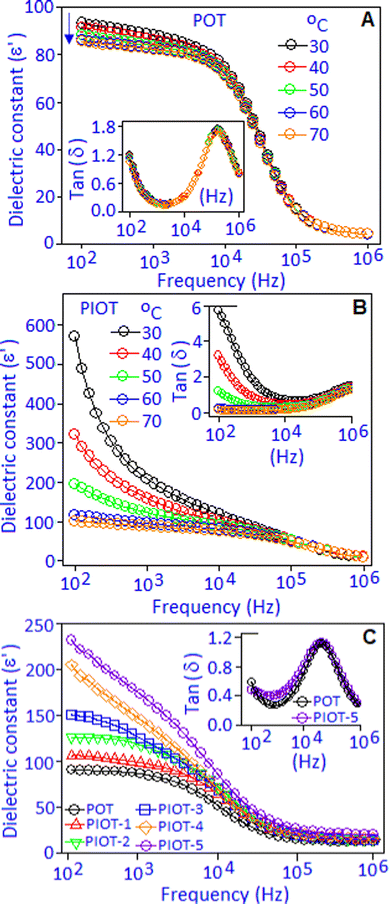
Dielectric performances in terms of dielectric constant (ε′) and dielectric loss factor (tan![[thin space (1/6-em)]](https://www.rsc.org/images/entities/char_2009.gif) δ) of Pd(I)–poly(o-toluidine), POT, Fig. 3A, and poly(o-toluidine) stabilized palladium iodide nanoparticles, PIOT, Fig. 3B, are measured within the temperature range from 30° to 70 °C and under the frequency condition from 100 Hz to 1 MHz. For the POT sample, the dielectric constant value of ∼94 was achieved at 100 Hz and maintained nearly constant up to 10 kHz, then decreased with increasing the frequency. The overall pattern of the spectrum was associated with the dipolar type of polarizability, which was developed due to the interaction between Pd(I) and the lone-pair of nitrogen in the organic molecule.36,37 At a low frequency, the quasi-dipole components have sufficient time to respond along the field direction and showed a high value of dielectric constant. At the high frequency region, the dipoles were no longer able to follow the applied frequency, which resulted in the decrease of dielectric constant values and the spectrum exhibits a saturated behaviour. The decrease of the dielectric constant value, with increasing temperature (from 30 to 70 °C), below the 10 kHz frequency region, can be explained as follows. With increasing temperature, due to the thermal agitation, the aligned dipoles reoriented and nullified the ordering effect under an applied field, which caused a decrease in the dielectric constant value, as reported in many systems.38–40 The reorientation of the dipoles under the frequency response was accompanied by a dielectric loss (tan
δ) of Pd(I)–poly(o-toluidine), POT, Fig. 3A, and poly(o-toluidine) stabilized palladium iodide nanoparticles, PIOT, Fig. 3B, are measured within the temperature range from 30° to 70 °C and under the frequency condition from 100 Hz to 1 MHz. For the POT sample, the dielectric constant value of ∼94 was achieved at 100 Hz and maintained nearly constant up to 10 kHz, then decreased with increasing the frequency. The overall pattern of the spectrum was associated with the dipolar type of polarizability, which was developed due to the interaction between Pd(I) and the lone-pair of nitrogen in the organic molecule.36,37 At a low frequency, the quasi-dipole components have sufficient time to respond along the field direction and showed a high value of dielectric constant. At the high frequency region, the dipoles were no longer able to follow the applied frequency, which resulted in the decrease of dielectric constant values and the spectrum exhibits a saturated behaviour. The decrease of the dielectric constant value, with increasing temperature (from 30 to 70 °C), below the 10 kHz frequency region, can be explained as follows. With increasing temperature, due to the thermal agitation, the aligned dipoles reoriented and nullified the ordering effect under an applied field, which caused a decrease in the dielectric constant value, as reported in many systems.38–40 The reorientation of the dipoles under the frequency response was accompanied by a dielectric loss (tan![[thin space (1/6-em)]](https://www.rsc.org/images/entities/char_2009.gif) δ) peak associated with a dipolar relaxation phenomenon in the dielectric spectrum (ε′), Fig. 3A, inset. An identical type of dielectric behaviour was observed for the polymer encapsulated palladium iodide nanoparticles, Fig. 3B. The maximum dielectric constant (ε′) value of ∼595 was achieved at 100 Hz at 30 °C. With increasing temperature, the ε′ values were decreased and attained a stable behaviour at higher temperature (70 °C). At ambient temperature (30 °C), the higher value of dielectric constant of the PIOT, which is nearly 6 orders of magnitude higher compared with that of POT, can be explained based on the generation of stable dipoles due to the formation of palladium iodide (palladium cation and iodide anion). These localized dipoles responded under an applied field and contributed to the dielectric constant value. With an increase in temperature, the thermal agitation of the molecules created the randomness in their alignment that reduced the polarisation and consequently reduced the dielectric constant value. The tan
δ) peak associated with a dipolar relaxation phenomenon in the dielectric spectrum (ε′), Fig. 3A, inset. An identical type of dielectric behaviour was observed for the polymer encapsulated palladium iodide nanoparticles, Fig. 3B. The maximum dielectric constant (ε′) value of ∼595 was achieved at 100 Hz at 30 °C. With increasing temperature, the ε′ values were decreased and attained a stable behaviour at higher temperature (70 °C). At ambient temperature (30 °C), the higher value of dielectric constant of the PIOT, which is nearly 6 orders of magnitude higher compared with that of POT, can be explained based on the generation of stable dipoles due to the formation of palladium iodide (palladium cation and iodide anion). These localized dipoles responded under an applied field and contributed to the dielectric constant value. With an increase in temperature, the thermal agitation of the molecules created the randomness in their alignment that reduced the polarisation and consequently reduced the dielectric constant value. The tan![[thin space (1/6-em)]](https://www.rsc.org/images/entities/char_2009.gif) δ curves, Fig. 3B, inset, exhibited a dispersive behaviour at the lower frequency side, which originated due to the interfacial or space charge polarization. This space charge contribution in the low frequency range, with rising temperature, is more significant for PIOT-based devices and masks the dipolar relaxation peak. It was noticed that a higher dielectric loss was obtained toward the lower frequency region (<104 Hz). The maximum dielectric loss with the value of ∼6.0 was achieved at 30 °C under the frequency of 100 Hz, which decreases with increasing temperature. At 70 °C the device shows a minimum loss of ∼0.02, over the wide frequency ranges.
δ curves, Fig. 3B, inset, exhibited a dispersive behaviour at the lower frequency side, which originated due to the interfacial or space charge polarization. This space charge contribution in the low frequency range, with rising temperature, is more significant for PIOT-based devices and masks the dipolar relaxation peak. It was noticed that a higher dielectric loss was obtained toward the lower frequency region (<104 Hz). The maximum dielectric loss with the value of ∼6.0 was achieved at 30 °C under the frequency of 100 Hz, which decreases with increasing temperature. At 70 °C the device shows a minimum loss of ∼0.02, over the wide frequency ranges.
 | ||
| Fig. 3 Temperature dependent dielectric constant (ε′) and dielectric loss (inset) of (A) POT, (B) PIOT and (C) PIOT (1–5), recorded under the frequency range from 100 Hz to 1 MHz. | ||
The in situ formation of palladium iodide within the polymer matrix and the corresponding dielectric, electrical impedance and field-driven polarization properties were monitored by sequential addition of potassium iodide to the POT complex system. The complex material was deposited in the form of a film with a thickness of ∼100 μm on a copper disk (also acting as an electrode) using a drop and dry method. A gold electrode was deposited, using a sputter coating technique, on the top of the complex material. The potassium iodide solution (2.0 μL) with a concentration of 0.5 × 10⁻² mol dm−3 was added to the complex material (at the peripheral site of the electrode) for the electrical measurements (dielectric capacitance, electrical impedance and field induced polarization). The above-mentioned protocol was repeated five consecutive times. The 1st addition to the 5th addition of potassium iodide to the POT complex are denoted as PIOT-1, PIOT-2, PIOT-3, PIOT-4 and PIOT-5, respectively. The addition of potassium iodide to the POT complex resulted in the gradual increase of palladium iodide nanoparticles within the system. The dielectric constant (ε′) and dielectric loss factor (tan![[thin space (1/6-em)]](https://www.rsc.org/images/entities/char_2009.gif) δ) were measured during the in situ formation of palladium iodide nanoparticles for the PIOT-1, PIOT-2, PIOT-3, PIOT-4 and PIOT-5 samples under the frequency condition from 100 Hz to 1 MHz at 30 °C, Fig. 3C. The spectrum shows a strong frequency dispersion at a lower frequency range followed by a frequency independent region above 100 kHz. The sequential addition of potassium iodide to the POT matrix and the corresponding in situ formation of palladium iodide resulted in a stable dipole source within the system. Under the applied frequency, the newly formed dipoles created the polarized regions that were responsible for the enhancement of dielectric constant values with the sequence of PIOT-1 < PIOT-2 < PIOT-3 < PIOT-4 < PIOT-5. The dielectric constant (ε′) values were ∼100 and ∼235, for PIOT-1 and PIOT-5, respectively, at 100 Hz. The dielectric constant value decreases with an increasing frequency since the polarization factors could not follow the frequency response and saturated towards higher frequency with a reduced value. The dielectric loss factor (tan
δ) were measured during the in situ formation of palladium iodide nanoparticles for the PIOT-1, PIOT-2, PIOT-3, PIOT-4 and PIOT-5 samples under the frequency condition from 100 Hz to 1 MHz at 30 °C, Fig. 3C. The spectrum shows a strong frequency dispersion at a lower frequency range followed by a frequency independent region above 100 kHz. The sequential addition of potassium iodide to the POT matrix and the corresponding in situ formation of palladium iodide resulted in a stable dipole source within the system. Under the applied frequency, the newly formed dipoles created the polarized regions that were responsible for the enhancement of dielectric constant values with the sequence of PIOT-1 < PIOT-2 < PIOT-3 < PIOT-4 < PIOT-5. The dielectric constant (ε′) values were ∼100 and ∼235, for PIOT-1 and PIOT-5, respectively, at 100 Hz. The dielectric constant value decreases with an increasing frequency since the polarization factors could not follow the frequency response and saturated towards higher frequency with a reduced value. The dielectric loss factor (tan![[thin space (1/6-em)]](https://www.rsc.org/images/entities/char_2009.gif) δ) curves, Fig. 3C, inset, exhibited the minimum effect with the addition of potassium iodide to the POT matrix.
δ) curves, Fig. 3C, inset, exhibited the minimum effect with the addition of potassium iodide to the POT matrix.
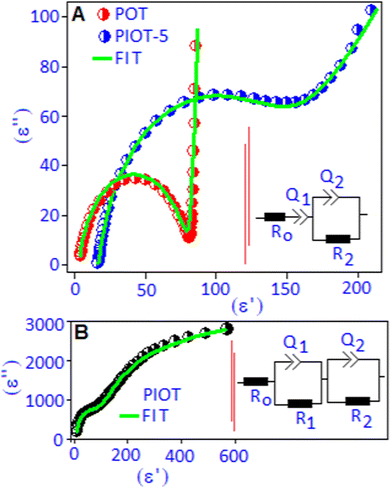
The Cole–Cole plots (in a complex-plane diagram) were obtained by separating the real (ε′) and imaginary (ε′′) parts of the dielectric constant of the POT, PIOT-5 and PIOT samples at 30 °C, Fig. 4(A and B). The Cole–Cole plot for the POT complex exhibited a semi-circular arc at the high frequency region followed by a perpendicular straight line at the low frequency region. The low frequency part is due to the accumulation of trapped charges along the border of the POT system, between Pd(I) and the lone pair of nitrogen,41,42 whereas the semicircular arc is a signature of the relaxation for the bound charges, originating due to the dipolar type of interaction between Pd(I) and the lone pair of nitrogen in the polymer complex. For the PIOT-5 sample, the semicircular arc was broadened and tilted towards a lower frequency region, which indicates the distribution of relaxation times of the dipoles due to in situ formed palladium iodide. This also validates a non-Debye type of dipolar relaxation process in the system. Based on the above results we proposed an equivalent electrical circuit to describe the experimental Cole–Cole curves. The equivalent circuit consisting of a parallel R2Q2 circuit in combination with a capacitor (Q1) and a resistance (R0) in series is shown in Fig. 4A, inset. The constant phase element (Q) can be defined as a depressed semicircle via the amplitude and the phase factor (ϕ = α × 90°) and the R0 is the contact resistance. The use of single Q1 in series with R0 was used to correlate the low frequency dispersion behaviour in the Cole–Cole plots. For the PIOT sample, two semicircular types of arcs are noticed where the larger semi-circular arc at the lower frequency region is associated with the boundary contribution of the polymer functionalized palladium iodide nanoparticle. Another semicircular arc, at the higher frequency region, originated due to the formation of palladium iodide nanoparticles with stable dipoles (palladium cation and iodide anion). The Cole–Cole plot is fitted with two parallel RQ (R1Q1 and R2Q2) circuits in series, Fig. 4B, inset. The overall fitting parameters, extracted from the equivalent circuits, are listed in Table S1 (ESI†). The sharp rise in the series resistance (R0) value for the PIOT-5 device is due to the formation of palladium iodide particles that create local resistance accompanied with the increase of the space charge effect at the material–electrode interfaces. The formation of polymer encapsulated stable dipoles is responsible for the higher values of resistances (R1 and R2) and grain boundary capacitance (Q2). High capacitance values (Q1 and Q2) suggested a superior charge storage ability of the PIOT sample. To validate the above aspect of the equivalent circuit of these systems, the non-Debye relaxation was further investigated in terms of frequency dependent modified Cole–Cole relationship as discussed with eqn (S2) (ESI†). The real part (ε′) of the dielectric constant as a function of frequency was fitted using eqn (S2) (ESI†) and is illustrated in Fig. S2 (ESI†). The extracted non-Debye ‘n’ parameters (n = 1 − α) are 0.90, 0.89 and 0.87 for POT, PIOT-5 and PIOT, respectively, which are in accordance with the values observed in the equivalent circuit model.
 | ||
| Fig. 4 Cole–Cole plot, in a complex plane, for (A) POT and PIOT-5, and (B) PIOT. All the plots are fitted with the equivalent circuit model (inset). | ||
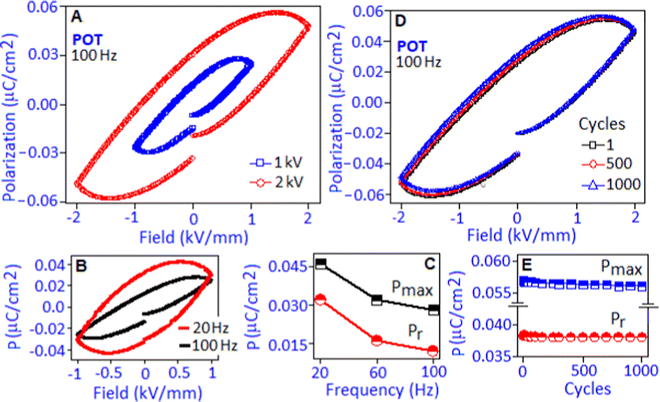
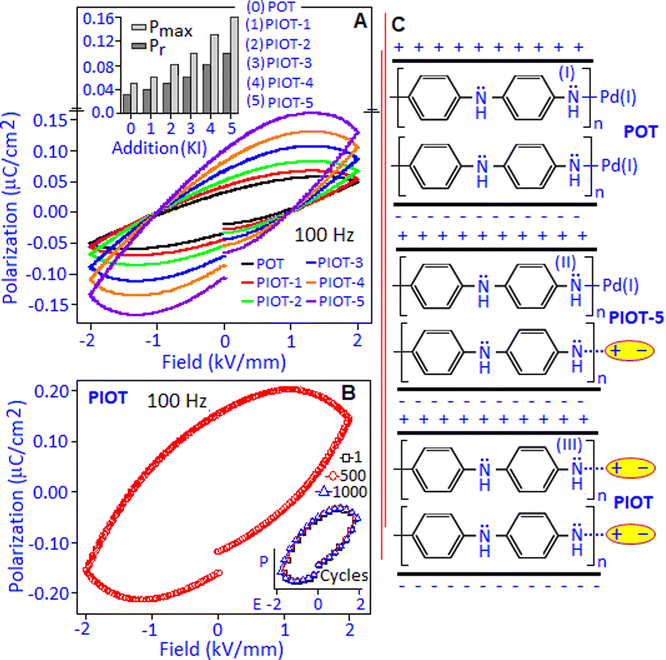
The electric field-driven polarization (P–E) hysteresis loop of the POT sample was measured under 1 kV mm−1 and 2 kV mm−1 field conditions at 100 Hz, Fig. 5A. A maximum polarization (Pmax) value of ∼0.056 μC cm−2 was achieved under 2 kV mm−1. The origin of the hysteresis pattern of the POT system was due to the dipolar type of interaction between Pd(I) and the lone pair of nitrogen in the polymer complex that developed a high density of localized charges. An electrical breakdown was observed in the PIOT based device at 2.2 kV mm−1 and has been illustrated in Fig. S3 (ESI†).
The unsaturated shape of the hysteresis loop, at the higher field, revealed the contribution of the space charge polarization process.43 The contribution of space charge polarization was more significant under the lower frequency condition that resulted in an elliptical shape of the hysteresis loop, Fig. 5B (P–E hysteresis loop obtained under the frequency of 20 and 100 Hz). At a lower frequency, the space charge carriers have sufficient response time to align along the field direction and are able to increase the polarization value and the area under the loop.44 The variation of maximum polarization (Pmax) and remnant polarization (Pr) values with respect to frequency (for 20, 60 and 100 Hz) is represented in Fig. 5C. The polarization stability of the POT was investigated under 2 kV mm−1 field conditions for 1, 500 and 1000 cycles, Fig. 5D. The hysteresis loop, Fig. 5E, exhibited a fatigue-free behaviour with stable Pmax and Pr values of ∼0.057 μC cm−2 and ∼0.038 μC cm−2, respectively, indicating no increment of leakage current and device degradation during the cycling process.
A field induced polarization study was performed to detect the electrical response of the in situ formed palladium iodide nanoparticles within the polymer matrix (PIOT-1, PIOT-2, PIOT-3, PIOT-4 and PIOT-5) during the chemical reaction between POT and potassium iodide. The systematic rise in the polarization hysteresis values was noticed due to the gradual increase in palladium iodide concentration and was simultaneously measured under the electrical field of 2 kV mm−1 at 100 Hz, Fig. 6A. The increment of the polarization values was associated with the formation of fresh dipoles during each addition of potassium iodide to the POT. The histogram, Fig. 6A inset, represents the maximum polarization (Pmax) and the remnant polarization (Pr) as a function of palladium iodide nanoparticle formation. The increment of Pmax and Pr for PIOT-5 was found to be nearly 3 orders of higher magnitude than for the POT system. The regional formation of palladium iodide nanoparticles due the consecutive addition of potassium iodide to the POT triggered the increase of local dipoles that registered as the elliptical-shaped P–E loop, associated with the structural defects. The accumulation of defects leads to space charge contribution under an applied field.45,46Fig. 6B exhibits the field induced polarization behaviour of the PIOT system with the maximum polarization and the remnant polarization values of ∼0.20 μC cm−2 and ∼0.145 μC cm−2, respectively. The stability of the PIOT-based device was tested for 103 switching cycles under 100 Hz frequency conditions and the device retained the matching Pmax and Pr values over the repeated cycles. The loop pattern is displayed in Fig. 6B, inset. The mechanism of dipole formation and field interaction for POT, PIOT-5 and PIOT samples, sandwiched between the electrodes with opposite polarity, is schematically represented in Fig. 6C. For POT, the weak dipole between Pd(I) and the lone pair of nitrogen interacted with the field, Fig. 6C (I). For PIOT-5, Fig. 6C (II), in addition to the above interaction, the in situ formed palladium iodide particles with the stable dipole interacted with the field whereas in the PIOT sample, Fig. 6C (III), the stable dipoles of palladium iodide nanoparticles are the major contributor that interact with the field.
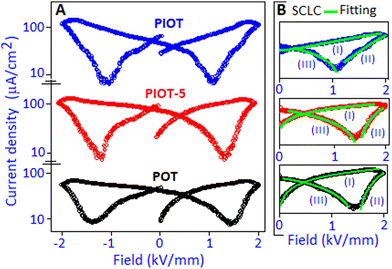
The space charge contribution of the devices was further investigated from the polarization-field (P–E) characteristic graph by converting to current density (J) as a function of field (E) representation. In the J–E representation (semi-log scale), a non-linear response was observed for the POT, PIOT-5 and PIOT device systems, Fig. 7A. Among the various models, the space charge limited conduction (SCLC) mechanism (J ∼ E,α where α is a non-linear coefficient) is widely used to describe the field dependent carrier response in many organic and inorganic dielectric materials.46–50 In the present systems (POT, PIOT-5 and PIOT), we identified three different regions (demarked as I, II and III), in the J–E plots, for forward and reverse bias conditions, Fig. 7B, and to avoid the replication, we have considered only the positive direction of the applied field (0–2 kV mm−1). For all three samples, a steady increase in current density, region (I), was observed and the space charge limited conduction mechanism was followed with the ‘α’ values of ∼1.5, 1.6 and ∼2.2, for POT, PIOT-5 and PIOT, respectively. For the above region, with the gradual increase of voltage the current density (J) values were also increased and reached ∼41.7, ∼109.5 and ∼175.1 μA cm−2 (in linear scale) for POT, PIOT-3 and PIOT, respectively. The high current density values for PIOT and PIOT-5 are due to the formation of palladium iodide nanoparticles with stable dipoles, acting as the centre of trapped charges that generate high space charge in the system. In the POT based device, the low current density value indicates less accumulation of trapped charges. The region (II) was followed by the SCLC mechanism due to the conductive behaviour of the device and the ‘α’ values were obtained in the range from ∼2.2 to ∼4.8, for all three samples. Under reverse bias, the detrapping process of the charge carriers, for all three samples, was also followed by the SCLC mechanism with the ‘α’ values ranging from ∼1.2 to ∼1.8, (region III). The ‘α’ values for three regions for all the samples are available in the ESI† (Table S2). The asymmetrical space-charge and facile detrapping process manifested a peak shift in the J–E curve toward a low field direction in the PIOT-based device, Fig. 7A.
Conclusion
In this manuscript, a wet chemical method has been reported for the synthesis of polymer stabilized ultrafine palladium iodide particles. During the reaction between potassium tetrachloro palladate and o-toluidine, a complex system of Pd(I)–poly(o-toluidine) was formed, where the palladium precursor acted as an oxidizing agent. The addition of potassium iodide to the complex material resulted in the formation of poly(o-toluidine) stabilized palladium iodide nanoparticles. For the Pd(I)–poly(o-toluidine) sample, the maximum dielectric constant value of ∼94 was achieved at 100 Hz, originating due to the dipolar type of interaction between Pd(I) and the lone-pair of nitrogen of the organic molecule. For the polymer encapsulated palladium iodide nanoparticles, the maximum dielectric constant value of ∼595 was achieved at 100 Hz. The high dielectric constant value was mainly responsible for the generation of palladium iodide with stable dipoles. The electric field-driven polarization hysteresis loop exhibited a fatigue-free behaviour for 103 cycles with the maximum polarization and remnant polarization values of ∼0.057 μC cm−2 and ∼0.038 μC cm−2, respectively, for Pd(I)–poly(o-toluidine) under 2 kV mm−1 field conditions at 100 Hz. Polymer stabilized palladium iodide nanoparticles exhibited maximum polarization and the remnant polarization values of ∼0.20 μC cm−2 and ∼0.145 μC cm−2 respectively, under the same field and frequency conditions. The dielectric and field induced polarization performance of the in situ synthesized palladium iodide nanoparticles within the polymer matrix was also studied. The regional formation of palladium iodide nanoparticles due to the consecutive addition of potassium iodide to the polymer matrix triggered the increase of local dipoles, which was reflected as a gradual increase of dielectric constant and maximum polarization values. It is important to mention that the current study has the potential to contribute to the solid-state sensing application.Conflicts of interest
The authors declare no competing financial interest.Acknowledgements
This study was financially supported by the Faculty of Science, University of Johannesburg.References
- N. Angastiniotis, S. Christopoulos, K. Petallidou, A. Efstathiou, A. Othonos and L. Koutsokeras, Sci. Rep., 2021, 11, 16009 Search PubMed.
- M. Rahman, M. Hoque, G. Rahman, M. Gafur, R. Khan and M. Hossain, Results Phys., 2019, 13, 10226–10233 Search PubMed.
- K. Mallick, M. Witcomb, R. Erasmus and A. Strydom, J. Appl. Phys., 2009, 106, 074303 Search PubMed.
- D. Nandi, A. Taher, R. Islam, M. Choudhary, S. Siwal and K. Mallick, Sci. Rep., 2016, 6, 33025 Search PubMed.
- S. Siva Prasanna, K. Balaji, S. Pandey and S. Rana, in Nanomaterials and Polymer Nanocomposites, ed. N. Karak, Elsevier, 2019, pp. 123–144, ISBN: 978-0-12-814615-6 Search PubMed.
- W. Zhu, Y. Cheng, C. Wang, N. Pinna and X. Lu, Nanoscale, 2021, 13, 9112–9146 Search PubMed.
- A. Pramanik, D. Laha, D. Bhattacharya, P. Pramanik and P. Karmakar, Colloids Surf., B, 2012, 96, 50–55 Search PubMed.
- N. Myeni, S. Ghosh, V. Perla and K. Mallick, Mater. Res. Express, 2019, 6, 1050a7 Search PubMed.
- N. Leblanc, N. Mercier, L. Zorina, S. Simonov, P. Senzier and C. Pasquier, J. Am. Chem. Soc., 2011, 133, 14924–14927 Search PubMed.
- D. B. Mitzi and P. Brock, Inorg. Chem., 2001, 40, 2096–2104 Search PubMed.
- S. Ghosh, V. Perla and K. Mallick, Phys. Chem. Chem. Phys., 2020, 2, 3345–3351 Search PubMed.
- V. Perla, S. Ghosh and K. Mallick, J. Mater. Sci.: Mater. Electron., 2020, 31, 22652–22661 Search PubMed.
- R. E. Brandt, R. C. Kurchin, R. L. Hoye, J. R. Poindexter, M. W. Wilson, S. Sulekar, F. Lenahan, P. X. Yen, V. Stevanovic, J. C. Nino, M. G. Bawendi and T. Buonassisi, J. Phys. Chem. Lett., 2015, 6, 4297–4302 Search PubMed.
- S. M. Jain, T. Edvinsson and J. R. Durrant, Commun. Chem., 2019, 2, 91 Search PubMed.
- M. Aksoy, H. Kilic, B. Nişanc and Ö. Metin, Inorg. Chem. Front., 2021, 8, 499–545 Search PubMed.
- M. Wang, X. Qin, K. Jiang, Y. Dong, M. Shao and W. Cai, J. Phys. Chem. C, 2017, 121, 3416–3423 Search PubMed.
- S. Siwal, M. Choudhary, S. Mpelane, R. Brink and K. Mallick, RSC Adv., 2016, 6, 47212–47219 Search PubMed.
- B. Gabriele, L. Veltri, R. Mancuso, G. Salerno, S. Maggi and B. Aresta, J. Org. Chem., 2012, 77, 4005–4016 Search PubMed.
- L. Veltri, S. Giofrè, P. Devo, R. Romeo, A. Dobbs and B. Gabriele, J. Org. Chem., 2018, 83, 1680–1685 Search PubMed.
- M. Choudhary, R. Islam, M. Witcomb and K. Mallick, Dalton Trans., 2014, 43, 6396–6405 Search PubMed.
- S. Mahato, R. Islam, C. Acharya, M. Witcomb and K. Mallick, Chem. Cat. Chem., 2014, 6, 1419–1426 Search PubMed.
- K. Mallick, M. Witcomb, M. Scurrell and A. Strydom, J. Phys. D: Appl. Phys., 2009, 42, 095409 Search PubMed.
- K. Mallick, M. Witcomb, A. Dinsmore and M. Scurrell, Langmuir, 2005, 21, 7964–7967 Search PubMed.
- A. Taher, D. Nandi, R. Islam, M. Choudhary and K. Mallick, RSC Adv., 2015, 5, 47275–47283 Search PubMed.
- O. Shishilov, T. Stromnova, J. Cámpora, P. Palma, M. Á. Cartes and L. M. Prieto, Dalton Trans., 2009, 6626–6633 Search PubMed.
- M. MacInnis, J. DeMott, E. Zolnhofer, J. Zhou, K. Meyer, R. Hughes and O. Ozerov, Chem., 2016, 1, 902–920 Search PubMed.
- A. Liu, H. Zhu, W. Park, S. Kang, Y. Xu, M. Kim and Y. Noh, Adv. Mater., 2018, 30, 1802379 Search PubMed.
- B. Mao, R. Chang, S. Lee, S. Axnanda, E. Crumlin, M. Grass, S. Wang, S. Vajda and Z. Liu, J. Chem. Phys., 2013, 138, 214304 Search PubMed.
- J. Parka, S. Wona, J. Maob, I. Kwakb and Y. Yuna, J. Hazard. Mater., 2010, 181, 794–800 Search PubMed.
- R. Rao, R. Blume, T. Hansen, E. Fuentes, K. Dreyer, S. Moldovan, O. Ersen, D. Hibbitts, Y. Chabal, R. Schlögl and J. Tessonnier, Nat. Commun., 2017, 8, 340 Search PubMed.
- E. Coronado, A. Ribera, J. Garcia-Martinez, N. Linares and L. Liz-Marzánc, J. Mater. Chem., 2008, 18, 5682–5688 Search PubMed.
- T. Zhou, X. Xie, J. Cai, L. Yin and W. Ruan, Polym. Bull., 2016, 73, 621–630 Search PubMed.
- Z. Hamida, J. Barbier, S. Labruquere and D. Duprez, Appl. Catal., B, 2001, 29, 195–205 Search PubMed.
- N. Rameau, B. Russo, S. Mangematin, C. Pinel and L. Djakovitch, Appl. Catal., A, 2018, 560, 132–143 Search PubMed.
- L. Wang, L. Wang, E. Tan, L. Li, L. Guo and X. Han, J. Mater. Chem., 2011, 21, 2369–2373 Search PubMed.
- J. Yuan, S. Yao and P. Poulin, Dielectric Constant of Polymer Composites and the Routes to High-k or Low-k Nanocomposite Materials, in Polymer Nanocomposites, ed. X. Huang and C. Zhi, Springer, 2016, pp. 3–28, ISBN 978-3-319-28236-7 Search PubMed.
- T. Zhu, Q. Yu, W. Zheng, R. Bei, W. Wang, M. Wu, S. Liu, Z. Chi, Y. Zhang and J. Xu, Polym. Chem., 2021, 12, 2481–2489 Search PubMed.
- M. Gabal, A. Juaid, S. Rashed, M. Hussein, Y. Angari and A. Saeed, J. Inorg. Organomet. Polym. Mater., 2019, 29, 2197–2213 Search PubMed.
- M. B. Mahamed and K. E. Sayed, Compos. B. Eng., 2014, 56, 270–278 Search PubMed.
- A. Arya and A. Sharma, J. Phys.: Condens. Matte., 2018, 30, 165402 Search PubMed.
- R. Schmidt, P. Mayrhofer, U. Schmid and A. Bittner, J. Appl. Phys., 2019, 125, 084501 Search PubMed.
- M. M. Ahmad and K. Yamada, Appl. Phys. Lett., 2007, 91, 052912 Search PubMed.
- L. Jin, F. Li and S. Zhang, J. Am. Ceram. Soc., 2014, 97, 1–27 Search PubMed.
- X. Chen, X. Dong, F. Cao, J. Wang and G. Wang, J. Am. Ceram. Soc., 2014, 97, 213–219 Search PubMed.
- S. Li, D. Zhou, Z. Shi, M. Hoffmann, T. Mikolajick and U. Schroeder, Adv. Electron. Mater., 2020, 11, 2000264 Search PubMed.
- Q. D. Ling, D. J. Liaw, C. X. Zhu, D. S. Chan, E. T. Kang and K. G. Neoh, Prog. Polym. Sci., 2008, 33, 917–978 Search PubMed.
- H. Hu and S. Krupanidhi, J. Mater. Res., 1994, 9, 1484–1498 Search PubMed.
- S. Jain, A. Kapoor, W. Geens, J. Poortmans, R. Mertens and M. Willander, J. Appl. Phys., 2002, 92, 3752 Search PubMed.
- A. Carbone, C. Pennetta and L. Reggiani, Appl. Phys. Lett., 2009, 95, 233303 Search PubMed.
- V. M. Corre, E. A. Duijnstee, O. E. Tambouli, J. M. Ball, H. J. Snaith, J. Lim and L. J. Koster, ACS Energy Lett., 2021, 6, 1087–1094 Search PubMed.
Footnote |
| † Electronic supplementary information (ESI) available. See DOI: https://doi.org/10.1039/d2ma00409g |
| This journal is © The Royal Society of Chemistry 2022 |

