 Open Access Article
Fabrication of AgCu/TiO2 nanoparticle-based sensors for selective detection of xylene vapor†
Popoti J.
Maake
ab,
Teboho P.
Mokoena
ch,
Amogelang S.
Bolokang
d,
Nomso
Hintsho-Mbita
e,
James
Tshilongo
 f,
Franscious R.
Cummings
g,
Hendrik C.
Swart
 c,
Emmanuel I.
Iwuoha
b and
David E.
Motaung
 *c
*c
aDST/CSIR National Centre for Nanostructured Materials, Council for Scientific Industrial Research, Pretoria 0001, South Africa
bSensor Lab, Chemistry Department, University of the Western Cape, Private Bag X17, Bellville 7535, South Africa
cDepartment of Physics, University of the Free State, P.O. Box 339, Bloemfontein ZA9300, South Africa. E-mail: MotaungDE@ufs.ac.za
dCouncil for Scientific Industrial Research, Materials Science and Manufacturing, Advanced Materials and Engineering, Meiring Naude Road, P. O. Box 395, Pretoria, South Africa
eDepartment of Chemistry, University of Limpopo, Private Bag X1106, Sovenga, 0727, South Africa
fMintek, Analytical Service Division, 200 Malibongwe Drive, Randburg 2194, South Africa
gElectron Microscopy Unit, University of the Western Cape, Bellville, 7535, South Africa
hDepartment of Physics, Sefako Makgatho Health Sciences University, Ga-Rankuwa, South Africa
First published on 20th July 2022
Abstract
The design and fabrication of innovative nanostructured materials that could display improved sensitivity, selectivity, and rapid response/recovery characteristics still present significant scientific challenges. Herein we report the timely selective detection of xylene vapour in benzene, toluene, ethylbenzene (BTE) and acetone vapours at low operating temperatures using an n-type AgCu/TiO2 nanoparticle-based sensor. Switching from p-type to n-type conductivity was observed at higher AgCu loadings. The findings showed that sensor switching was not temperature- or gas-dependent. Among the AgCu loaded on TiO2 nanoparticles, n-type 0.5% AgCu loaded on TiO2 displayed a remarkable response (Rg/Ra ≈ 33.2) toward xylene vapour at 150 °C. The sensor exhibited superior selectivity, prompt response/recovery swiftness and good repeatability and stability towards xylene vapour in dry air and 40% relative humidity. This response was superior compared to the individual loading of 0.5 mol% Cu or Ag on a TiO2 based sensor, validating that the contribution of both Ag and Cu had a substantial effect on the spill-over effect mechanism. Additionally, a high loading of 1.0 mol% AgCu resulted in a poor sensing performance. The superior xylene gas sensing characteristics were attributed to the catalytic activity and point defects induced by the loading of AgCu in TiO2. The underlying mechanism for the improved sensing characteristics can be predominantly ascribed to the strong synergistic catalytic influence of the loading of n-type AgCu/TiO2 nanoparticles, which reduced the activation energy and accelerated the reaction of xylene molecules and vigorous oxygen species. These findings could disclose a new potential in the fabrication of reliable sensors for portable devices for indoor/outdoor air quality monitoring.
1. Introduction
The world today is facing serious health risks from global warming because of air pollutants, such as carbon dioxide (CO2), and hydrocarbons, such as benzene, toluene, and xylene (BTX) emitted from industries and automotive vehicles.1,2 These pollutants, if inhaled in high concentrations cause neurotoxicity that results in fatality.1,2 Thus, the timely detection of such pollutants is of immense importance and requires gas-sensing devices that regulate air quality in industrial emissions and combustible developments. The fundamental characteristics of gas sensors are better sensitivity and selectivity for specific types of gases which provide short response-recovery times at low temperatures for the early detection of gases to prevent fatality.3Among the semiconductor metal oxides (SMOs), n-type titanium dioxide (TiO2), which possesses a widespread optical band gap of ∼3.6 eV at 300 K, has drawn significant attention for possible commercial gas sensor applications, due to its superior sensitivity, low cost, and low toxicity.4 Nonetheless, the shortcomings of pristine TiO2 have fundamentally restricted its real-world applications in the market because of its limited selectivity and high operational temperature. Studies have revealed that doping TiO2 with noble metals (e.g., Pt, Au, Pd, and Ag) or transition metals (e.g., Cu, and Zn) enhances the sensing characteristics, as they can regulate the morphology, enable surface reactions, transform the space charge distribution, and hence, advance the gas sensing characteristics.5–8 Lupan et al.9 reported the role of film thickness and surface functionalization using noble metal nanoclusters on the gas sensing performance of ultra-thin TiO2 layers. Their TiO2 ultra-thin films exhibited superior selectivity toward hydrogen gas, without being reliant on their thickness. Panayotov et al.10 studied the spillover of atomic hydrogen from Au particles supported on TiO2. Infrared spectroscopy was used to probe the electrons trapped in the TiO2 lattice created by atomic H delivered from Au.
Studies have shown that heterojunctions between various SMO nanostructures, particularly those derived from ultrathin films with mixed phases, enhance the sensing response. Thus, Lupan et al.11,12 demonstrated a novel approach for controlling the sensing properties of TiO2/CuO/Cu2O mixed oxide heterostructure based sensors. Functionalization with Pd-nanoclusters, selectivity shifted from alcohols to hydrogen, led to an exceptionally low power consumption.11
Wang et al.13 synthesized CoTiO3/TiO2 and Pd-doped CoTiO3/TiO2 (Pd-CTT) nanocomposites using a hydrothermal approach. Their Pd-CTT-based sensor demonstrated a superior response towards 50 ppm benzene and a low limit of detection, which was around 100 ppb at 25 °C. This excellent performance toward benzene vapour was associated with the catalytic influence of Pd and the creation of a p–n CoTiO3/TiO2 heterojunction. Au–ZnO, WSe2, and Au–ZnO/exfoliated WSe2 nanocomposites were fabricated by Zhang et al.14 The authors observed that among the fabricated sensors, Au–ZnO/exfoliated WSe2 demonstrated an excellent response towards benzene vapour at 25 °C. This improved performance was linked to the incorporation of Au nanoparticles, the formation of the ZnO/WSe2 heterojunction and improved surface area.
Studies have also reported that triboelectric nanogenerators can be utilized to construct self-powered systems, such as gas sensors, and they can also be used in a wide range of applications in various electronic devices.15–17 Thus, Wang et al.17 fabricated a Ti3C2Tx MXene/Ag-based sensor driven by a hybrid nanogenerator for the detection of ethanol vapour. The excellent selectivity towards ethanol vapour using an MXene/Ag nanocomposite-based sensor was validated using density functional theory simulations and bulk electrosensitive analyses. Remarkably, the self-powered sensors showed a higher response of 204% towards 100 ppm ethanol compared to that of a resistive sensor (8.3%). Their sensor response was 24.5 times higher in comparison to the resistive sensor. Among the noble metals, Ag has attracted much attention as it is considered a perfect candidate for commercial purposes, because of its low cost. Among the different volatile organic compounds (VOCs), benzene, toluene, ethyl-benzene, and xylene (BTEX) have exceedingly inherent cancer-causing features.9 Since BTEX is a natural component of coal and crude oil, it is released into the air via vehicle exhaust and various industrial developments, such as paints, cosmetics, glue, etc.10 Exposure to BTEX in a form of oral intake and/or skin absorption could influence nervous and blood manufacture systems.18,19 Furthermore, BTEX monitoring and detection could be profitable for agriculture because they are released from oranges at various phases of maturity (or ripening).20 Therefore, appropriate and selective detection of BTEX vapours, predominantly at minimal concentrations, is very vital for efficient farming in which capable conveyance and storage may be realized. Though several studies exist on the loading of noble metals on various SMOs,1,6–15 however, to the best of our information, no study has been conducted on the gas sensing properties of TiO2 nanoparticles loaded with AgCu nanoparticles. In the current work, we show that a higher loading of both Ag/Cu switches the conductivity of TiO2 from p-type to n-type, where such switching is not temperature or gas dependent.
Thus, in this study, we report for the first time the gas sensing characteristics of n-type Ag/Cu loaded on a TiO2 nanoparticle-based sensor for the detection of xylene vapour at a low operating temperature. The results showed an improved sensing performance toward xylene among the BTE compounds, including acetone vapour. This improvement could be due to the strong synergistic catalytic influence of the loading of n-type AgCu in the TiO2 nanoparticles, which reduced the activation energy and accelerated the reaction of xylene molecules and vigorous oxygen species.
2. Experimental procedure
2.1. Materials
All chemicals, (copper nitrate, silver nitrate (≥99.0), TiO2 P25 Degussa, and sodium hydroxide (NaOH, purity 99%)) were purchased from Sigma-Aldrich.2.2. Synthesis of TiO2 nanoparticles
Pure TiO2 nanoparticles were synthesized by dissolving approximately 2 g of TiO2 P25 Degussa in 100 ml distilled water and stirring for 2 h to obtain a homogenous mixture. The pH was maintained at 8 using an appropriate amount of NaOH solution. After stirring, the solution was added to two separate Aton Parr autoclaves and heated at 200 °C for 12 h. After the autoclave reaction, the solutions cooled down to room temperature, and the precipitates were collected and washed several times with distilled water and dried at 90 °C for 15 h. The final product was calcined at 250 °C in air for 2 h.2.3. Synthesis of AgCu loaded on TiO2 nanoparticles
The AgCu loaded on TiO2 nanoparticles (i.e., AgCu/TiO2) was synthesized by dissolving an appropriate amount of TiO2 P25 Degussa and different ratios of 0.1 and 0.5 mol% interchangeable of Ag and Cu nanoparticles and dissolved in 100 ml of distilled water and stirred for 2 h to achieve a homogenous solution. NaOH was then added to the solution to reach a pH of 8 and stirred continuously for 5 h. The solutions were added to a Teflon liner made to fit inside a stainless-steel pressure vessel for 12 h at 200 °C. Before washing the solutions, they were permitted to cool to 25 °C. Then, the filtrates were carefully washed with distilled water to eliminate impurities. The final products were dried at 90 °C for 12 h, then calcined at 250 °C in air for 2 h.2.4. Characterization
An X-ray diffractometer (Panalytical XPERT PRO PW 3040/60) equipped with a Cu monochromatic radiation source was used to examine the structures. The morphology was determined utilizing Auriga Zeiss scanning electron microscopy, attached with energy dispersive spectroscopy (EDS), which was used to probe the elemental analyses of Ag/Cu loaded in TiO2. The internal structure and high angle annular dark field-scanning transmission electron microscopy (HAADF-STEM) were probed by transmission electron microscopy, using an FEI Tecnai G2 20 twin field-emission gun TEM (FEG-TEM) at 200kV. Bright-field micrographs were collected using a parallel e-beam; dark-field micrographs were collected in scanning transmission electron microscopy (STEM) mode, with the images collected using a Fischione HAADF detector. The optical characteristics were studied using a fully automated photoluminescence (PL) imaging spectrometer with a Kimmon IK series 325 nm laser. The surface area and N2 adsorption/desorption isotherms were probed utilizing Brunauer–Emmett–Teller analysis (BET, Micromeritics TRISTAR 3000). The chemical state of pure TiO2 and AgCu/TiO2 was studied using a PHI 5000 Versaprobe-Scanning ESCA Microprobe X-ray photo-electron spectroscopy (XPS).2.5. Fabrication of gas sensor devices and characterization
The fabrication of TiO2 gas sensors was carried out according to ref. 21. Pure TiO2 and AgCu/TiO2 nanostructures were dispersed ultrasonically in ethanol (Analytical Reagent) to attain a 2.5 mol L−1 TiO2 suspension. The suspension was sonicated for 30 minutes to achieve an even paste. The paste was carefully coated onto an alumina substrate (2 mm × 0.5 mm) comprising two Pt electrodes and a microheater on its top surface and its bottom surface. The sensor resistance was measured by utilizing a KSGAS6S KENOSISTEC sensing system (see Fig. S1, ESI†). The fabricated sensors were placed in an airtight chamber and exposed to several VOCs, like benzene, ethylbenzene, toluene, xylene (BTEX), and acetone. The analyses were carried out at different temperatures in the range of 25, 100 and 150 °C. The flow rate of the gas mixture (synthetic air to the analyte gas) was upheld at 500 sccm. Furthermore, a sensing system furnished with a water bath that can generate humidity was utilized to conduct the measurements under regulated relative humidity (RH) and kept at 40%. For analyses, water was filled in the bath and the temperature was kept constant. Air moves via the bubbler, since it gets pushed to the mixing chamber, and the RH is controlled prior to being allowed to go through the sensing chamber.3. Results and discussion
Fig. 1 displays the XRD patterns of the AgCu/TiO2 nanoparticles. At the loading of 0.1 mol% of Ag and Cu, the crystallite sizes decrease, while at a higher loading of 0.5 mol%, an increase in crystallite sizes is observed (see Table S1 in the ESI†). Thus, when both Cu and Ag are added to the TiO2 surface, they may suppress the TiO2 growth rate up to an optimal concentration.22–25 Additionally, peak intensities increased with an increasing concentration of AgCu/TiO2. At the loading level of 0.1 mol% Ag 0.5 mol% Cu, no peak shifting was noted, instead the peak intensity reduced strongly. Such behaviour was also witnessed for 0.5 mol% Ag and 0.1 mol% Cu. A slight peak shift to higher angles is observed in Fig. 1b. This behaviour is quite unusual, since the peaks usually shift to lower angles with loading.24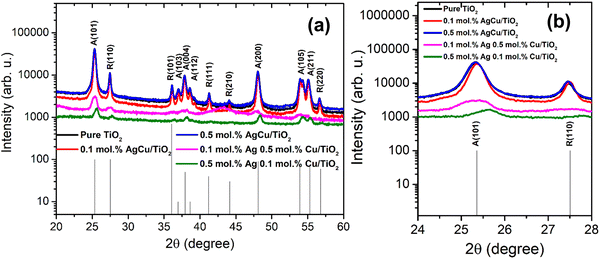 | ||
| Fig. 1 (a) XRD patterns of Ag/Cu loaded on TiO2 nanoparticles and (b) magnified patterns showing (101) and (110) peaks. | ||
The internal structure and selected area electron diffraction (SAED) analyses of the pure TiO2 and AgCu/TiO2 were accomplished as depicted in Fig. 2. All the structures displayed dislocated nanoparticle-like structures. HRTEM images showed that the pure and AgCu/TiO2 particles were spherical in shape. The size of the TiO2 particles decreased with increased doping of either the Cu or Ag on the TiO2 surface, and these findings are consistent with the XRD findings (see Fig. 2d, e, g, h, j, k, m and n). It is further observed in Fig. 2d, e, g, h, j, k, m and n that the Ag and Cu are randomly distributed on the TiO2 surface. From the HRTEM micrographs, the lattice fringes are obviously noticeable with inter planar spacings of 0.352 nm, 0.2043 nm, and 0.24 nm corresponding to (101), (200), and (111) for TiO2, and Ag in loaded AgCu, respectively.20 The SAED patterns of the pure and AgCu/TiO2 validate that the nanoparticles are polycrystalline in nature. The distinctive diffraction rings of the SAED patterns tagged with the Miller indices are displayed in Fig. 2c, f, i and o.
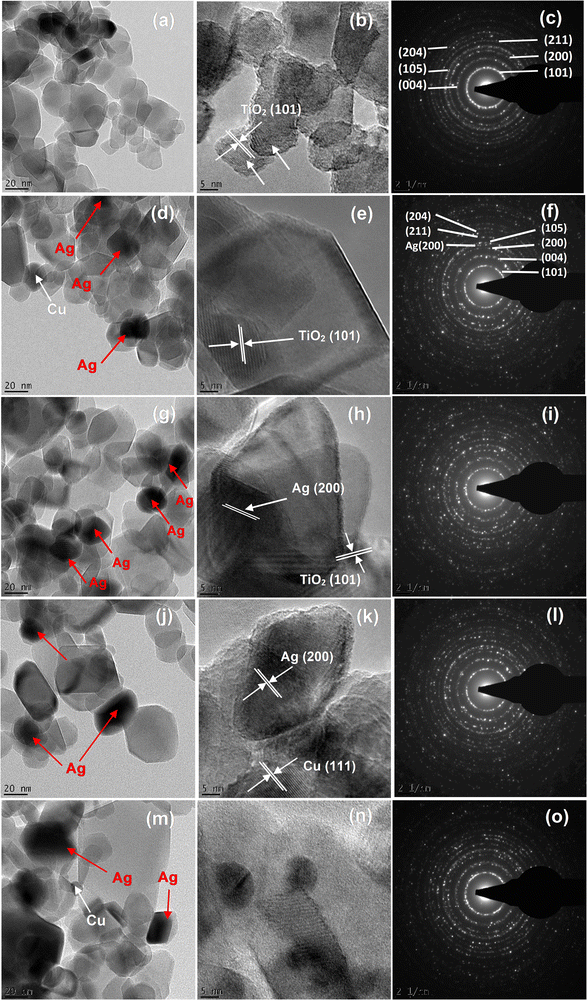 | ||
| Fig. 2 TEM images and SAED patterns of the (a–c) pure TiO2, AgCu/TiO2 nanoparticles (d–f) 0.1 mol% AgCu, (g–i) 0.5 mol% AgCu, (j–l) 0.1 mol% Ag 0.5 mol% Cu and (m–o) 0.5 mol% Ag 0.1 mol% Cu. | ||
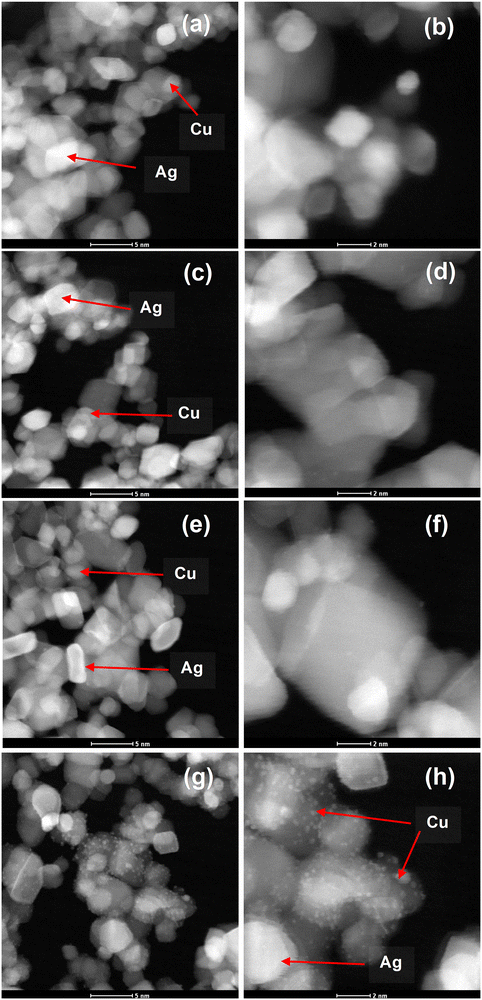
High-angle annular dark field scanning transmission electron microscopy (HAADF-STEM) was accomplished as shown in Fig. 3. The AgCu nanoparticles can be observed in STEM as bright dots (see the arrows). This is because the HAADF-STEM contrast is almost comparable to the atomic number squared, where the Ag is much heavier than the Cu and Ti, while the Cu is much heavier than Ti. It is interesting to note that at 0.5 mol% Ag 0.1 mol% Cu, the Cu nanoparticles are clearly visible and can be easily differentiated from the Ag nanoparticles. This validates that the AgCu was indeed incorporated on the TiO2 surface.
To validate the TEM micrographs, SEM analyses were performed as shown in Fig. S2 (ESI†). Surface morphology analyses also confirmed that the pure TiO2 and AgCu/TiO2 were made of spherical nanoparticles The EDX spectra shown in Fig. S3 (ESI†) indicate that only Ti, O, Ag and Cu were present on the surface. Elemental mapping also showed that the Ag and Cu were evenly dispersed on the TiO2 surface, Fig. S4 (ESI†).
To understand the influence of defects on the gas sensing characteristics, the XPS and in-situ PL measurements were conducted. In situ PL analyses were conducted at temperatures matching the operational sensor temperatures ranging from 25 to 150 °C at an excitation wavelength of 320 nm. Fig. S5 (ESI†) demonstrates the PL spectra of the pure and AgCu/TiO2 nanoparticles. The increased concentration of Ag to 0.5 mol% resulted in broad emission ranging from 1.5 to 3.5 eV. This behaviour in PL energy is possibly due to an increased defect concentration, such as oxygen vacancies (VO) and Ti3+ ions. This can be further observed in Fig. S5b and c (ESI†) in that the intensity of the peaks decreased as the PL temperature increased from 100 to 150 °C. This decrease was more significant for the samples loaded with a low concentration of Ag. Additionally, the width of the peaks became narrower with increasing PL temperature. The deconvoluted graphs using Gaussian fit illustrated four peaks centred at 3.42, 3.24, 2.99, 2.72, 2.42 and 2.0 eV (see Fig. S6, ESI†). The peaks located at 3.4 and 3.0 eV ascribed to direct electronic evolution from the bottom of the conduction band (EC) to the top of the valence band were witnessed for all the materials.26 The wide PL emission is related to the point defect growth, such as VO. The peaks positioned at 2.7 eV were associated with self-trapped excitons in the octahedral.26–28 The peaks at approximately 2.6 eV and 2.4 eV are related to shallow and deep VO correlated trap states (i.e., Ti3+ and F+ centres, respectively).27–30
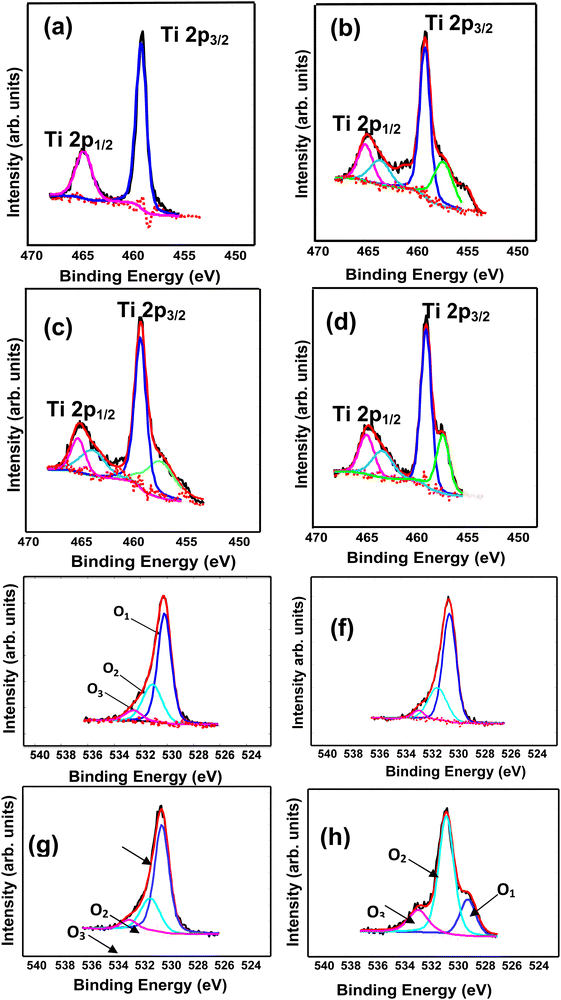
Fig. 4a–d illustrates the XPS spectra of the Ti2p peaks of the AgCu/TiO2 nanoparticles. The deconvoluted spectra of the 0.1 mol% AgCu and 0.1 mol% Ag 0.5 mol% Cu were fitted into four peaks. For the 0.1 mol% AgCu, the peaks were located at 457.8, 458.9, 464.3 and 465.2 eV, while for the 0.1 mol% Ag 0.5 mol% Cu, the peaks were located at 456.1, 458.1, 461.3, and 464.1 eV. The peaks at approximately 458 and 463 eV are associated with Ti4+ 2p3/2 and Ti3+ 2p1/2.31,32 Whereas, for the 0.5 mol% Ag 0.1 mol% Cu and 0.5 mol% AgCu, the spectra were fitted into five peaks. The 0.5 mol% AgCu spectrum shows a strong shoulder at lower binding energy, probably induced by a higher loading concentration of Ag and Cu, resulting to defects (Ti3+) and this is consistent with the PL analyses. This behaviour was previously reported by Tshabalala et al.32
Fig. 4e–h illustrate the high resolution XPS spectra of the O 1s of AgCu/TiO2 nanoparticles. The deconvoluted spectra of the 0.1 mol% AgCu, 0.1 mol% Ag 0.5 mol% Cu, and 0.5 mol% Ag 0.1 mol% Cu loaded TiO2 nanoparticles in Fig. 9e–h show three peaks, i.e., O1 and O2 and O3 centred at 529.8, 53 and 531.3 eV ascribed to Ti4+ and O2−ions in the TiO2 crystal lattice33–35 and Ti3+ oxygen vacancies on the surface. It is worth pointing out that the 0.5 mol% AgCu/TiO2 shows a broad peak, with a tail (shoulder) extending towards higher energies in comparison to its counterparts, which displays three deconvoluted peaks at 528.5, 530.6 and 531.8 eV. In general, O2− is thought to be stable, which may not contribute to an improved sensing response, whereas the O− and Ti3+ oxygen vacancy components contain a considerable influence in the gas sensing characteristics.36,37 Thus, the relative concentration of the Ti3+ oxygen vacancy constituent for the 0.5 mol% AgCu/TiO2 shows a maximum value of 63.9%, as listed in Table S2, ESI†), validating the reduction of Ti4+ to Ti3+.
The peaks in the XPS spectra of Cu2p were fitted using the Gaussian function, as shown in Fig. S7a–d (ESI†). The Cu 2p3/2 profiles of the 0.1 mol% Ag/Cu and 0.5 mol% Ag/0.1 mol% Cu of the AgCu/TiO2 nanoparticles in Fig. 10a and b display minimal peaks located at 952.6 eV and 952.9 eV, respectively. While those of the Cu 2p1/2 peak for both samples display peaks at 932.6 eV and 933.1 eV, respectively. At a higher doping concentration of Cu (i.e., 0.1 mol% Ag 0.5 mol% Cu and 0.5 mol% AgCu/TiO2 nanoparticles), the intensity of both Cu 2p peaks increased.
The XPS Ag 3d peaks of the AgCu/TiO2 nanoparticles are shown in Fig. S7e–h (ESI†). High resolution XPS results confirmed the incorporation of Ag into the TiO2 surface. However, at lower loading, the intensities of the peaks linked to Ag 3d3/2 and Ag 3d5/2 are very minimal and this observation is similar to that of Cu in Fig. S7a and b (ESI†) at lower loading concentrations. In addition, the higher Ag loading clearly shows that the peaks of Ag are asymmetric. Thus, higher metal loadings contain larger amounts of Ag+ and Cu2+, which undergo self-reduction.
To understand the sensing performance, we conducted nitrogen adsorption analysis as depicted in Fig. 5. The N2 adsorption–desorption isotherms of pure and loaded on TiO2 materials indicated that the materials were mesoporous based on IUPAC classification type V. The pure and loaded TiO2 materials presented an H3 type hysteresis loop related with slit-shaped pores. The surface area of the loaded nanoparticles was 34.9736 ± 0.0458 m2 g−1 for 0.1 mol% AgCu, 34.2224 ± 0.1629 m2 g−1 for 0.1 mol% Ag 0.5 mol% Cu, 36.1635 ± 0.1917 m2 g−1 for 0.5 mol% Ag 0.1 mol% Cu, 32.0335 ± 0.3842 m2 g−1 0.5 mol% Ag Cu. Additionally, the pore volume of various contents analysed by the Barret–Joyner–Halenda (BJH) method were 0.243931 cm3 g−1, 0.295374 cm3 g−1, 0.245314 cm3 g−1 and 0.291393 cm3 g−1 for 0.1 mol% AgCu, 0.1 mol% Ag 0.5 mol% Cu, 0.5 mol% Ag 0.1 mol% Cu, and 0.5 mol% Ag Cu, respectively. It is well recognized that the large surface area can deliver additional active sites that are beneficial for enhancing the gas sensing characteristics. Because the structures displayed similar surface areas and pore volumes, it is very noticeable that the surface area has a minimal difference in the current sensing characteristics of the loaded structures. Such a similar surface area could be explained by the minimal difference in the crystallite sizes, as observed in the XRD analyses.
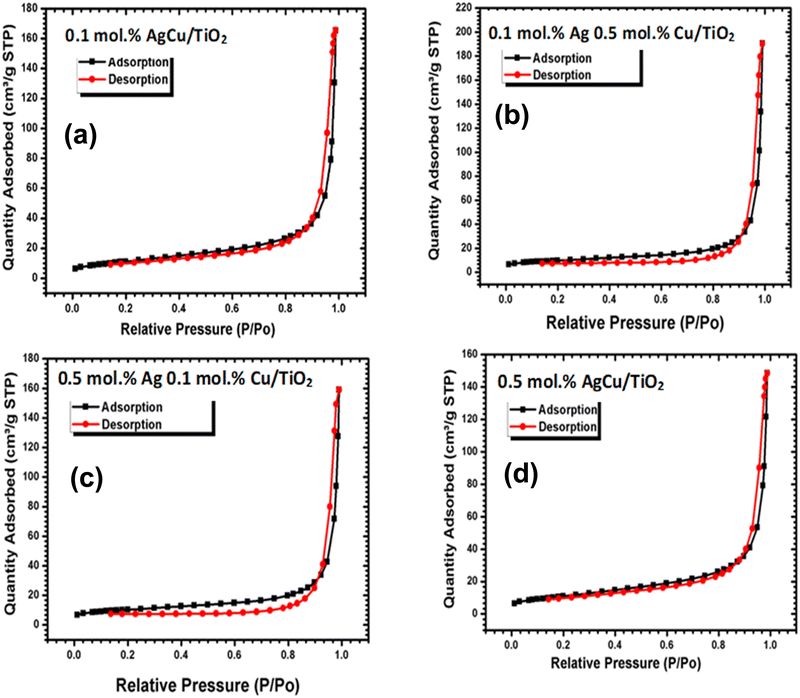 | ||
| Fig. 5 N2 adsorption–desorption isotherms of the (a) 0.1 mol% AgCu/TiO2, 0.1 mol% Ag0.5 mol%Cu/TiO2, (c) 0.5 mol% Ag 0.1 mol% Cu/TiO2 and (d) 0.5 mol% AgCu/TiO2 nanoparticles. | ||
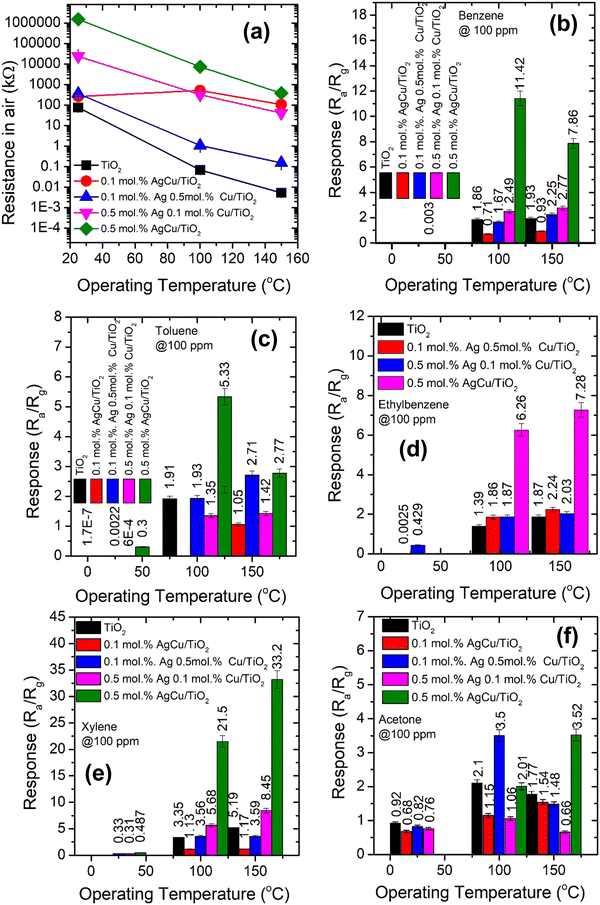
It is well-known that the operational temperature has a noticeable effect on the gas sensing characteristics.38Fig. 6a shows the sensor electrical resistance in air (Ra) versus the operating temperature (25–150 °C). The Ra of all the sensing materials declined when increasing the active temperature. The plot basically displays a behavior of negative temperature coefficient of the electrical resistance, which is in-line with n-type semiconductor behaviour. This behaviour approximately follows the exponent law, which is due to the ionization of donor impurity and defects. The movement of electrons from the valence band (EV) to the EC of the sensing material occurs and consequently further electrons are accessible for transporting the current, leading to a reduction in the sensor resistance. As shown in Fig. 4, the Ra increased with the addition of either Ag or Cu. Interestingly, at a higher loading of Ag and Cu (i.e. 0.5 mol% AgCu), a higher Ra was observed. This result is consistent with the observations of Motsoeneng et al.39 They observed an increase in Ra at a higher Au loading in SnO2/NiO/Au (2.5 wt%) because of the nanoscale development of p–n nanojunctions in NiO and SnO2 phases.
Fig. 6b presents the response of the various sensors versus the operational temperature towards BTEX and acetone vapour. As shown in Fig. 4b, as the sensors were exposed to benzene vapour, the 0.5 mol% AgCu/TiO2 nanoparticle based sensor displayed a higher response at 100 °C, which decreased at 150 °C operational temperature. This behaviour was also noted for the toluene vapour, where the 0.5 mol% AgCu/TiO2 nanoparticles displayed a higher response at 100 °C. Upon exposing the sensors to ethylene–benzene and toluene vapours, the 0.5 mol% AgCu/TiO2 nanoparticle-based sensor still showed a better response. It is interesting to note that when the sensors were exposed to xylene vapour, the 0.5 mol% AgCu/TiO2 nanoparticles displayed a response of 21.2, which is almost twice higher than other gases at 100 °C. This improvement can be explained by the synergistic effect of the Ag and Cu nanoparticles, indicating that loading functionalization may be an active strategy to syndicate the advantages of individual metal nanoparticles. Remarkably, at higher operational temperature the sensor exhibited a remarkable response of 33.2, which was approximately three times higher than that of the other gases. This clearly shows that at higher AgCu loadings, more AgCu nanoparticles contribute to the sensing reaction and improve the catalytic activity. Nevertheless, an extreme loading of 1.0 mol% AgCu/TiO2 resulted in a lower sensing performance, see Fig. S9a (ESI†). This is probably due to aggregation of AgCu and resulted in roughening of the grain growth, which then hampered the spillover effect mechanism. This behaviour was also observed by Kruefu et al.40 They found that when the Ru concentration was increased to 1.00 wt%, the Ru nanoparticles agglomerated into larger particles, leading to poorer dispersion, which led to a less effective spillover effect and thus a reduced response. Based on the current real-time resistance plot in Fig. 7, the pure TiO2 displays a p-type semiconductor behaviour. Thus, the superior sensing response may be elucidated by the formation of an n-type behaviour observed for the 0.5 mol% AgCu/TiO2 nanoparticles. This behaviour was observed on the real-time resistance plots shown in Fig. 7a and b. We believe that this phenomenon of p-type transformation to n-type can be attributed to the reduction of Ag+ and Cu2+. TiO2 with higher metal loading contains larger amounts of Ag+ and Cu2+, which may undergo self-reduction.
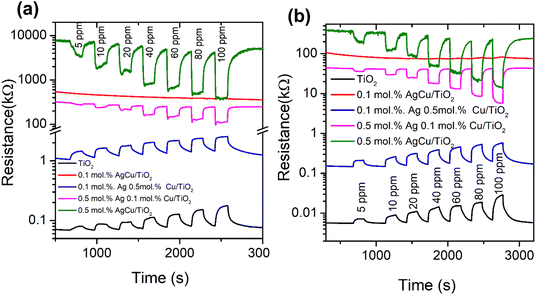 | ||
| Fig. 7 Real-time resistance plots of the pure TiO2 and AgCu/TiO2-based sensors tested to xylene at (a) 100 and (b) 150 °C. | ||
Fig. 7a and b shows that, as the loading concentration of Ag was increased to 0.5 mol%, while that of Cu was kept at 0.1 mol%, the TiO2 structure switched to n-type. This behaviour was observed when the sensor was tested at 100 and 150 °C with xylene. Furthermore, when the loading concentrations of Ag and Cu were increased to 0.5 mol% in TiO2 (i.e. 0.5 mol% AgCu), n-type conductivity was still observed, though the change in resistance was more pronounced than that of the 0.5 mol% Ag 0.1 mol% Cu/TiO2-based sensor. Notably this behaviour was also observed for other target gases, such as benzene and, toluene, see Fig. S8 (ESI†).
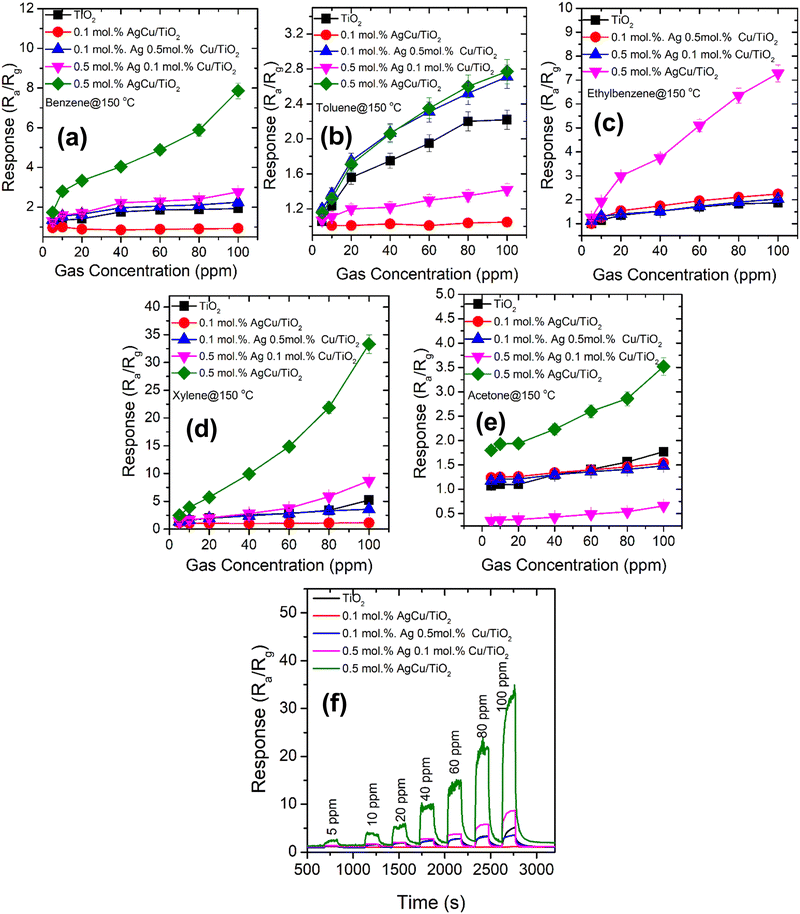
The response of the various AgCu/TiO2 based sensors tested with different concentrations of BTEX and acetone vapours ranging from 5 ppm to 100 ppm at 150 °C are displayed in Fig. 8. As shown in Fig. 8, among all the sensors tested to all these target gases, the 0.5 mol% AgCu/TiO2 nanoparticles displayed improved the response in all the gases. In addition, among all the tested gases, the 0.5 mol% AgCu/TiO2 nanoparticles displayed an improved response towards xylene, see Fig. 8d. Its response increased exponentially without disclosing any point of saturation. At 100 ppm, the response was approximately 33.2, which is almost three times in comparison to that of other gases. Exponential behaviour with the gas concentration was clearly observed in the real-time response plot in Fig. 8f. These results are five times higher than those of the individual loading of 0.1 mol% and 0.5 mol% of either Ag or Cu on TiO2 as shown in Fig. S9b (ESI†). This clearly shows a minimal response to individual loading compared to the loading of both Ag and Cu on TiO2, verifying that the contribution of both Ag and Cu had a significant influence on the spill-over effect mechanism. Additionally, as shown in Fig. S9b (ESI†), the single loadings of 0.5 mol% Cu/TiO2 and 0.5 mol% Ag/TiO2 showed a p-type and n-type conductivity, respectively. This behviour is consistent with the loading of 0.1 mol% Ag 0.5 mol% Cu/TiO2, and 0.5 mol% Ag 0.1 mol% Cu/TiO2, which showed p- and n-type conductivity.
The response time (Tres) and recovery times (Trec), which are defined in ref. 3 are shown in the ESI† (Fig. S9b and c). The rapid response and recovery characteristics could be associated with the catalytic influence of AgCu, which accelerates the xylene reaction process and energetic oxygen species.
In addition, the sensitivity, which is the variation in the response of the sensor to the analyte gas concentration, was shown in Fig. S10 (ESI†). The uppermost sensitivity (S) of around 0.38 ppm−1 was observed for the 0.5 mol% AgCu/TiO2. In addition, the limit of detection (LOD) was assessed using the calibration curves shown in Fig. 8 and Fig. S10 (ESI†), and was roughly 0.10, 4.80, 0.22, 0.06, and 0.03 ppm for pure TiO2, 0.1 mol% AgCu/TiO2, 0.1 mol% Ag 0.5 mol% Cu loaded on TiO2, 0.5 mol% Ag 0.1 mol% Cu loaded on TiO2 and 0.5 mol% AgCu/TiO2, respectively. This LOD was smaller than that at 5 ppm, which could be experimentally tested owing to the limits of the testing system. In addition, the lowest LOD, and higher response, and sensitivity of 0.5 mol% AgCu/TiO2-based sensor submits a prospective approach for the detection of xylene at the ppb level.
Apart from the excellent response to the xylene vapour, the gas selectivity is also another vital parameter to be considered for the practical application of gas sensors. The gas selectivity of the pure and AgCu/TiO2 nanoparticle-based sensors was evaluated for five different vapours, including BTEX and acetone (i.e., letter A in the radar plot) vapour at 100 ppm and an operational temperature of 150 °C. Fig. 9 demonstrates that among the sensors, the 0.5 mol% AgCu/TiO2 nanoparticle-based sensor was extremely selective toward xylene compared with other gases and sensors. The sensor displayed a response of 33.2, which was almost three times higher than those of the other gases under the same conditions. Xylene is a harmful indoor aromatic hydrocarbon vapour, that is found in several domestic products. Exposure to xylene causes different symptoms, such as headache, dizziness, nausea, serious diseases of the memory and nervous systems, etc. As a result, the current selectivity could be useful for its timely detection.
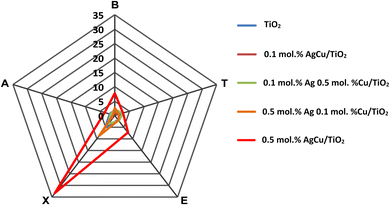 | ||
| Fig. 9 (a) Radar selectivity plot. Note letter A corresponds to acetone, while the others are BTEX in a radar plot. | ||
To quantitatively measure the cross-selectivity of the 0.5 mol% AgCu/TiO2 nanoparticle-based sensor to other interference gases, the selectivity coefficient (K) was utilized by applying the following relationship: K = Sxyelene/S0,41 where Sxyelene is linked to the 0.5 mol% AgCu/TiO2 nanoparticle-based sensor response and S0 is linked to the response of the interfering gases (i.e., benzene, toluene, ethylbenzene, and acetone). Accordingly, the cross-selectivity values of the 0.5 mol% AgCu/TiO2 nanoparticle-based sensor towards xylene over interfering gases corresponding to Sxyelene/Sbenzene, Sxylene/toluene, Sxylene/Sethyl-benzene and Sxyelene/Sacetone are 2.9, 6.2, 4.6 and 16.3, respectively. The higher ‘K’ value indicates the superior selectivity of the Co-140 based sensor toward benzene vapour, see Fig. S11 (ESI†) for better clarity.
Table 1 shows a comparison of the gas sensing characteristics of the n-type 0.5 mol% AgCu/TiO2 nanoparticle-based sensor in the present work and other n-type and p-type sensing nanomaterials in the literature. Matched to the xylene gas sensing characteristics of pure TiO2,42 0.5 at% Ag/TiO2,43 Ni-TiO2 submicron,44 Co3O4-TiO2,45 Co3O4-TiO2,46 SDBS-TiO2,47 TiO2/α-Fe2O3,48 and In-TiO2,31 our current sensor (i.e., the n-type 0.5 mol% AgCu/TiO2) displays a competitive response and timely selectivity toward xylene, especially when it is compared to those operated at a higher temperature. Additionally, the sensor in ref. 43 could not display a clear selectivity toward xylene; there was cross sensitivity arising from benzene and toluene, and other gases, showing a clear interference by benzene and toluene.
| Sensing element | Conc. (ppm) | T res/Trec (s) | Response | Temp. (°C) | Ref. |
|---|---|---|---|---|---|
| Note: concen., temp. and ref. denote the concentration, temperature, and references, respectively. | |||||
| TiO2-NWs | 100 | 60/120 | 9.8 | 125 | 3 |
| TiO2 NPs | 0.1 | 20/14 | — | 75 | 42 |
| 0.5 at% Ag/TiO2 | 100 | 5/2 | 6.49 | 375 | 43 |
| Ni–TiO2 submicron | 100 | 9/12 | 2 | 302 | 44 |
| Co3O4–TiO2 | 50 | — | 113 | 115 | 45 |
| Co3O4–TiO2 | 50 | <23/— | 6.21 | 120 | 46 |
| SDBS-TiO2 | 0.001 | 4/61 | — | R/T | 47 |
| TiO2/α-Fe2O3 | 100 | 4/3 | 27.5 | 370 | 48 |
| In-TiO2 | 50 | 2.2/3 | 127.2 | 200 | 49 |
| 0.5 mol% AgCu/TiO2 | 100 | 22/33 | 33.2 | 150 | Current work |
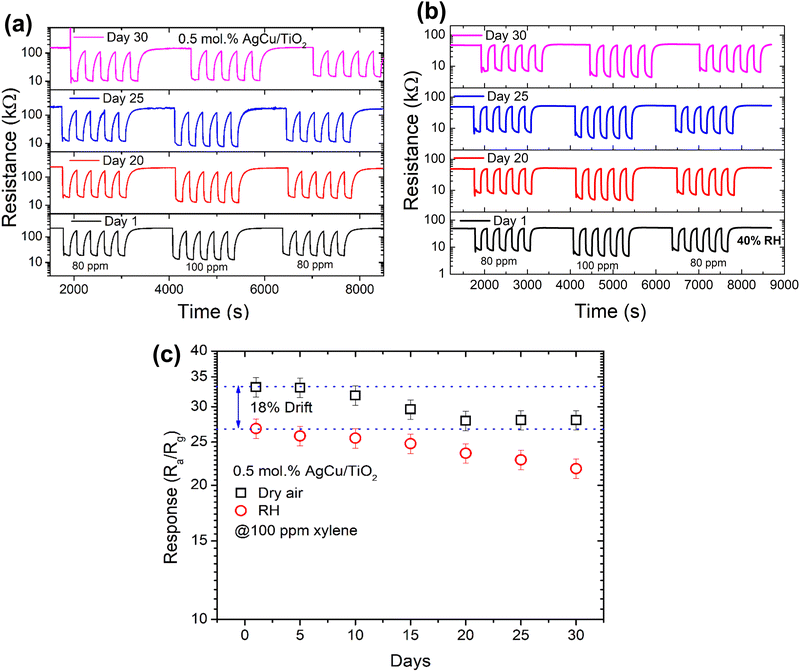
Constant gas detection by a sensor is essential to assess its reproducibility, linearity, and stability. Fig. 10a and b exhibit five cycles of the reproducibility plot of the sensor on successive exposure to 80 and 100 ppm xylene gas in dry air and in the presence of 40% relative humidity (RH). As depicted from the figure, the sensor was exposed to five cycles at 80 ppm, 100 ppm and then 80 ppm xylene for 30 days to observe its long-term stability behaviour in dry air and in the existence of 40% RH. As noted in Fig. 10b and c, the sensor showed a clear response and recovery characteristics (i.e., repeatability) towards xylene in dry air from day 1 to day 30 without collapsing or showing any poisoning, and it was only reduced by roughly 15%. Furthermore, when the sensor was exposed to xylene in the presence of 40% RH, the sensor shows a minimal drift of 18% in comparison to dry air. Besides, in the presence of RH, the sensor response only reduced by 19% from day 1 to day 30. This behaviour indicates that the sensor was indeed stable under both conditions, and this was validated by the long-term stability results (i.e., response versus number of days) in both dry air and 40% RH, see Fig. 10c. Thus, these findings demonstrate that the 0.5 mol% AgCu/TiO2 nanoparticle-based sensor presents attractive characteristics for reliable and stable sensors for the detection of xylene in real-time applications.
Xylene gas sensing mechanism
For a 0.5 mol% AgCu/TiO2-based sensor as an n-type SMO, the sensing mechanism is established on the resistance difference when exposed to the target gas. The adsorption–desorption mechanism is associated with the oxygen species (O2−, O−, and O2−) that are adsorbed on the metal oxide surface.50,51 An n-type surface, such as the 0.5 mol% AgCu/TiO2-based sensor adsorbs the oxygen molecules ionized by EC electrons, generating a thick charge depleted region close to the surface, and subsequent upward bending of the potential barrier is witnessed due to an increase in electrical resistance.50,51| O2(gas) ↔ O2(ads) (operating temperature of 25 °C) | (1) |
| O2(ads) + e− →O2(ads)− (operating temperature < 100 °C) | (2) |
| O2(ads)− + 2e−→2O(ads)− (operating temperature 100 °C < T < 300 °C) | (3) |
When the 0.5 mol% AgCu/TiO2-based sensor is exposed to VOCs, such as BTEX vapours, they interact with the chemisorbed oxygen ions (O2− and O− at 100 and 150 °C, respectively), resulting in a release of electrons back to the EC which in turn leads to a narrow depletion layer due to charge accumulation, then results in a decrease in the sensor resistance (see reactions (S4), (S5) and Scheme S1 in the ESI†).3,52
| (C6H4CH3CH3)gas ↔ (C6H4CH3CH3)ads | (4) |
| (C6H4CH3CH3)ads + 21O− → 8CO2 + 5H2O(gas) + 21e− | (5) |
Thus, the improved performance of BTEX, especially the xylene vapour, could result from the possible speculations. Generally, the n-type SMO responses to a lesser amount of responsive BTEX vapours are inferior in-line to those that are highly reactive, such as ethanol or formaldehyde.53 Thus, the improved sensing characteristics could be due to numerous synergetic factors, such as the number of reaction sites, catalytic influence, and electrical resistance of the sensor.54,55 The AgCu improved the chemisorption of xylene and oxygen molecules via a spill-over mechanism. This was validated by the fact that, at higher AgCu loadings, the sensing performance improved, indicating that more AgCu nanoparticles contributed to the sensing reaction and improved the catalytic activity. Moreover, the PL and XPS analyses proved that at a higher loading of AgCu, VO increased, which provided additional active sites on the sensing materials surface for the gas reaction and adsorption.51,52 Previous studies have reported a link between the sensing properties and paramagnetic VO from the electron spin resonance (ESR).56–59 They found that the amount of VO recognized through ESR was related to the number of electrons reaching the EC of SnO2.56–59 This clearly confirms that the significant variation observed in the resistance of the AgCu/TiO2 sensor is due to more oxygen molecules.
Using the above mechanism, it is possible to justify the enhancement of the gas sensing performance of xylene. Nonetheless, the exact reason for this superior selectivity toward xylene remains unclear. In addition, we assume that the current selectivity of the AgCu/TiO2-based sensor toward xylene can be explained by the following factors: (1) target gas adsorption amount and the energy needed for gas dissociation.60–64 For example, among the BTEX, toluene possesses a lower binding energy of 356 kJ mol−1, in comparison to xylene (375 kJ mol−1), benzene (431 kJ mol−1), and ethylbenzene (435 kJ mol−1), respectively.3,65 However, toluene has excellent chemical stability under typical conditions and −CH3 is very stable in comparison to −OH and −CHO. Thus, it is very difficult for toluene to react, nonetheless it can react radically with an oxidant or acid.
(2) Moreover, the gas sensing is highly dependent on the change in enthalpy of the organic target analyte in the dehydrogenation process.52,66,67 The change in enthalpy of the dehydrogenation is generally assessed using the following relationship: ΔH = HR − HO, based on the data of standard enthalpies of dehydro-radical (HR) and original molecule (HO) shown in ref. 52, 66, and 67. As shown in ref. 66 and 67 the enthalpy change of the dehydrogenation is very high for benzene (255.4 kJ mol−1), leading to a poor sensing response. On the other hand, the enthalpy changes of the dehydrogenation for both toluene and xylene are roughly comparable, which are 157.4 and 157.8 J mol−1,7,66 respectively. On the other hand, xylene possesses an additional methyl group in comparison to toluene, which makes it highly reactive with an advanced oxidation efficiency.52 Consequently, AgCu/TiO2 displayed a higher response to xylene.
4. Conclusion and remarks
In summary, we successfully synthesized n- and p-type AgCu/TiO2 nanostructures using a hydrothermal method. Structural and surface analyses confirmed that the Ag and Cu were loaded onto the TiO2 surface. The real-time resistance analyses confirmed that at lower loadings the material displayed p-type TiO2 conductivity, and switched to n-type conductivity at higher loading of both Ag and Cu. This novel switching is not temperature- or gas-dependent. The sensing analyses further demonstrated an improved response towards xylene vapour at 150 °C for the 0.5% AgCu/TiO2. This response was higher than the individual loading of 0.5 mol% Cu or Ag on a TiO2 based sensor, justifying that the contribution of both AgCu had a significant influence on the spillover effect mechanism. The improved response could also be associated with the higher number of surface defects observed in the PL and XPS studies. Moreover, a high loading of 1.0 mol% AgCu resulted in a poor sensing performance. Thus, the 0.5 mol% AgCu/TiO2-based sensor exhibited excellent repeatability and stability toward xylene. These findings confirm that appropriate selectivity can be achieved. More precisely, the sensor was highly selective for xylene through the loading of an n-type 0.5 mol% AgCu. This indicates that the strategy of loading AgCu on TiO2 not only improves the sensing response, but also adjusts the selectivity, which could be vital for indoor/outdoor air quality and environmental monitoring. These results suggest new potentials for the design of innovative SMO-based sensors with noticeably superior gas sensing characteristics owing to the synergistic catalytic influence of a AgCu/TiO2-based sensor.Author contributions
Ms. Popoti J. Maake (methodology) (investigation) (software) (writing – original draft) (writing – review and editing), Dr. T. P. Mokoena (methodology) (investigation) (software) (writing – original draft) (writing – review and editing), Dr. Amogelang S. Bolokang (investigation) (writing – review and editing), Prof. Nomso Hintsho-Mbita (investigation) (writing – review and editing), James Tshilongo (investigation) (writing – review and editing), Prof. Franscious R. Cummings (investigation) (writing – review and editing), Prof. Hendrik C. Swart (investigation) (writing – review and editing) (visualization) (funding acquisition), Prof. Emmanuel I. Iwuoha (conceptualization) (writing – review and editing) (visualization) (project administration) (supervision), Prof. David E. Motaung (conceptualization) (writing – review and editing) (visualization) (project administration) (supervision) (funding acquisition).Conflicts of interest
There are no conflicts to declare.Acknowledgements
The Council for Scientific and Industrial Research-Human Capital Development is acknowledged for the MSc studentship. The Sarchi Chair Initiative of the Department of Science and Technology (84415) for equipment and financial support is acknowledged.References
- S.-W. Park, S.-Y. Jeong, J.-W. Yoon and J.-H. Lee, General Strategy for Designing Highly Selective Gas-Sensing Nanoreactors: Morphological Control of SnO2 Hollow Spheres and Configurational Tuning of Au Catalysts, ACS Appl. Mater. Interfaces, 2020, 12(46), 51607–51615 CrossRef CAS PubMed.
- K. Dutta, P. P. Chattopadhyay, C. W. Lu, M. S. Ho and P. Bhattacharyya, A highly sensitive BTX sensor based on electrochemically derived wall connected TiO2 nanotubes, Appl. Surf. Sci., 2015, 354, 353–361 CrossRef CAS.
- Z. P. Tshabalala, T. P. Mokoena, M. Jozela, J. Tshilongo, T. K. Hillie, H. C. Swart and D. E. Motaung, TiO2 Nanowires for Humidity-Stable Gas Sensors for Toluene and Xylene, ACS Appl. Nano Mater., 2021, 4, 702–716 CrossRef CAS.
- A. A. Haidry, L. Sun, B. Saruhan, A. Plecenik, T. Plecenik, H. Shen and Z. Yao, Cost-effective fabrication of polycrystalline TiO2 with tunable n/p response for selective hydrogen monitoring, Sens. Actuators, B, 2018, 274, 10–21 CrossRef.
- X. Gao, Y. Li, W. Zeng, C. Zhang and Y. Wei, Hydrothermal synthesis of agglomerating TiO2 nanoflowers and its gas sensing, J. Mater. Sci.: Mater. Electron., 2017, 28(24), 18781–18786 CrossRef CAS.
- X. Xing, N. Chen, Y. Yang, R. Zhao, Z. Wang, Z. Wang, T. Zou and Y. Wang, Pt-functionalized nanoporous TiO2 nanoparticles with enhanced gas sensing performances toward acetone., Phys. Status Solidi A, 2018, 215(14), 1800100 CrossRef.
- G. K. Naik, S. M. Majhi, K. U. Jeong, I. H. Lee and Y. T. Yu, Nitrogen doping on the core-shell structured Au@ TiO2 nanoparticles and its enhanced photocatalytic hydrogen evolution under visible light irradiation, J. Alloys Compd., 2019, 771, 505–512 CrossRef CAS.
- S. Mao, H. Zhou, S. Wu, J. Yang, Z. Li, X. Wei, X. Wang, Z. Wang and J. Li, High performance hydrogen sensor based on Pd/TiO2 composite film., Int. J. Hydrogen Energy, 2018, 43(50), 22727–22732 CrossRef CAS.
- O. Lupan, V. Postica, N. Ababiib, T. Reimer, S. Shree, M. Hoppe, O. Polonskyie, V. Sontea, S. Chemnitz, F. Faupele and R. Adelung, ; Ultra-thin TiO2 films by atomic layer deposition and surface functionalization with Au nanodots for sensing applications, Mater. Sci. Semicond. Process., 2018, 87, 44–53 CrossRef CAS.
- D. A. Panayotov and J. T. Yates Jr, Spectroscopic Detection of Hydrogen Atom Spillover from Au Nanoparticles Supported on TiO2: Use of Conduction Band Electrons, J. Phys. Chem. C, 2007, 11, 2959–2964 CrossRef.
- O. Lupan, N. Ababii, D. Santos-Carballal, M.-I. Terasa, N. Magariu, D. Zappa, E. Comini, Th. Pauporté, L. Siebert, F. Faupel, A. Vahl, S. Hansen, N. H. de Leeuw and R. Adelung, Tuning the Reactivity of Ultralow Power Heterojunction Sensors toward H2 and VOCs through Noble Metal Nanoparticle Functionalization., Nano Energy, 2021, 88, 106241 CrossRef CAS.
- O. Lupan, D. Santos-Carballal, N. Ababii, N. Magariu, S. Hansen, A. Vahl, L. Zimoch, M. Hoppe, T. Pauporté, V. Galstyan, V. Sontea, L. Chow, F. Faupel, R. Adelung, N. H. Leeuw and E. de. Comini, TiO2/Cu2O/CuO Multi-Nanolayers as Sensors for H2 and Volatile Organic Compounds: An Experimental and Theoretical Investigation, ACS Appl. Mater. Interfaces, 2021, 13, 32363–32380 CrossRef CAS PubMed.
- D. Wang, D. Zhang and Q. Mi, A high-performance room temperature benzene gas sensor based on CoTiO3 covered TiO2 nanospheres decorated with Pd nanoparticles, Sens. Actuators, B, 2022, 350, 130830 CrossRef CAS.
- D. Zhang, W. Pan, L. Zhou and S. Yu, Room-Temperature Benzene Sensing with Au-Doped ZnO Nanorods/Exfoliated WSe2 Nanosheets and Density Functional Theory Simulations, ACS Appl. Mater. Interfaces, 2021, 13(28), 33392–33403 CrossRef CAS PubMed.
- D. Wang, D. Zhang, J. Guo, Y. Hu, Yang Yan, T. Sun, H. Zhang and X. Liu, Multifunctional poly(vinyl alcohol)/Ag nanofibers-based triboelectric nanogenerator for self-powered MXene/tungsten oxide nanohybrid NO2 gas sensor, Nano Energy, 2021, 89106410 Search PubMed.
- D. Wang, D. Zhang, J. Guo, Y. Hu, Yang Yan, T. Sun, H. Zhang and X. Liu, Multifunctional Latex/Polytetrafluoroethylene-Based Triboelectric Nanogenerator for Self-Powered Organ-like MXene/Metal−Organic Framework-Derived CuO Nanohybrid Ammonia Sensor, ACS Nano, 2021, 15, 2911–2919 CrossRef CAS PubMed.
- D. Wang, D. Zhang, M. Tang, H. Zhang, F. Chen, T. Wang, Z. Li and P. Zhao, Rotating triboelectric-electromagnetic nanogenerator driven by tires for self-powered MXene-based flexible wearable electronics, Chem. Eng. J. Adv., 2022, 446, 136914 CAS.
- T. Endo, Y. Yanagida and T. Hatsuzawa, Colorimetric detection of volatile organic compounds using a colloidal crystal-based chemical sensor for environmental applications., Sens. Actuators, B, 2007, 125(2), 589–595 CrossRef CAS.
- F. Leusch and M. A. Bartkow, Short Primer on Benzene, Toluene, Ethylbenzene and Xylenes (BTEX) in the Environment and in Hydraulic Fracturing Fluids (des.qld.gov.au). Griffith University (accessed 01-04-2021).
- M. E. Fleming-Jones and R. E. Smith, Volatile organic compounds in foods: a five year study., J. Agric. Food Chem., 2003, 51(27), 8120–8127 CrossRef CAS PubMed.
- T. P. Mokoena, Z. P. Tshabalala, K. T. Hillie, H. C. Swart and D. E. Motaung, The blue luminescence of p-type NiO nanostructured material induced by defects: H2S gas sensing characteristics at a relatively low operating temperature., Appl. Surf. Sci., 2020, 525, 146002 CrossRef CAS.
- S. Phromma, T. Wutikhun, P. Kasamechonchung, S. Sattayaporn, T. Eksangsri and C. Sapcharoenkun, Effects of Ag modified TiO2 on local structure investigated by XAFS and photocatalytic activity under visible light, Mater. Res. Bull., 2022, 148, 111668 CrossRef CAS.
- N. L. Reddy, S. Kumar, V. Krishnan, M. Sathish and M. V. Shankar, Multifunctional Cu/Ag quantum dots on TiO2 nanotubes as highly efficient photocatalysts for enhanced solar hydrogen evolution., J. Catal., 2017, 350, 226–239 CrossRef CAS.
- N. F. Jaafar, A. A. Jalil, S. Triwahyonoa, J. Efendi, R. R. Muktif, R. Jusoh, N. W. C. Jusoh, A. H. Karim, N. F. M. Salleh and V. Suendo, Direct in situ activation of Ag0 nanoparticles in synthesis of Ag/TiO2 and its photoactivity, Appl. Surf. Sci., 2015, 338, 75–84 CrossRef CAS.
- N. A. M. Barakat, N. A. Erfan, A. A. Mohammed and S. E. I. Mohamed, Ag-decorated TiO2 nanofibers as Arrhenius equation-incompatible and effective photocatalyst for water splitting under visible light irradiation, Colloids Surf., A, 2020, 604, 125307 CrossRef CAS.
- P. V. Kamat, TiO2 nanostructures: recent physical chemistry advances, J. Phys. Chem. C, 2012, 116, 11849–11851 CrossRef CAS.
- M. Yang, W. Liu, J. L. Sun and J. L. Zhu, High magnetic field annealing effect on visible photoluminescence enhancement of TiO2 nanotube arrays., Appl. Phys. Lett., 2012, 100(4), 043106 CrossRef.
- J. Shi, J. Chen, Z. Feng, T. Chen, Y. Lian, X. Wang and C. Li, Photoluminescence characteristics of TiO2 and their relationship to the photoassisted reaction of water/methanol mixture., J. Phys. Chem. C, 2007, 111(2), 693–699 CrossRef CAS.
- B. Santara, P. K. Giri, K. Imakita and M. Fujii, Evidence of oxygen vacancy induced room temperature ferromagnetism in solvothermally synthesized undoped TiO2 nanoribbons., Nanoscale, 2013, 5(12), 5476–5488 RSC.
- C. Mercado, Z. Seeley, A. Bandyopadhyay, S. Bose and J. L. McHale, Photoluminescence of dense nanocrystalline titanium dioxide thin films: effect of doping and thickness and relation to gas sensing., ACS Appl. Mater. Interfaces, 2011, 3(7), 2281–2288 CrossRef CAS PubMed.
- B. Santara, K. Imakita, M. Fujii and P. K. Giri, Mechanism of defect induced ferromagnetism in undoped and Cr doped TiO2 nanorods/nanoribbons., J. Alloys Compd., 2016, 661, 331–344 CrossRef CAS.
- Z. P. Tshabalala, D. E. Motaung and H. C. Swart, Structural transformation and enhanced gas sensing characteristics of TiO2 nanostructures induced by annealing., Phys. B, 2018, 535, 227–231 CrossRef CAS.
- B. Santara, P. K. Giri, K. Imakita and M. Fujii, Evidence for Ti Interstitial Induced Extended Visible Absorption and Near Infrared Photoluminescence from Undoped TiO2 Nanoribbons: An In Situ Photoluminescence Study., J. Phys. Chem. C, 2013, 117, 23402–23411 CrossRef CAS.
- B. Santara, P. K. Giri, S. Dhara, K. Imakita and M. Fujii, Oxygen vacancy-mediated enhanced ferromagnetism in undoped and Fe-doped TiO2 nanoribbons., J. Phys. D: Appl. Phys., 2014, 47(23), 235304 CrossRef.
- S. M. Prokes, J. L. Gole, X. Chen, C. Burda and W. E. Carlos, Defect-Related Optical Behavior in Surface-Modified TiO2 Nanostructures., Adv. Funct. Mater., 2005, 15(1), 161–167 CrossRef CAS.
- J. Hu, Y. Liang, Y. Sun, Z. Zhao, M. Zhang, P. Li, W. Zhang, Y. Chen and S. Zhuiykov, Highly sensitive NO2 detection on ppb level by devices based on Pd-loaded In2O3 hierarchical microstructures., Sens. Actuators, B, 2017, 252, 116–126 CrossRef CAS.
- M. Ding, N. Xie, C. Wang, X. Kou, H. Zhang, L. Guo, Y. Sun, X. Chuai, Y. Gao, F. Liu and P. Sun, Enhanced NO2 gas sensing properties by Ag-doped hollow urchin-like In2O3 hierarchical nanostructures., Sens. Actuators, B, 2017, 252, 418–427 CrossRef CAS.
- I. Kortidis, H. C. Swart, S. S. Ray and D. E. Motaung, Detailed understanding on the relation of various pH and synthesis reaction times towards a prominent low temperature H2S gas sensor based on ZnO nanoplatelets., Results Phys., 2019, 12, 2189–2201 CrossRef.
- R. G. Motsoeneng, I. Kortidis, R. Rikhotso, H. C. Swart, S. S. Ray and D. E. Motaung, Temperature-dependent response to C3H7OH and C2H5OH vapors induced by deposition of Au nanoparticles on SnO2/NiO hollow sphere-based conductometric sensors, Sens. Actuators, B, 2020, 316, 128041 CrossRef CAS.
- V. Kruefu, A. Wisitsoraat, A. Tuantranont and S. Phanichphant, Ultra-sensitive H2S sensors based on hydrothermal/impregnation-made Ru-functionalized WO3 nanorods, Sens. Actuators, B, 2015, 215, 630–636 CrossRef CAS.
- S.-Y. Jeong, J.-W. Yoon, T.-H. Kim, H.-M. Jeong, C.-S. Lee, Y. C. Kang and J.-H. Lee, Ultra-selective detection of sub-ppm-level benzene using Pd–SnO2 yolk–shell micro-reactors with a catalytic Co3O4 overlayer for monitoring air quality, J. Mater. Chem. A, 2017, 5, 1446–1454 RSC.
- K. Dutta, B. Bhowmik, A. Hazra, P. P. Chattopadhyay and P. Bhattacharyya, An efficient BTX sensor based on p-type nanoporous titania thin films, Microelectron. Reliab., 2015, 55(3–4), 558–564 CrossRef CAS.
- Y. Zhang, J. Bai, L. Zhou, D. Liu, F. Liu, X. Liang, Y. Gao, F. Liu, X. Yan and G. Lu, Preparation of silver-loaded titanium dioxide hedgehog-like architecture composed of hundreds of nanorods and its fast response to xylene, J. Colloid Interface Sci., 2019, 536, 215–223 CrossRef CAS PubMed.
- L. Zhu, D. Zhang, Y. Wang, C. Feng, J. Zhou, C. Liu and S. Ruan, Xylene gas sensor based on Ni doped TiO2 bowl-like submicron particles with enhanced sensing performance, RSC Adv., 2015, 5(36), 28105–28110 RSC.
- J. Zhang, P. Tang, T. Liu, Y. Feng, C. Blackman and D. Li, Facile synthesis of mesoporous hierarchical Co3O4–TiO2 p–n heterojunctions with greatly enhanced gas sensing performance, J. Mater. Chem. A, 2017, 5(21), 10387–10397 RSC.
- S. Bai, K. Tian, Y. Tian, J. Guo, Y. Feng, R. Luo, D. Li, A. Chen and C. C. Liu, Synthesis of Co3O4/TiO2 composite by pyrolyzing ZIF-67 for detection of xylene, Appl. Surf. Sci., 2018, 435, 384–392 CrossRef CAS.
- Y. Zhang, P. Nizamidin, H. Abudukeremu and A. Yimit, Optical waveguide xylene gas sensor based on sodium dodecylbenzene sulfonate (SDBS)–TiO2 film for detection at room temperature, Opt. Mater. Express, 2020, 10(9), 2212–2226 CrossRef CAS.
- Y. Wang, S. Wang, H. Zhang, X. Gao, J. Yang and L. Wang, Brookite TiO2 decorated α-Fe2O3 nanoheterostructures with rod morphologies for gas sensor application, J. Mater. Chem. A, 2014, 2(21), 7935–7943 RSC.
- R. Malik, V. K. Tomer, V. Chaudhary, M. S. Dahiya, S. P. Nehra, P. S. Rana and S. Duhan, Ordered mesoporous In-(TiO2/WO3) nanohybrid: An ultrasensitive n-butanol sensor, Sens. Actuators, B, 2017, 239, 364–373 CrossRef CAS.
- D. N. Oosthuizen, D. E. Motaung and H. C. Swart, Gas sensors based on CeO2 nanoparticles prepared by chemical precipitation method and their temperature-dependent selectivity towards H2S and NO2 gases, Appl. Surf. Sci., 2020, 505, 144356 CrossRef CAS.
- Z. P. Tshabalala, T. P. Mokoena, T. K. Hillie, H. C. Swart and D. E. Motaung, Improved BTEX Gas Sensing Characteristics of Thermally Treated TiO2 Hierarchical Spheres Manifested by High-Energy {001} Crystal Facets, Sens. Actuators, B, 2021, 338, 129774 CrossRef CAS.
- H. Gao, Q. Yu, K. Chen, P. Sun, F. Liu, X. Yan, F. Liu and G. Lu, Ultrasensitive gas sensor based on hollow tungsten trioxide-nickel oxide (WO3-NiO) nanoflowers for fast and selective xylene detection, J. Colloid Interface Sci., 2019, 535, 458–468 CrossRef CAS PubMed.
- B. Y. Kim, J. H. Ahn, J. W. Yoon, C. S. Lee, Y. C. Kang, F. Abdel-Hady, A. A. Wazzan and J. H. Lee, Highly selective xylene sensor based on NiO/NiMoO4 nanocomposite hierarchical spheres for indoor air monitoring, ACS Appl. Mater. Interfaces, 2016, 8(50), 34603–34611 CrossRef CAS PubMed.
- H. S. Woo, C. H. Kwak, J. H. Chung and J. H. Lee, Highly selective and sensitive xylene sensors using Ni-doped branched ZnO nanowire networks, Sens. Actuators, B, 2015, 216, 358–366 CrossRef CAS.
- A. Mirzaei, J. H. Kim, H. W. Kim and S. S. Kim, Resistive-based gas sensors for detection of benzene, toluene and xylene (BTX) gases: a review, J. Mater. Chem. C, 2018, 6(16), 4342–4370 RSC.
- S. Lenaerts, J. Roggen and G. Maes, FT-IR characterization of tin dioxide gas sensor materials under working conditions, Spectrochim. Acta, 1995, 51A, 883–894 CrossRef CAS.
- N. Yamazoe, J. Fuchigami, M. Kishikawa and T. Seiyama, Interactions of tin oxide surface with O2, H2O, and H2, Surf. Sci., 1979, 86, 335–344 CrossRef CAS.
- S.-C. Chang, Oxygen chemisorption on tin oxide: Correlation between electrical conductivity and EPR measurements, J. Vac. Sci. Technol., 1980, 17, 366 CrossRef CAS.
- R. G. Motsoeneng, I. Kortidis, S. S. Ray and D. E. Motaung, Designing SnO2 Nanostructure-Based Sensors with Tailored Selectivity toward Propanol and Ethanol Vapors, ACS omega, 2019, 4, 13696–13709 CrossRef CAS PubMed.
- , Ji Guo, Y. Li, B. Jiang, H. Gao, T. Wang, P. Sun, F. Liu, X. Yan, X. Liang, Y. Gao, J. Zhao and G. Lu, Xylene gas sensing properties of hydrothermal synthesized SnO2-Co3O4 microstructure, Sens. Actuators, B, 2020, 310, 127780 CrossRef.
- W. Zen and T. M. Liu, Gas-sensing properties of SnO2-TiO2-based sensor for volatile organic compound gas and its sensing mechanism, Physica B, 2010, 405, 1345–1348 CrossRef.
- K. Suematsu, Y. Shin, N. Ma, T. Oyama, M. Sasaki, M. Yuasa, T. Kida and K. Shimanoe, Pulse-driven Micro gas sensor fitted with clustered Pd/SnO2 nanoparticles, Anal. Chem., 2015, 87, 8407–8415 CrossRef CAS PubMed.
- T.-H. Kim, C.-H. Kwak and J.-H. Lee, NiO/NiWO4 composite yolk-shell spheres with nanoscale NiO outer layer for ultrasensitive and selective detection of sub ppm-level p-Xylene, ACS Appl. Mater. Interfaces, 2017, 9, 32034–32043 CrossRef CAS PubMed.
- A. Mirzaei, J.-H. Kim, H. W. Kim and S. S. Kim, Resistive-based gas sensors for detection of benzene, toluene and xylene (BTX) gases: a review, J. Mater. Chem. C., 2018, 6, 4342–4370 RSC.
- Z. Shen, X. Zhang, X. Ma, R. Mi and Y. Chen, The significant improvement for BTX (benzene, toluene and xylene) sensing performance based on Au-decorated hierarchical ZnO porous rose-like architectures, Sens. Actuators, B, 2018, 262, 86–94 CrossRef CAS.
- L. B. Deng, X. H. Ding, D. W. Zeng, S. P. Zhang and C. S. Xie, High sensitivity and selectivity of C-doped gas sensors toward toluene and xylene, IEEE Sens. J., 2012, 12, 2209–2214 CAS.
- D. L. Baulch, C. T. Bowman, C. J. Cobos, R. A. Cox, T. Just, J. A. Kerr, M. J. Pilling, D. Stocker, J. Troe, W. Tsang, R. W. Walker and J. Warnatz, Evaluated kinetic data for combustion modeling: supplement II, J. Phys. Chem. Ref. Data, 2005, 34, 757–1397 CrossRef CAS.
Footnote |
| † Electronic supplementary information (ESI) available. See DOI: https://doi.org/10.1039/d2ma00587e |
| This journal is © The Royal Society of Chemistry 2022 |

