DOI:
10.1039/D2MA00499B
(Paper)
Mater. Adv., 2022,
3, 7285-7292
Fabricated fractals as unique fingerprints for data and image encryption
Received
2nd May 2022
, Accepted 23rd July 2022
First published on 30th July 2022
Abstract
With advancements in telecommunication technology, data or information transfer has become the backbone of daily transactions. This underlines the importance of transferring data securely by employing techniques of encryption. The purview of Material Science usually is understood to be restricted to materials engineering, property and performance enhancement, reviewing processes of material synthesis, finding or fabricating newer materials, etc. Thus, it primarily serves as a support field. Usually, material science or its concepts are not used for data or information encryption directly. In this work, the use of lab-grown fractals is demonstrated to encrypt information in both text and image formats. By changing the synthesis parameters, a different set of fractals can be fabricated. Furthermore, a library of fabricated fractals (fab-fracs) is proposed that will alter the fractal cover image used for encryption in the real time domain. The fab-fracs give a unique fingerprint characteristic to the library databank proposed in this work. The fab-fracs have a unique growth pattern that cannot be mimicked using mathematical polynomials and when fractal images are picked up randomly in real time, the encryption becomes more robust. The quality of encryption is measured using Peak Signal to Noise Ratio (PSNR) and Structural Similarity Index Measurement (SSIM) values that are 48 dB and greater than 0.995 and are at par with reported encryption techniques. Thus, fab-fracs having their roots in Material Science are proposed as a new-generation tool that can be successfully employed for data encryption.
Introduction
Communication has always been a synonym for the growth and development of humankind. In today's digital world, data transfer and telecommunication have become an integral part of human life. Digitization influences sectors such as communication, commerce, commutation, healthcare, housing, academia, industries, entertainment, user-device interfaces, etc. It is reported that about 62.5% of the world population actively uses the internet.1 With proliferating growth in digital technology, networking and data science, transferring data and information has become easier but at the same time has brought in related risks or vulnerability issues of data or security breach. The importance of data security became more apparent with incidents like the Citibank financial theft in 1994,2 attack on NASA's computer systems in 1999,3 and financial frauds targeting prominent company networks like J. P. Morgan, Home Depot, Sally Beauty, Target and many more that saw a trend of fall in stock prices, closure of service outlets, laying off of employees and numerous lawsuits that eventually cost the companies and marred their reputation.4 The Ukraine power grid attack in 2015 also underlined the vulnerability of government-controlled systems.5 Thus, there is a need to strengthen the encryption techniques and devise ways that are less time and resource intensive, have a fairly good quality of encryption, increased randomness and robustness, and easy implementation.
Today, computational techniques blended with Artificial Intelligence and Machine Learning concepts seem to be the store house of data and information. Once the machine is trained using a database and a model prepared, predictions can be made with much ease. First the information from a known database is employed as a tool to train the model/machines, then the model is tested and finally predictions are made.6,7 Now, with the advent of artificial intelligence supporting automation, progress in material sciences needs to be pushed to the forefront of technological advancements. The predictions made by computer models pose a challenge to prospective experimental results. Some studies have reported the use of machine learning for predicting the existence of stable materials and formulating their properties.8 Though theoretical predictions work well, many-a-times it is difficult to reproduce them experimentally. For example, graphene adsorption has been predicted to be very high theoretically as theory idealizes a two-dimensional sheet with two-perfect surfaces.9,10 However, it is difficult to achieve this experimentally due to the stacking of sheets and folds, edges, wrinkles etc. present in the sample. Another example can be that of predictions made on MXene phases. While 74 phases have been predicted, only 30 have been synthesized to date in the lab.11 These statistics show that a gap exists between concepts i.e. theory and practical results. In this work, a reverse approach is being proposed where material science can be used to strengthen the existing encryption and data protection techniques that usually depend heavily upon computation.
Fractals are complex patterns that are often seen in nature and natural systems.12–17 Examples of fractals are snowflakes, lightning, tree branches, coastlines, neurons, ice crystals, ferns, etc. These are self-similar structures that repeat themselves at different length scales. Owing to their unique and characteristic morphology, they are proposed for data encryption in this work. Though fractal geometries have been implemented computationally too,18,19 these involve algorithms based on robust codes and depend on high performance computational resources. Furthermore, as these are governed by a specific non-linear mathematical function, mathematical fractals are still decodable. Recently, the growth of fabricated fractals (fab-fracs) has been reported under laboratory conditions.20–22 Here, the growth parameters were tailored to engineer fractals into different morphologies ranging from cruciform, rhombohedral, sword-like, and finger-like structures.20 These structures are an outcome of non-equilibrium and stochastic nucleation processes that lead to the growth of artificial fractals. In another study, protein-mediated gold fractals were obtained by changing the pH of proteins and incubation time.21 Fractal geometries cannot be predicted precisely a priori during their growth phase but can be analysed statistically using characteristic length scales later. It is this aspect of randomness in fractal growth which has been applied in the present work for improving data security and encryption. The proposed method is easy to implement, has high robustness and efficiently encrypts the given secret information. Thus, fab-fracs are proposed as new-generation tools that can be successfully employed for data encryption.
Methods and materials
Transfer of data and information through the world wide web may be of different nature like personal, confidential, financial, etc. and needs to be transmitted without loss and security breach. Data security deals with minimizing cyber-attacks and protects data from malicious threats. Cryptography is a field of data security that employs cryptic codes that only authorized users can access and decipher. Steganography on the other hand is a field of data security that uses a cover media as an alias for hiding secret data during data transfer.23Fig. 1 shows the schematic of encryption based on (a) cryptography and (b) steganography.
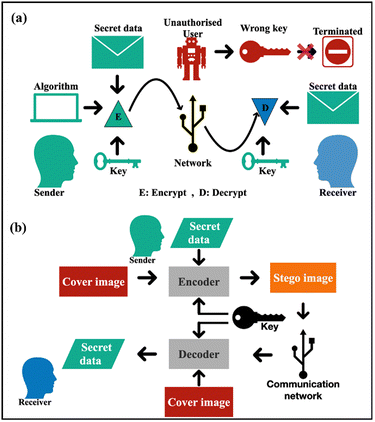 |
| | Fig. 1 Schematic of encryption based on (a) cryptography and (b) steganography. | |
What is steganography?
In steganography the data to be encrypted is overlapped (or embedded) with some other form of data (text, image, audio, video files, etc.) to hide its originality. For this purpose, a carrier image known as the cover image (CI) is used to hide the original data. The original data is then embedded in the cover image and the resulting image is called the stego image (SI).24 As the proportion of changes in the resulting SI are small as compared to the CI, the distortion in the image transmitted over the network does not raise suspicion. Hence, the secret data is transferred unnoticed and therefore aids in a secure channel of data transfer. The actual information is revealed only when a specific key is used to decode the stego image at the receiver's end. Images are most popularly used as cover media for embedding secretive information for they provide a high level of redundancy and embedding capacity. In the present work, two aspects of data security have been addressed, namely data sent in the form of images and text.25
Algorithms used for steganographic encryption
Different algorithms are used for steganographic encryption. For encrypting the data, a passcode or key is used which is a unique combination of case-sensitive alpha-numeric and special characters. A key is usually generated using a random number generator. The key also helps in recovering the original data during decryption. Several popular algorithms are implemented for encrypting data with these unique keys. A few of the most common algorithms used in steganography are the least significant bit method (LSB), discrete cosine transformation (DCT), discrete wavelet transformation (DWT), k-modulus and Lah transformation method. The underlying principle of these algorithms is summarized in Table 1 below.
Table 1 Algorithms commonly used for steganographic encryption
| Method |
Embedding principle |
| LSB |
Message bits are embedded in the least significant bit of pixel values |
| DCT |
Discretion of image into low, middle, and high frequency components is done and data is hidden in these components |
| DWT |
Discretion of low and high frequency data on a pixel-by-pixel basis for data hiding |
| k-modulus |
Original image pixels are transformed into multiples of a positive integer |
| Lah transformation |
Generates polynomial sequence from pixel values using basic operations of addition and multiplication in coefficient form; the output is an integer and therefore algorithms using this method are faster in terms of computational time. |
The LSB method is employed for text steganography26 and Lah transformation for image steganography in this work.24 Briefly, the LSB method embeds the message/information by changing the least significant bits, while the rest of the bits remain the same. For image steganography, a more robust and stable encryption based on Lah transformation is employed. As described in Table 1 above, the algorithm works with integral values of coefficients and therefore consumes less computational time. The following sections describe some indicators to test the extent of encryption. A bits per pixel (bpp) value is a measure of number of bits per pixel stored in an image.
Statistical analysis of encryption
The quality of image steganography is measured using specific statistical methods. Widely used metrics are payload capacity, Mean Square Error (MSE), Peak Signal to Noise Ratio (PSNR) and Structured Similarity Index (SSIM). Payload capacity (PC) is a measure of the amount of secret information present in the cover image and is defined as eqn (1) and is measured in terms of bpp as described above.| |  | (1) |
where n is the number of secret bits embedded in the cover image and N is the total number of pixels. The MSE computes the average of the squared difference between pixel intensities of the cover and the stego images. Lower MSE indicates the masking of the secret image in a cover image. It gives a measure of error in the embedding process as given by eqn (2)27| |  | (2) |
the indices m and n are the length and breadth of the secret image, while I is that of the cover image, K is of stego image and i and j refer to row and column pixel, respectively.
The PSNR measures the degree of distortion in an image; a higher PSNR value indicates good embedding of the secret image as described below in eqn (3)27
| |  | (3) |
MAX is 255 for a greyscale image.
The SSIM measures the similarity between the cover image and stego image, eqn (4). A value of SSIM close to 1 indicates excellent embedding capacity.28
| |  | (4) |
where
μx and
μy are average of
x and
y,
σx2 and
σy2 are variance of
x and
y respectively,
σxy is the covariance of
x and
y.
C1 = (
K1L)
2 and
C2 = (
K2L)
2; here
L is the dynamic range of pixel values and
K1 and
K2 are constants with values 0.01 and 0.03, respectively.
Graphical analysis with histograms
An image histogram is a graphical representation of the variation of number of pixels versus pixel intensity. Histograms of cover images and encrypted images give an account of data embedding ability of the implemented algorithm. In the following sections, histograms have been used to understand the extent of distortion in the cover image after embedding the secret data.
Fab-fracs as cover media
Fractal structures can help in encryption due to their unique physical features, their three-dimensional roughness, and fine detailing at their edges and boundaries. When fractals are used as cover images, a small distortion in the corresponding stego image can easily go unnoticed. This is because the fine variation due to the characteristic feature of fractals is already present in the entire cover image. In the literature, there are very few reports that have implemented computationally generated fractals for data security. Some of these studies are tabulated in Table 2 below. These computationally generated fractals are obtained using fractal generating software that requires a sequence as an input along with some initial parameters, followed by iterative calculations, and fractal evaluation. Some popularly used software include Mandelbulb 3D and XenoDream Program. Two approaches are commonly employed to embed secret data using computationally generated fractals as cover images. In the first approach, initial fractal parameters are perturbed by the secret data and the algorithm of fractal generation is implemented. This results in a fractal with the secret data already embedded in it.29–31 In the second approach, a fractal image is first generated and is then used as a cover image to embed the secret data into it using various transformation techniques32,33 Computationally generated fractals, however, have a disadvantage as they need high-end computer resources, computational skills of the coder, and computational time to generate the fractal structure and/or embed secret data into them. As there are exact sets of parameters required to generate the fractal features, a repetitive iteration and computational skill sets can still help a hacker arrive at the fractal cover image thereby posing a possibility of breach. In contrast, for lab grown fab-fracs, it is difficult to predict local geometrical/morphological features using algorithms. As computationally generated fractals are resource intensive, the idea of using a library of fab-fracs has been proposed in this work. As fab-fracs result from non-equilibrium growth processes, their randomness is difficult to predict and very difficult to simulate with physical exactness. Thus, their reproduction with exact roughness, edge thickness, and finesse is impossible to be imitated. This eliminates the possibility of an attack as the cover image cannot be guessed/predicted. Hence, their usage in the encryption process strengthens the security cover.
Table 2 Fractals used for data securitya
| Method |
PSNR (dB) |
SSIM |
Reference |
|
NR: Not reported.
|
| Wavelet transformation |
65.0900–70.4800 |
0.9410–0.9800 |
32
|
| Wavelet transformation |
41.344–44.6110 |
NR |
33
|
| Fractal data embedding |
26.35–31.19 |
NR |
34
|
| Sierpinski gasket fractal |
34.805 |
NR |
31
|
| LSB |
36.3637–47.5897 |
NR |
35
|
| Lah transformation |
49.13–49.09 |
0.99 |
24
|
| Lah transformation using fab-fracs |
48.3770–48.6131 |
0.9932–0.9984 |
Present work |
Synthesis procedure
A facile microwave synthesis method is employed to synthesise SnO2 fractals. 0.2 M tin chloride pentahydrate (SnCl4·5H2O) and 0.2 M urea (CO(NH2)2) aqueous solutions are prepared separately and magnetically stirred for 1 hour. The 0.2 M urea solution is added dropwise into the 0.2 M tin chloride solution with constant stirring. The resultant solution is microwave irradiated using a microwave synthesizer (Scientific Microwave Synthesizer, Model: CATA-R, manufactured by Catalyst Systems, India) in four cycles with 2 min of irradiation and 2 min of cooling in a microwave oven with 595 W power. The microwaved solution results in a sol formation that is allowed to age overnight under laboratory conditions and dried in a hot air oven at 80 °C. Post drying, large-scale fractals were obtained.20 Formation of fractals of different geometries is dependent on several external parameters like pH, temperature, surface tension, nature of substrate, etc. that can be controlled externally.
Characterization techniques and computational codes
Optical images of fractals used in this work were acquired on an optical microscope with a 100X magnification (Radical-R16 camera attached to a Radical RXM-7 microscope and a Trinocular Research Microscope Model - BX53F2). For investigating phase formation and band gap estimation, the SnO2 sample was annealed at 600 °C. In all other cases, the samples were used as-is unless otherwise mentioned. The X-ray diffraction (XRD) studies were carried out using a Rigaku diffractometer fitted with a Cu-Kα source with wavelength 1.5418 Å to study phase transformation and lattice planes. The UV-Visible spectra were recorded on a Shimadzu UV-2450 spectrophotometer and Field Emission Scanning Electron Microscopy (FESEM) was performed on an FEI Nova Nano SEM 450 to study the morphology of the fractals obtained. The program codes for testing encryption were based on Python3 supported by PyCharm CE and MATLAB R2021b. The selected fractal images were resized to 512 × 512 and converted to greyscale as this step simplifies the algorithm and computational parameters for image processing. Computational codes are run to transform the secret information (image/text) to their binary and ASCII equivalents pixel-by-pixel and then hidden in a similar way in the cover media. This process leads to an impression of only the cover media being present to a normal eye and easily passes the potential vulnerabilities during data transfer.
Results and discussion
Optical imaging
Fig. 2 (a–e) shows the optical images of fractals used in this work as cover images and Fig. 2(f) is used as a secret image for image steganography. The different shapes are star-shaped fractals, dendritic structures, fern-like fractals, etc. As the fab-fracs are three-dimensional entities with unique growth patterns, they present a good variation of number of pixels against pixel intensity across the optical image. Thus, almost every value of pixel intensity is covered by some feature of the fractal geometry and in turn favours encryption.
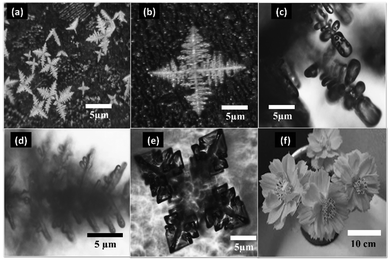 |
| | Fig. 2 (a–e) Optical images of tin oxide fab-fractals and (f) image used as a secret image. (e) is reproduced from Kamathe and Nagar, 2021, Beilstein Journal of Nanotechnology, 12, pp. 1187-1208, © 2021 Kamathe and Nagar; licensee Beilstein-Institut, an Open Access article under the terms of the Creative Commons Attribution License. (https://creativecommons.org/licenses/by/4.0). | |
Structural and morphological studies
The X-ray diffractogram in Fig. 3 shows the phase formation of SnO2 with (110), (101) and (211) prominent planes in the crystal lattice. All the observed diffraction peaks are completely indexed to the SnO2 tetragonal rutile structure. All the Miller indices are matched with the standard JCPDS Card (no. 00-041 − 1445), and no other diffraction peak is observed, which confirms that pure SnO2 is formed with a well crystalline structure. The grain size of the prepared material is found to be ∼ 20 nm by applying Scherrer's formula for the most intense peak.36,37| |  | (5) |
where D is the average crystallite size, K is the shape factor, which is a dimensionless quantity with a value taken of 0.9 but it varies according to the actual shape of the crystallite, λ is the wavelength of the incident X-ray beam, β is the full width half maximum and θ is the Bragg's angle.
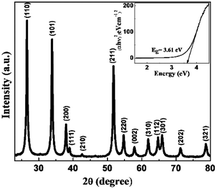 |
| | Fig. 3 X-Ray diffractogram of SnO2 fab-fracs showing peaks corresponding to different Miller indices. The inset shows the bandgap of 3.61 eV as estimated from Tauc plot. Reprinted by permission from Springer Nature Customer Service Centre GmbH: Springer, Journal of Sol–Gel Science and Technology, Large-scale growth of tin oxide fabricated fractals, Vishal Kamathe and Rupali Nagar, Copyright (2022) Springer Nature Switzerland AG, Part of Springer Nature.20 | |
The inset shows the optical bandgap plot for the sample estimating the band gap value to be 3.61 eV calculated from the Tauc plot analysis method.38,39 Direct bandgap calculation is done using eqn (6), where α is the optical absorption coefficient, hν is the photon energy, and A is a constant.
The morphological investigation was carried out and Fig. 4 shows the FESEM image of the as-synthesized fab-fracs where the square-shaped facets have been highlighted. These serve as building-blocks resulting in the final fractal structure. These structures also demonstrate that the interconnections in the case of fractals range from sub-micron to macro-scale providing variation at different length-scales.
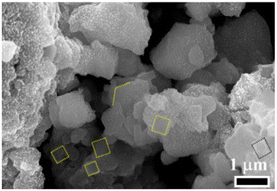 |
| | Fig. 4 Representative FESEM image of SnO2 fab-fracs showing square-shaped building blocks. Reprinted by permission from Springer Nature Customer Service Centre GmbH: Springer, Journal of Sol–Gel Science and Technology, Large-scale growth of tin oxide fabricated fractals, Vishal Kamathe and Rupali Nagar, Copyright (2022) Springer Nature Switzerland AG, Part of Springer Nature.20 | |
Image and text steganography
This section first discusses the image steganography. In the present work, Fig. 2(f) was selected as the secret image and different fab-fracs shown in Fig. 2(a–e) were used as cover images. All the images were converted to a payload capacity of 24 bpp for uniform comparison. The algorithm implemented for encryption was adopted from the work of Ghosal et al.24 The CI and SI were compared for their visual similarity, PSNR, SSIM and difference in histogram profiles. To test the effectiveness of fab-fracs as CI, two cruciform shapes were drawn, one which was flat and the other was raised/embossed. These were compared against a cruciform-shaped fab-frac. The result of encryption is shown in Fig. 5(a), (b) and (c), respectively for flat, embossed and cruciform shaped fab-fracs. While in all three cases, it is visually difficult to understand that SI contains hidden information, the PSNR and SSIM values are slightly different. However, the fluctuations captured in histogram plots for CI and SI overlap considerably well for the cruciform-shaped fab-frac as compared to sketched cruciform shapes. Fig. 5(d–g) depicts the CI and SI histograms for other geometries of fab-fracs shown as insets. Here also, the extent of the overlapping of CI and SI histograms confirms effective encryption. Table 3 below summarizes the PSNR and SSIM values for different fractal shapes.
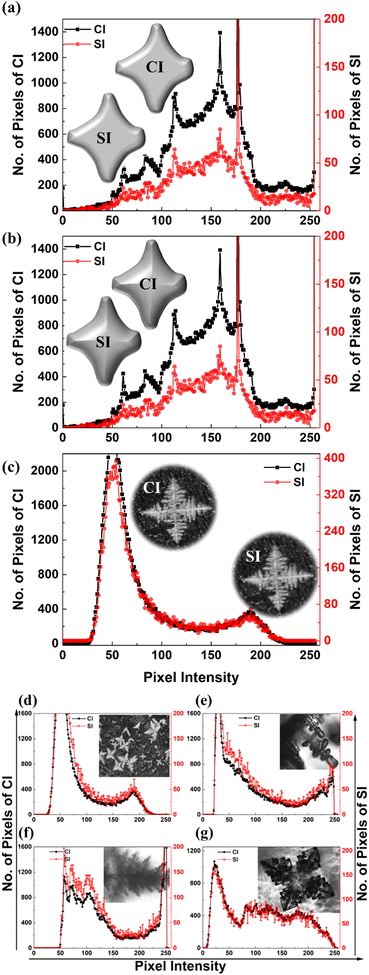 |
| | Fig. 5 (a and b) Comparison of histograms of CI and SI of flat and raised cruciform (c–g) Comparison of fab-fracs used as CI and their respective SI. PSNR value reported in decibels (dB) and SSIM values after encryption are reported. Inset optical image in (g) is reproduced from Kamathe and Nagar, 2021, Beilstein Journal of Nanotechnology, 12, pp. 1187-1208, © 2021 Kamathe and Nagar; licensee Beilstein-Institut, an Open Access article under the terms of the Creative Commons Attribution License. (https://creativecommons.org/licenses/by/4.0).22 | |
Table 3 Details of PSNR and SSIM values for cover images shown in Fig. 5 after encryption
The high PSNR (>30 dB) and SSIM (close to 1) values in Table 3 show that the fab-fracs show very good encryption. The peak signal to noise ratio after encryption has minimal noise levels and thereby has high chances that the hidden information is transferred without any suspicion. When information is wired over the internet, some information can be in the form of text only. The methodology of text encryption is different from that of image encryption. Text is hidden in the cover image using the LSB approach discussed above.26 Secret text is successfully decoded with the stego image containing the hidden message when compared to the cover image with a PSNR value of 86.18 dB and an SSIM value of 0.9999 for an image with 24 bpp payload capacity. Thus, the fab-frac images work for text-based encryption too.
Creating a library of cover media
The above analysis of image and text-based encryption shows that fab-fracs can be successfully used for encryption. However, creating a databank of cover media using fab-fracs and using time-based retrieval will increase the robustness of encryption. According to a report, the computer systems in the United States were vulnerable to system attacks every 39 seconds.40 Thus, the concept of a fractal library where fab-frac images are collected as a library databank and randomly used as CI with the passage of time adds to the randomness with the required level of variance and redundancy. The scheme is depicted below in Fig. 6. Now, as real time changes, a change of cover media yields a different stego image adding one more level of complexity thereby making encryption more efficient and difficult to decode.
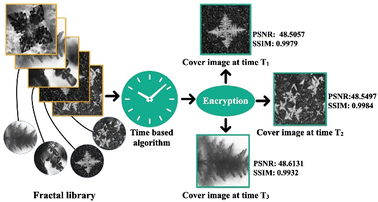 |
| | Fig. 6 Time-based random selection of cover media from a fab-frac library. | |
Comparison of fab-fracs and computationally generated fractals
Since fractals can also be generated using mathematical non-linear functions or designed graphically,41,42 it is pertinent to compare the performance of such fractals with lab-grown fab-fracs.20,22 For this purpose, graphically designed fractals were used as cover images and the encryption metrics compared with fab-fracs. For both the cases, the PSNR and SSIM values were comparable (∼48 dB), though a slight improvement in SSIM values for lab-grown fab-fracs was obtained. To design fractals graphically, one requires computer systems with high computational capabilities, graphic cards, high processor speeds and the process is time consuming. The lab-grown fab-fracs can be altered in morphology/geometry by changing the temperature, pH of the reaction mixture, material, etc. very easily. In this work, different fractal geometries could be generated in a span of five minutes with the same reaction mixture (not shown here). Therefore, the entire process of generating fab-fracs and a library of fab-fracs is a very simple process and outsmarts mathematically or graphically designed fractals. There are some other reports too where lab-grown fractals have been reported by different synthesis techniques. The interested reader is referred to other reports.6,43–52
Conclusions
In this work material science generated fab-fracs have been used as cover media for steganography encryption. The PSNR values of ∼48 dB and SSIM range of 0.993–0.998 indicate a high degree of encryption. Furthermore, the concept of a fractal library is proposed to carry out data encryption that enhances the randomness of the selected cover image in real time. As every encryption method lasts only until an attacker figures out how to break into it, it is necessary to build tools and techniques that are complex by nature and to add a time variation in it. Here, by proposing a dynamic real time fab-frac based encryption system that is independent of any computational techniques to generate the cover image, unique fingerprint-like encryption has been demonstrated that will serve as a next-generation steganography tool for a long time.
Author contributions
R. N. designed the concept and experimental work, D. S.: designed the experiments and wrote codes, and carried out analysis and manuscript writing. V. K.: designed and performed experiments and carried out data analysis. RN corrected the draft and verified the analysis.
Conflicts of interest
There are no conflicts to declare.
Acknowledgements
Authors DS and VK acknowledge SIU-JRF awarded by Symbiosis Centre for Research and Innovation, Symbiosis International (Deemed University), Pune, MH, India. The authors also acknowledge SCWRM and Advanced Manufacturing Technology Lab, Symbiosis Institute of Technology, Pune, MH, India for Optical microscope studies. RN acknowledges RSF (2022-23) support from SCRI. The authors acknowledge Mr S Hossain, Jadavpur University for debugging a line of the code used in the present work.
References
- Internet Users by Country 2022 in World Population Review, Accessed May 01, 2022, Available at https://worldpopulationreview.com/country-rankings/internet-users-by-country, 2022.
-
E. Luiijf, in Cyber Crime and Cyber Terrorism Investigator's Handbook, ed. B. Akhgar, A. Staniforth and F. Bosco, Syngress, 2014, pp. 19–29 DOI:10.1016/B978-0-12-800743-3.00003-7.
-
P. K. Martin, NASA Cybersecurity: An Examination of the Agency's Information Security, 2012 Search PubMed.
- A. Artiningsih and A. S. Sasmita, Jurnal Universitas Paramadina, 2016, 13, 1476–1496 Search PubMed.
-
A. Shehod, Ukraine Power Grid Cyberattack and US Susceptibility: Cybersecurity Implications of Smart Grid Advancements in the US, Massachusetts Institute of Technology, 2016.
- A. Y.-T. Wang, R. J. Murdock, S. K. Kauwe, A. O. Oliynyk, A. Gurlo, J. Brgoch, K. A. Persson and T. D. Sparks, Chem. Mater., 2020, 32, 4954–4965 CrossRef CAS.
- K. Choudhary, B. DeCost, C. Chen, A. Jain, F. Tavazza, R. Cohn, C. W. Park, A. Choudhary, A. Agrawal, S. J. L. Billinge, E. Holm, S. P. Ong and C. Wolverton, npj Comput. Mater., 2022, 8, 1–26 CrossRef.
- J. Schmidt, M. R. G. Marques, S. Botti and M. A. L. Marques, npj Comput. Mater., 2019, 5, 83 CrossRef.
- I. A. Baburin, A. Klechikov, G. Mercier, A. Talyzin and G. Seifert, Int. J. Hydrogen Energy, 2015, 40, 6594–6599 CrossRef CAS.
- R. Nagar, B. P. Vinayan, S. S. Samantaray and S. Ramaprabhu, J. Mater. Chem. A, 2017, 5, 22897–22912 RSC.
- K. Raagulan, B. M. Kim and K. Y. Chai, Nanomaterials, 2020, 10(4), 702 CrossRef CAS PubMed.
-
B. B. Mandelbrot, The Fractal Geometry of Nature, Henry Holt and Company, 1983, 173 of Einaudi paperbacks Search PubMed.
- S. Tarafdar, A. Franz, C. Schulzky and K. H. Hoffmann, Phys. A, 2001, 292, 1–8 CrossRef.
- S. Tarafdar, Y. Y. Tarasevich, M. Dutta Choudhury, T. Dutta and D. Zang, Adv. Condens. Matter Phys., 2018, 2018, 5214924 Search PubMed.
- V. S. Ivanova, I. J. Bunin and V. I. Nosenko, JOM, 1998, 50, 52–54 CrossRef CAS.
- G. A. Losa, Medicographia, 2012, 34, 364–374 Search PubMed.
- L. M. Sander, Nature, 1986, 322, 789–793 CrossRef.
- S. K. Abd-El-Hafiz, A. G. Radwan, S. H. A. Haleem and M. L. Barakat, IET Image Process., 2014, 8, 742–752 CrossRef.
- H. V. Desai and A. A. Desai, Int. J. Comput. Sci. Eng. Inf. Technol. Res., 2014, 4, 71–80 Search PubMed.
- V. Kamathe and R. Nagar, J. Sol–Gel Sci. Technol., 2022, 101, 477–483 CrossRef CAS.
- A. Capocefalo, T. Bizien, S. Sennato, N. Ghofraniha, F. Bordi and F. Brasili, Nanomaterials, 2022, 12(9), 1529 CrossRef CAS PubMed.
- V. Kamathe and R. Nagar, Beilstein J. Nanotechnol., 2021, 12, 1187–1208 CrossRef CAS PubMed.
- D. Sarmah and A. Kulkarni, Arabian J. Sci. Eng., 2017, 43, 1–24 Search PubMed.
- S. K. Ghosal, S. Mukhopadhyay, S. Hossain and R. Sarkar, Trans. Emerging Telecommun. Technol., 2021, 32, e3984 Search PubMed.
- G. Indira Devi and V. N. Sireesha, VSRD Int. J. Electr. Commun. Electron. Eng., 2018, 8, 2231–3346 Search PubMed.
-
A. Sridhar, LSB based Image steganography using MATLAB, 2021, https://www.geeksforgeeks.org/lsb-based-image-steganography-using-matlab/.
- U. Sara, M. Akter and M. Uddin, J. Comput. Commun., 2019, 7, 8–18 CrossRef.
-
J. Nilsson and T. Akenine-Möller, Understanding SSIM, 2020, arxiv.org/abs/2006.13846.
-
S. S. Agaian and J. M. Susmilch, Fractal steganography using artificially generated images, Region 5 Conference, IEEE, 2006, pp. 312–317.
-
P. Davern and M. Scott, Fractal based image steganography, Berlin, Heidelberg, 1996 Search PubMed.
- C. Rupa, J. Inst. Eng. (India): Ser. B, 2013, 94, 147–151 Search PubMed.
- A. Durafe and V. Patidar, J. King Saud Univ. – Comput. Inf. Sci., 2022, 34, 4483–4498 Search PubMed.
- Y. Wu, Int. J. Innovation Technol. Manage., 2012, 285–289 CAS.
-
O. Sheluhin and D. Magomedova, Proceeding of the 24th Conference of Fruct Association, 2020 DOI:10.5772/intechopen.92018.
- M. Juneja and P. S. Sandhu, Int. J. Network Secur., 2014, 16, 452–462 Search PubMed.
- H. Letifi, D. Dridi, Y. Litaiem, S. Ammar, W. Dimassi and R. Chtourou, Catalysts, 2021, 11, 803–825 CrossRef CAS.
- J. Zhang, S. Ma, B. Wang and S. Pei, J. Alloys Compd., 2021, 886, 161299 CrossRef CAS.
- M. Karmaoui, A. B. Jorge, P. F. McMillan, A. E. Aliev, R. C. Pullar, J. A. Labrincha and D. M. Tobaldi, ACS Omega, 2018, 3, 13227–13238 CrossRef CAS PubMed.
- W. Zhou, Y. Liu, Y. Yang and P. Wu, J. Phys. Chem. C, 2014, 118, 6448–6453 CrossRef CAS.
-
D. Ramsbrock, R. Berthier and M. Cukier, presented in part at the Proceedings of the 37th Annual IEEE/IFIP International Conference on Dependable Systems and Networks, 2007.
- M. Khan, F. Masood and A. Alghafis, Neural Comput. Appl., 2020, 32, 11837–11857 CrossRef.
- V. Sangavi and P. Thangavel, Procedia Comput. Sci., 2019, 165, 462–469 CrossRef.
- J.-H. Jeun, D.-H. Kim and S.-H. Hong, Mater. Lett., 2013, 105, 58–61 CrossRef CAS.
- Y. M. Sabri, A. E. Kandjani, S. S. A. A. H. Rashid, C. J. Harrison, S. J. Ippolito and S. K. Bhargava, Sens. Actuators, B, 2018, 275, 215–222 CrossRef CAS.
- G. Bailly, J. Rossignol, B. de Fonseca, P. Pribetich and D. Stuerga, Procedia Eng., 2015, 120, 764–768 CrossRef CAS.
- F. Fan, Y. Feng, P. Tang, A. Chen, R. Luo and D. Li, Ind. Eng. Chem. Res., 2014, 53, 12737–12743 CrossRef CAS.
- N. Zhang, K. Yu, Q. Li, Z. Zhiqiang and Q. Wan, J. Appl. Phys., 2008, 103, 104305 CrossRef.
- I. Simon, A. Savitsky, R. Mülhaupt, V. Pankov and C. Janiak, Beilstein J. Nanotechnol., 2021, 12, 343–353 CrossRef CAS PubMed.
- Y. Qin, Z. Wang, D. Liu and K. Wang, Mater. Lett., 2017, 207, 29–32 CrossRef CAS.
- B. Xiao, D. Wang, F. Wang, Q. Zhao, C. Zhai and M. Zhang, Ceram. Int., 2017, 43, 8183–8189 CrossRef CAS.
- Y. Zhao, Y. Xie, X. Zhu, S. Yan and S. Wang, Chem. – Eur. J., 2008, 14, 1601–1606 CrossRef CAS PubMed.
- S. Bai, L. Sun, J. Sun, J. Han, K. Zhang, Q. Li, R. Luo, D. Li and A. Chen, J. Colloid Interface Sci., 2021, 587, 183–191 CrossRef CAS PubMed.
|
| This journal is © The Royal Society of Chemistry 2022 |
Click here to see how this site uses Cookies. View our privacy policy here.  Open Access Article
 *
*


