
 Open Access Article
 This Open Access Article is licensed under a Creative Commons Attribution-Non Commercial 3.0 Unported Licence
Emission colours of bistable photochromic compounds: Ce-doped alkaline (Rb, K, Na)–indium fluorides†
Manuel
Gaudon
*a,
Ines
Andron
a,
Alain
Demourgues
a,
Vincent
Rodriguez
 b,
Alexandre
Fargues
a,
Etienne
Durand
a,
Anthony
Chiron
a,
Christine
Frayret
cd and
Véronique
Jubera
*a
b,
Alexandre
Fargues
a,
Etienne
Durand
a,
Anthony
Chiron
a,
Christine
Frayret
cd and
Véronique
Jubera
*a
aUniv. Bordeaux, CNRS, Bordeaux INP, ICMCB, UMR 5026, F-33600, Pessac, France. E-mail: manuel.gaudon@icmcb.cnrs.fr; veronique.jubera@u-bordeaux.fr
bInstitut des Sciences Moléculaires, UMR 5255 CNRS, Université de Bordeaux, 351 Cours de la Libération, F-33405, Talence Cedex, France
cLaboratoire de Réactivité et Chimie des Solides, UMR CNRS 7314, Université de Picardie Jules Verne, Hub de l’Energie, 15 Rue Baudelocque, 80000, Amiens Cedex, France
dRéseau sur le Stockage Electrochimique de l’Energie (RS2E), France
First published on 26th July 2022
Abstract
The structural and spectroscopic properties of three Ce3+-doped A3InF6 compounds (with A+ = Rb+, K+, Na+) are investigated. Containing indium, they all exhibit 2Ce3+ + In3+ ⇔ In+ + 2Ce4+ redox processes induced by UV irradiation between Ce3+ and In3+ cations. The photochromo-luminescent behaviour and associated kinetics, with the Ce3+ and In+ ion emission quenching through the redox equation, respectively, are investigated. Our studies highlight that different mechanisms (surface vs. bulk) need be considered to explain the decrease in the blue (Ce3+) and orange (In+) emission curves. Moreover, the comparison of Ce3+-doped Rb2KInF6, K2NaInF6 elpasolites and K3InF6 cryolite spectral distributions shows that changing the nature of the alkali cation makes colour tuning possible. The shift of the Ce3+ and In+ colour emissions between the three as-prepared compounds is mainly due to the variation in the ionic-covalent nature of the chemical bonds around the active cation sites. The final calculated optical difference between the two bistable states varies from 0.31 to 0.48 depending on the alkali subnetwork.
1. Introduction
As photochromism can be defined as the ability of a compound to change its colouration under UV or visible irradiation [⋯], the photochromoluminescence property is herein defined as the ability of the studied inorganic fluorides to reversibly change their emissive colouration resulting from UV irradiation. Hence, in photochromoluminescent materials, the A colour emission state is shifted to the B colour emissive state from irradiation at a λA wavelength (forth-irradiation), whereas reversibly, the B state can return to the A state from irradiation at a λB wavelength (back-irradiation). Such compounds can be developed in view of various applications, such as information storage,1–3 UV sensors,4 and security inks.5The studied compounds are inorganic indium-based fluorides, with a double perovskite-type structure, constituted mainly on alkali–fluorine ionic bonds with the general formula A2BKInF6 (A and B being alkaline elements).6 Compounds were doped with trivalent cerium in substitution of trivalent indium, with a substitution concentration of 2 mol%. Both cerium and indium ions are present at the source of the potential modulation in the emission of the Ce-doped fluorides. Indeed, in such inorganic fluorides: RE-doped A2BKInF6 series (RE: rare earth element), a redox process can be produced between cerium and indium cations, as demonstrated by Chaminade et al.,7 or more recently developed by Cornu et al.8,9 It was shown in the last former article that the UV irradiation of Ce3+-doped Rb2KInF6 elpasolite-type compounds induces a reversible redox process.
Under UV irradiation at 315 nm, the progressive disappearance of two Ce3+ ions in favour of the appearance of one In+ cation is associated with the Ce3+ blue emission quenching and the increase in the orange In+ emission (forth-irradiation). A reversible phenomenon is observed under material irradiation at 255 nm (back-irradiation). A nice on–off effect of the Ce3+/In+ cation emission is obtained; the cycling of this redox process has been checked over 5 cycles under UV irradiation; and the stability of both Ce3+–In3+ (A state) and Ce4+–In+ (B state) states was confirmed over 10 years.9
In this paper, attempts to observe a redox phenomenon similar to that in Ce-doped Rb2KInF6 compounds have been performed on the structurally close compounds: Ce-doped K2NaInF6 elpasolite and Ce-doped K3InF6 cryolite. One target is to tune the colour contrast between the two states (forth- and back-irradiation) in this series. The studied halide compounds are all related to the perovskite structure. The latter are generally studied for their wide range of physical properties, such as ferroelectricity, dielectricity, pyroelectricity and piezoelectricity.10 The crystallographic structure of the three as-prepared compounds (Ce-doped Rb2KInF6 was again prepared as a reference) was studied by X-ray diffraction and Raman spectroscopy in the first part. In the second part, the luminescence properties of the cerium or indium luminescent centres in these three compounds are compared and interpreted based mainly on the Stokes shift consideration.11 The kinetic mechanism of Ce3+ luminescence quenching (forth redox) and In+ luminescence (back redox) quenching is deeply investigated.
2. Experimental
The elpasolite/cryolite compounds were prepared from the solid-state route in sealed tubes.α-InF3 was issued from direct fluorination using diluted F2 (10%, Ar filled) gas treatment at T = 450 °C during 6 hours of InF3·xH2O, hydrated fluorides, which were prepared from a coprecipitation process.
The reagents RbF, KF, NaF, CeF3 fluorides (commercial compounds, Aldrich) and InF3 used for the synthesis were hygroscopic, so they were previously treated at 110 °C for 3 hours under vacuum to remove all traces of water and then placed in a glove box (BAG). The reagents were then weighed in stoichiometric proportions and ground in an agate mortar. They were introduced into a clamped argon atmosphere glove box and sealed platinum tube to prevent any air entry. The tube was placed in a muffle furnace and heat-treated at 700 °C for 12 hours.
Powder X-ray diffraction patterns were collected on a Philips X’Pert MPD X-ray diffractometer with a Bragg–Brentano geometry using Cu Kα1,2 radiation (10° < 2θ < 130°, step 0.02° and counting time of 30 seconds). The diffractograms were refined using the Rietveld refinement method with the conventional reliability factors for refinement quality assessment. The Fullprof program package was used. Unit-cell parameters, zero-shift, peak profile parameters, atomic positions and isotropic displacement factors were refined; however, occupancies were fixed equal to the target composition.
Raman spectra were recorded at room temperature on a Xplora confocal Raman microscope from Horiba Scientific (objective 50×, NA = 0.50) using a CW 532 nm laser excitation. The laser power was less than 15 mW for all samples. The spectrometer includes a grating with 2400 grooves per mm and an air-cooled CCD camera for detection. Unpolarized Raman spectra were measured over the frequency range 150–750 cm−1 with a spectral resolution better than 3 cm−1. The spectral range below 150 cm−1 has been deliberately rejected because the longpass edge filter for the collection of the Raman Stokes signal strongly disturbs the profile and the intensities of the peaks possibly present in this range.
The photoluminescent properties were analysed using a Fluorolog 3 Horiba spectrofluorimeter connected by a 450 W continuous Xenon source. Raw data were corrected for the experimental parameters: variation of the incident flux, monochromator transmission and photomultiplier sensitivity.
3. Results and discussion
3.1 Structural investigation
Perovskite designates any ABX3 structural material, formed on the basis of a three-dimensional network of corner-sharing BX6 octahedra in all three spatial directions and with large A cations occupying all cuboctahedral cavities, delimited by the eight BX6 octahedra (Fig. 1).12 The studied halogenated perovskites have the generic formula A2BB′F6 with a strict alternation of the B (Na+ or K+) and B′(In3+) cations that causes the doubling of the lattice parameter (ordered double perovskites). The Rb2KInF6 (labelled Rb2K) and K2NaInF6 (labelled K2Na) compounds both crystallize in this so-called elpasolite structure. Finally, a special case of elpasolite is the A3BX6 cryolite (named after the Na3AlF6 archetypal mineral), in which the A atoms occupy half of the octahedra and all cuboctahedron sites, as for the K3InF6 (labelled K3) compound.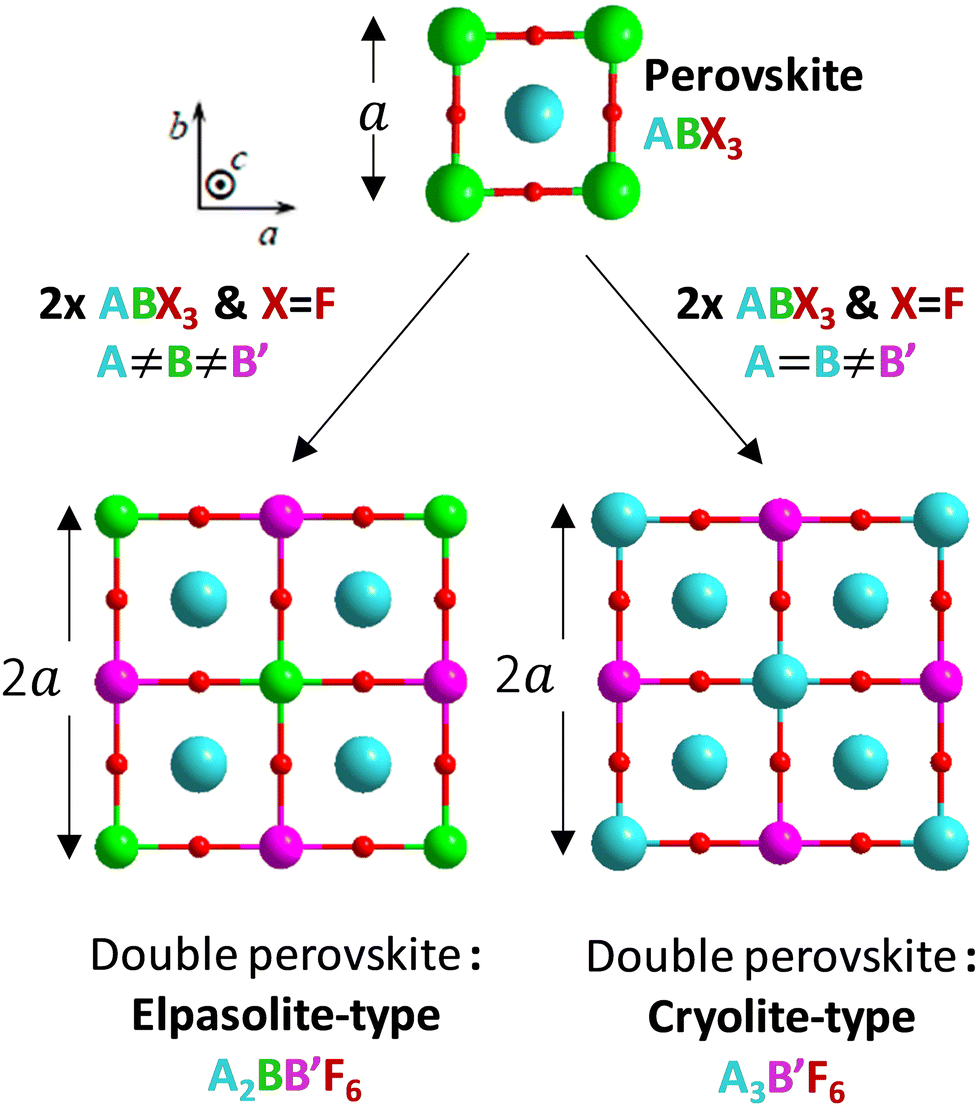 | ||
| Fig. 1 Structural filiations linking the perovskite framework and the two studied double perovskite types: elpasolite-type and cryolite-type. | ||
The X-ray diffraction patterns of the three studied compounds are depicted in Fig. 2. The as-quoted Rb2K and K2Na compounds both crystallize in the Fm![[3 with combining macron]](https://www.rsc.org/images/entities/char_0033_0304.gif) m space group, as already attested by the literature (ICSD files 00-048-1754 and 00-023-1361, respectively, for Rb2K and K2Na). Moreover, the clear right-shift of the peak positions of the K2Na phase with respect to the Rb2K phase already shows that the unit-cell parameter of the first is the smallest. The K3 compound has a peak series that seems to coincide with the 01-072-1763 file (Fd space group), but the peak assignment is not fully satisfying and deserves deeper investigation.
m space group, as already attested by the literature (ICSD files 00-048-1754 and 00-023-1361, respectively, for Rb2K and K2Na). Moreover, the clear right-shift of the peak positions of the K2Na phase with respect to the Rb2K phase already shows that the unit-cell parameter of the first is the smallest. The K3 compound has a peak series that seems to coincide with the 01-072-1763 file (Fd space group), but the peak assignment is not fully satisfying and deserves deeper investigation.
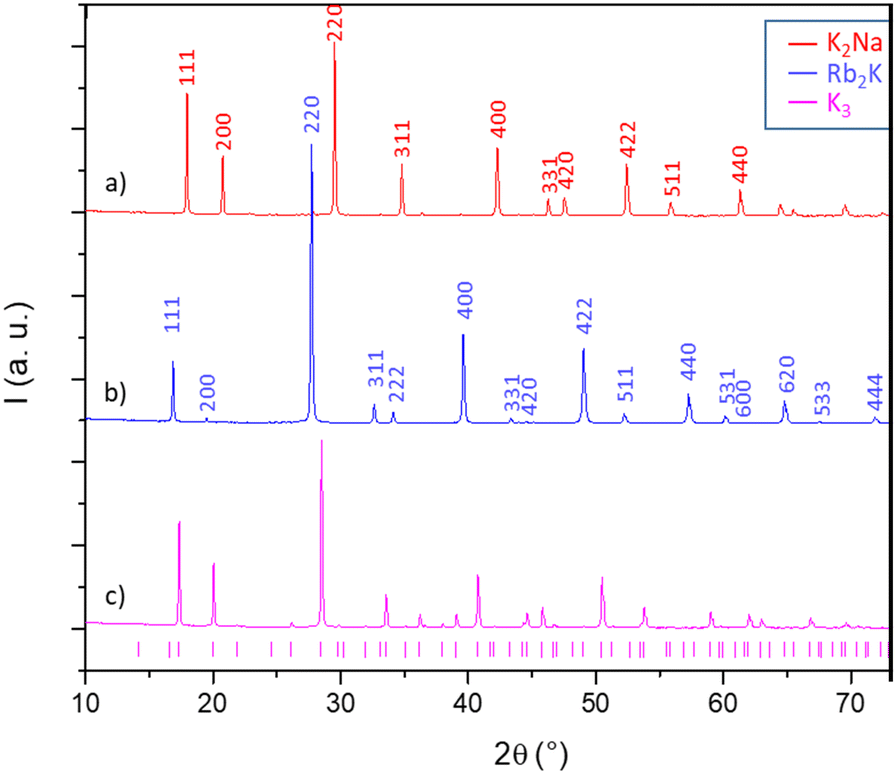 | ||
| Fig. 2 X-Ray diffraction patterns of the three studied compounds: (a) K2Na, (b) Rb2K (both with Fmm space group) and (c) K3 (with intermediate peak indexation corresponding to Fd space-group for the latter). | ||
In the A2BB′F6 investigated compositions, the ionic radius into octahedral sites, either the B ions (1.38 Å, 1.02 Å, for K+ and Na+, respectively) or the B′ ions (0.8 Å for In3+), are too high compared to the radii of A cations, which are located in cuboctahedral sites (1.72 Å and 1.64 Å for Rb+ and K+, respectively). Both the compound frameworks are subjected to internal stresses associated with a Goldschmidt tolerance factor, less than 1, causing the tilting of the octahedra chains to satisfy the valence of the whole cation set.13 As previously shown in our former study devoted to Rb2K compound,8,9 considering a Fmm cubic system for the first two compounds (K2Na, Rb2K), the octahedra rotation results in a positioning of the fluorine ions in the 96j Wyckoff position, with an equiprobable random occupancy of a quarter compared to the 24e position located on the In–B–In axes. The 96j fluorine position is distinguished from the 24e position by off-centering the In–B–In axes by a distance that is characterized by the fluorine z coordinate.
The K3 compound has a Goldschmidt factor significantly lower than 1 (t = 0.868), and therefore, a lower symmetry than the Fmm cubic cell is expected.14 From Glazer theory and the fixed symmetry relations between space groups, we assumed that the K3 phase could crystallize in a cell with an I4/m space group. Furthermore, this space group corresponds to the low-temperature polymorph of Rb2K.15 Refinements were performed maintaining a “doubled” c parameter with respect to the Fmm elpasolite unit-cell. However, the refinement leads to low reliability factors. Thus, a full resolution of the K3 crystalline framework is proposed with the I4/m space group. There are four positions for indium atoms and three positions for potassium atoms. The twelve-coordinated potassium atoms are located in two different 16i positions. Finally, there are ten positions for fluorine atoms. The indium and potassium octahedra constituting the I4/m double-cell of the K3 compound are depicted in Fig. 3, and each distinct octahedron (peculiar Wyckoff position) is represented by a different edge colour.
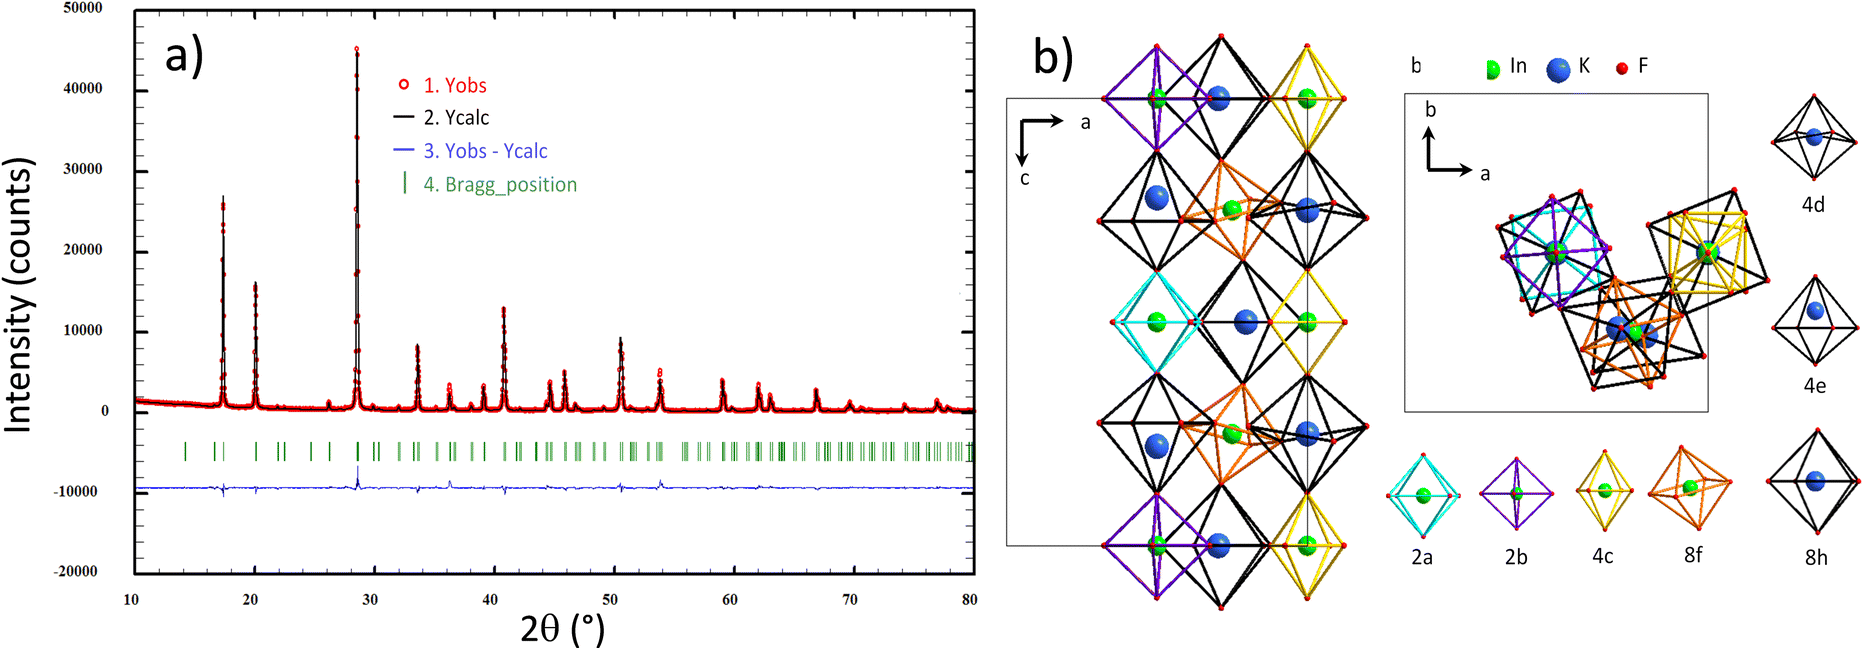 | ||
| Fig. 3 Rietveld refinement considering the I4/m space group for the K3 compound (a) and representation of all B and B′ cationic sites and their crystallographic subframework for the K3 compound (b). | ||
Table 1 summarizes the refined parameters and reliability factors of the structural hypotheses carried out for fluorine ions at position 24e or 96j on Rb2K and K2Na, considering the just previously defined I4/m double-cell for K3 (detailed atomic positions for this latter compound are reported in Table S1a, ESI†)
| F atom position | Rb2K – Fmm |
K2Na – Fmm |
K3 – I4/m | ||
|---|---|---|---|---|---|
| 24e | 96j | 24e | 96j | ||
| a (Å) | 9.0922(3) | 9.0921(2) | 8.5468(2) | 8.5450(3) | (a√2) 12.5095(3) |
| c (Å) | — | — | — | — | (2a) 17.6890(7) |
| x(F) | 0.2317(4) | 0.2317(3) | 0.2438(4) | 0.245(4) | Detailed atomic positions – see Table S1 (ESI) |
| z(F) | 0 | 0.041(1) | 0 | 0.045(1) | |
| V (Å3) | 751.64(3) | 751.60(4) | 624.33(3) | 623.95(3) | 2769.9(3) (Z = 16) |
| B iso(A) (Å2) | 2.70(5) | 2.84(5) | 1.73(6) | 1.75(6) | 0.83(4) all cations together |
| B iso (B) (Å2) | 1.3(10) | 1.27(9) | 1.3(1) | 0.86(2) | |
| B iso(B′) (Å2) | 0.89(4) | 0.97(4) | 0.39(4) | 0.54(3) | |
| B iso(F) (Å2) | 7.2(1) | 3.3(2) | 4.8(1) | 1.3(2) | 1.0(2) |
| R p | 11 | 10.8 | 14.1 | 13.4 | 10.1 |
| R wp | 11.3 | 10.8 | 15.2 | 14.4 | 11.2 |
| Bragg R-factor | 5.35 | 3.43 | 4.12 | 2.98 | 4.27 |
| Chi2 | 7.05 | 4.91 | 8.74 | 7.83 | 4.62 |
| Scorr | 3.5 | 3.4 | 2.9 | 2.9 | 3.2 |
| Goldschmidt (t) | 0.891 | 0.938 | 0.868 | ||
Obviously, the unit-cell volume per unit formula (Z) is directly related to the alkaline ionic size of the compounds; thus, the equivalent unit-cell volume (Z = 4) decreases from Rb2K (V = 751.6 Å3, Z = 4), then K3 (V/4 = 692.47 Å3, Z = 16), and finally to K2Na (V = 623.95 Å3, Z = 4).
For the first two compounds (Rb2K and K2Na), the positioning of fluorine in the 96j position instead of the 24e position makes it possible to significantly reduce the reliability factor values for the two systems. We also observe a decrease in the Biso isotropic displacement factors associated with fluorine ions. The fluorine atom is closer to the position x = 0.25 (midpoint between the B and the B′ cation) for the K2Na phase than for Rb2K.
For the K3 sample, a very complex framework based on multiple octahedral sites was evidenced. There are indeed 3 kinds of octahedron sequences along the c axis and 3 successive layers of atoms in the (ab) plane (Fig. 3b). Along the c axis, the potassium and indium octahedra generally tilt in the opposite direction from each other, as also observed for the neighbouring octahedra within each layer.
Raman spectroscopy studies of the InF6 entities were undertaken to complete the X-ray diffraction studies. This optical spectroscopy is particularly sensitive to bond vibrations and allows the instantaneous environment of each ion to be probed, including dynamic distortions at short time scales down to a few tens of femtoseconds (fs). As a reminder, both the Rb2K and K2Na phases exhibit a single Wyckoff position for indium and potassium ions. The InF6 octahedral sites are perfectly regular.16 In contrast, according to previous X-ray diffraction studies, for the K3 compound, the different octahedral sites show strong disparities in their geometry. In the three samples, the InF6 octahedral sites show 3 active Raman modes: ν1 (A1g), ν2 (Eg) and ν5 (F2g). The doubly degenerated antisymmetric valence vibration ν2 (Eg) has a very low intensity at approximately 380 cm−1. Therefore, we have concentrated our analysis on the two other vibration modes: they correspond to the three degenerate ν5 (F2g) shear modes and the nondegenerate ν1 (A1g) breathing mode. Whether for the ν5 (F2g) (Fig. 4) or ν1 (A1g) (Fig. 5) vibration mode, the same observations leading to the same conclusions can be formulated. For these two vibration modes, the Raman intensity profiles of the compounds K2Na and Rb2K are perfectly refined by considering that the vibration band comes from a single Gaussian contribution. However, the two vibration signals of the K3 compound fit better by considering the band resulting from the convolution of at least three Gaussian contributions (the Chi2 value is drastically decreased from 7.064 to 0.639, while 3 Gaussian contributions are taken into account for the fitting). This Raman analysis therefore clearly reflects the great disparity of In sites and In–F distances in cryolite-type structures.
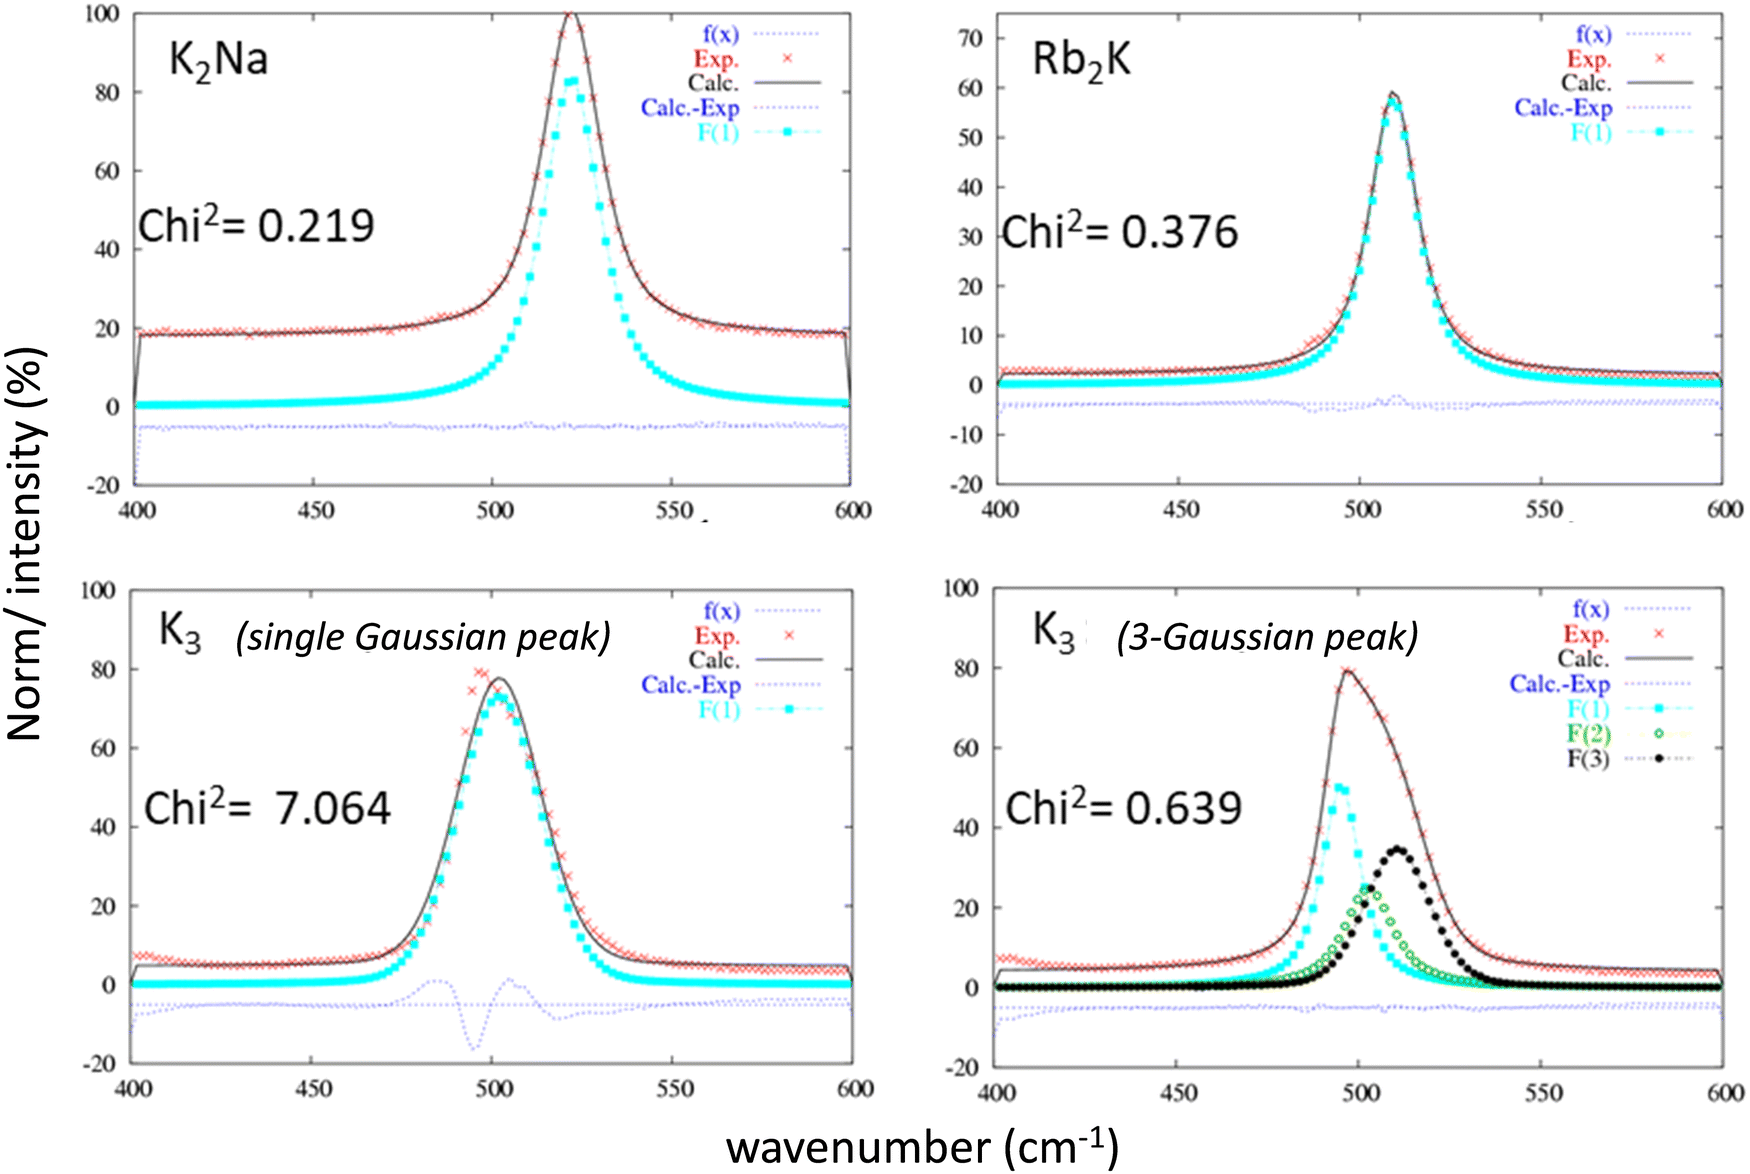 | ||
| Fig. 4 Refinement of the ν5 (F2g) vibration band attributed to each of the three studied compounds considering a single Gaussian peak or a 3-Gaussian peaks for the K3 compound. | ||
 | ||
| Fig. 5 Refinement of the ν1 (A1g) vibration band attributed to each of the three studied compounds considering a single Gaussian peak or a 3-Gaussian peak for the K3 compound. | ||
The parameters extracted from the refinement of the ν5 (F2g) and ν1 (A1g) bands for the three studied compounds are listed in Table 2. Two additional observations can be made, considering that the frequency of vibration mode is higher than this one: (i) the respiration mode is strongly constrained by the presence of sodium Na+ instead of K+ on site B (position at 522 cm−1 for K2Na, approximately 502–509 cm−1 for Rb2K and K3); (ii) the shear mode is strongly relaxed by the presence of Rb+ ions instead of K+ on site A (218 cm−1 for Rb2K instead of 230–233 cm−1 for K3 and K2Na).
| Refined parameters | K2Na | Rb2K | K3 | K3 | |||
|---|---|---|---|---|---|---|---|
| 1-Gaussian envelope | 3-Gaussian envelope | ||||||
| d(In–F)moy (Å) | 2.12(1) | 2.14(1) | 2.13(1) | 2.13(1) | |||
| ν 5 (F2g) | Position (cm−1) | 233 | 218 | 230 | 218 | 230 | 242 |
| Width (cm−1) | 14 | 16 | 27 | 26 | 15 | 33 | |
| Intensity (a.u.) | 1.2 | 0.9 | 1.1 | 0.7 | 1.1 | 0.6 | |
| ν 1 (A1g) | Position (cm−1) | 522 | 509 | 502 | 495 | 502 | 511 |
| Width (cm−1) | 19 | 16 | 27 | 13 | 16 | 21 | |
| Intensity (a.u.) | 1.2 | 0.9 | 1.1 | 1.3 | 0.7 | 0.9 | |
3.2 Luminescence properties: photochromoluminescence.
Doped with 2% (molar substitution at the indium site) cerium ions, Rb2K, K2Na elpasolites and K3 cryolite present 4f → 5d electronic transitions under UV irradiation. Fig. 6 shows the corresponding excitation and emission graphs normalized at the maximum. Table 3 lists the Stokes shift values calculated as the wavenumber difference (cm−1) between the maximal intensity of the lowest 5d(T2g) excitation level and the corresponding 4f(2F5/2) arrival level. The emission band is clearly constituted from the overlapping of two Gaussian contributions, indexed to the 5d(T2g) → 4f(2F5/2) and 5d(T2g) → 4f(2F7/2) transitions. The deconvolution of the K3 emission is reported as an illustration (Fig. 6c). Energy differences of 2897 cm−1, 2347 cm−1 and 2424 cm−1 for Rb2K, K2Na and K3, respectively, are observed, in agreement with the expected value resulting from the splitting of the two Ce3+ 4f levels by spin orbit coupling.17 Regardless of the nature of the host lattice, the maximum of the excitation band is located at approximately 313 nm, which indicates a very weak difference in the crystal field effect on the 5d orbital splitting. However, the global emission is significantly shifted to the highest energy versus the decrease in the alkali size (as a reminder, rRb[6/12] = 1.52/1.72 Å; rK[6/12] = 1.38/1.64 Å; rNa[6/12] = 1.02/1.39 Å). Thus, the Rb2K and K2Na emission bands peak at 485 nm and 423 nm, respectively. The K3 emission is maximum at 435 nm. The corresponding trichromatic x, y, z coordinates associated with luminescence colouration are indicated in Fig. 6b (colour panels are also proposed due to the conversion of xyz parameters into the RGB system).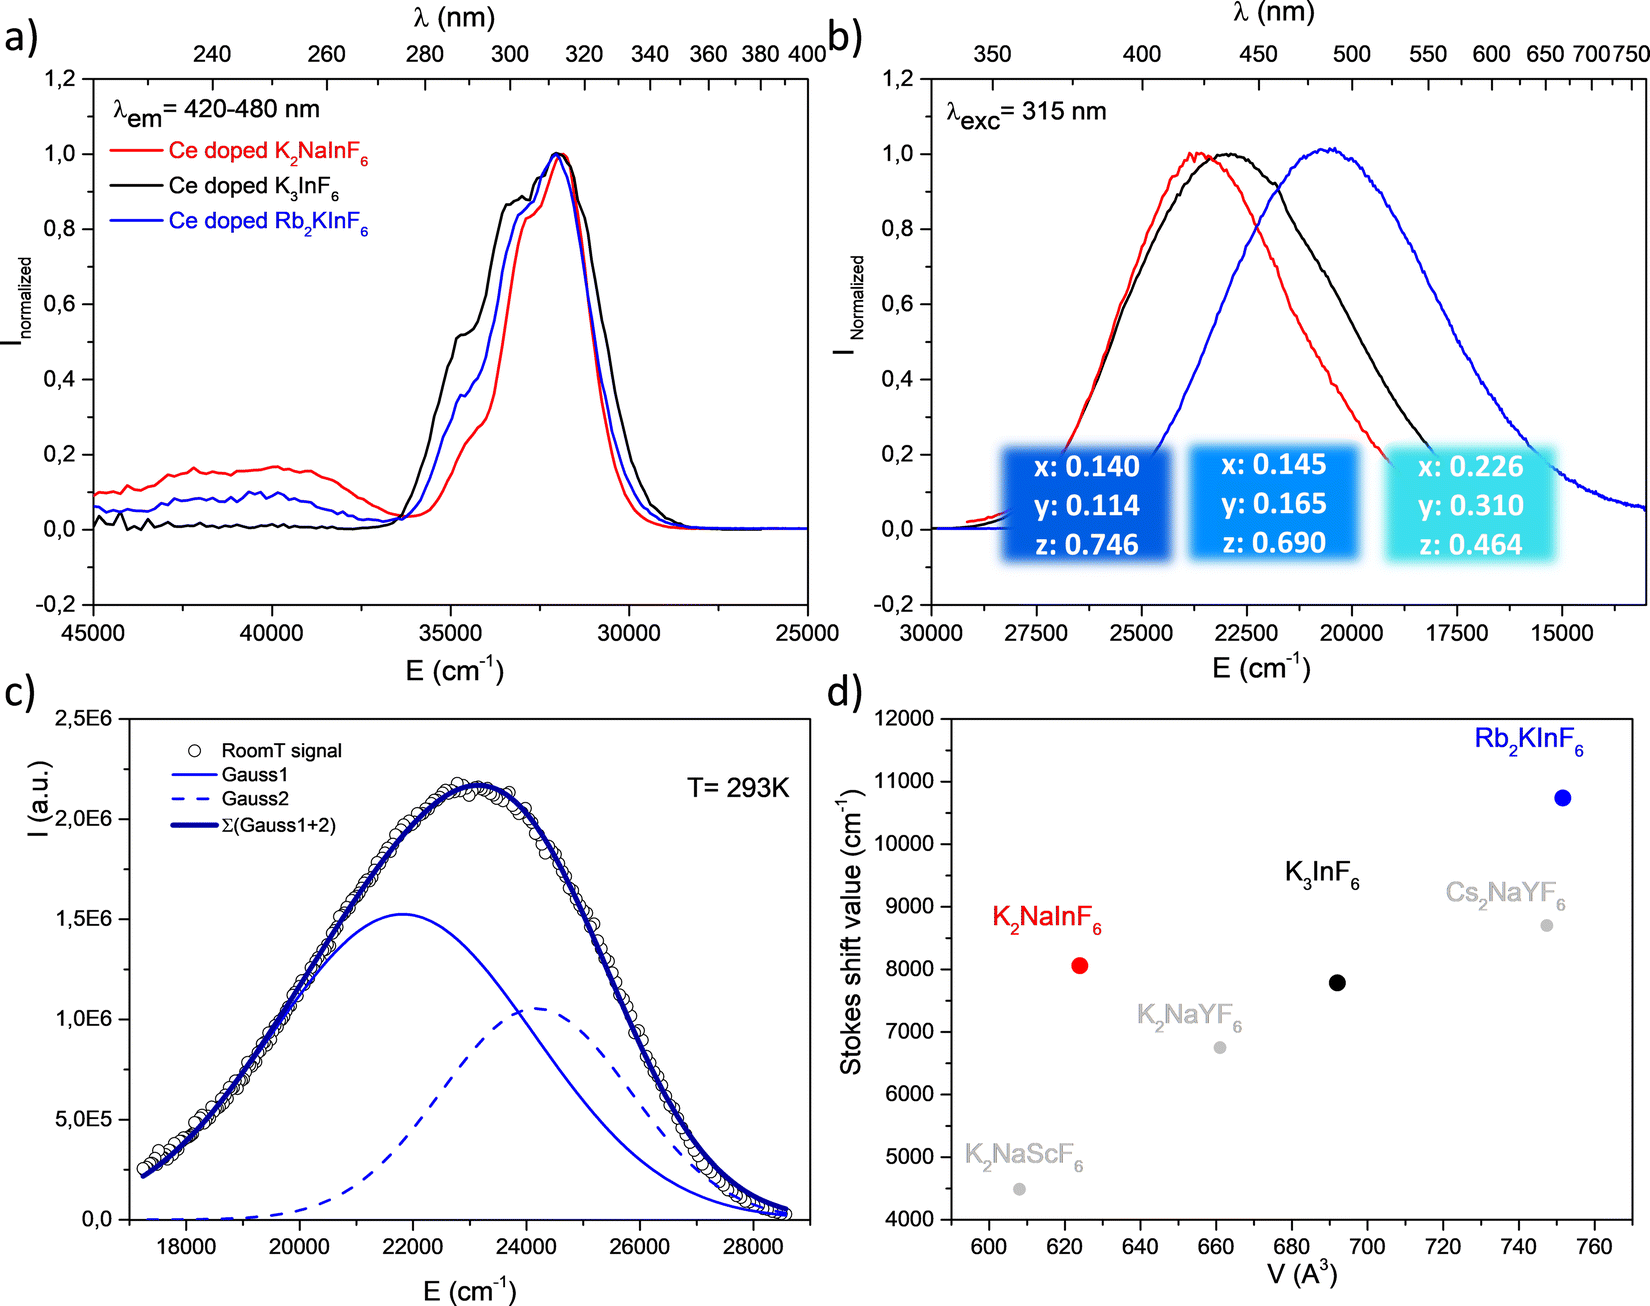 | ||
| Fig. 6 Excitation spectra (a), emission spectra and corresponding colour coordinates (b), deconvolution of the emission spectra into two 5d(T2g) → 2F7/2 and 5d(T2g → 2F5/2) bands at room temperature of K3 (c) and Stokes shift of Ce3+ doped-fluoride compounds (d). | ||
| Compound | V(Z = 4) (Å3) | λ ex max T2g (cm−1) | λ em max (cm−1) | T2g → 2F5/2 (cm−1) | T2g → 2F7/2 (cm−1) | Δ SS (cm−1) | ΔE (cm−1) 2F5/2 ↔ 2F7/2 |
|---|---|---|---|---|---|---|---|
| K2Na | 623.95(3) | 31![[thin space (1/6-em)]](https://www.rsc.org/images/entities/char_2009.gif) 949 (313 nm) 949 (313 nm) |
23641 (423 nm) |
23891 (419 nm) |
21467 (466 nm) |
8058 | 2424 |
| *K3 | 692.01(8) | 31949 cm−1 (313 nm) |
22989 (435 nm) |
24165 (414 nm) |
21818 (458 nm) |
7784 | 2347 |
| Rb2K | 751.60(4) | 31949 cm−1 (313 nm) |
20619 (485 nm) |
21212 (471 nm) |
18315 (546 nm) |
10737 |
2897 |
Stokes shift values (ΔSS) follow the order ΔSS Rb2K > ΔSS K2Na > ΔSS K3. The standard deviation of the In–F distances at the Ce3+ site is equal to 0.01 Å (Table 2); this parameter cannot explain such an evolution. ΔSS reflects both the variation of the equivalent unit cell volumes (Rb2K > K3 > K2Na) and the breathing of the InF6 polyhedra. As discussed previously, a larger volume results in an increased disorder of the fluorine anions (see Table 1). In particular, considering that the softness of the structure increases with alkali size, we suggest that the capability of a larger Ce3+ coordination polyhedron to be distorted, leading to its energetic and spatial reorganization. Thus, the cryolite structure appears as a more rigid host lattice. Such a tendency seems to be confirmed by experimental data reported in the literature for similar structural matrices (Fig. 6d). Low-temperature measurements were performed on the K3 compound (an equivalent study has been reported for the Rb2K elpasolite.8 A weak thermal quenching of 12% (integrated area), a decrease in the full width at half maximum, and a UV shift are observed from a drop in the temperature down to 8 K. The results are illustrated in Fig. S1 (ESI†).
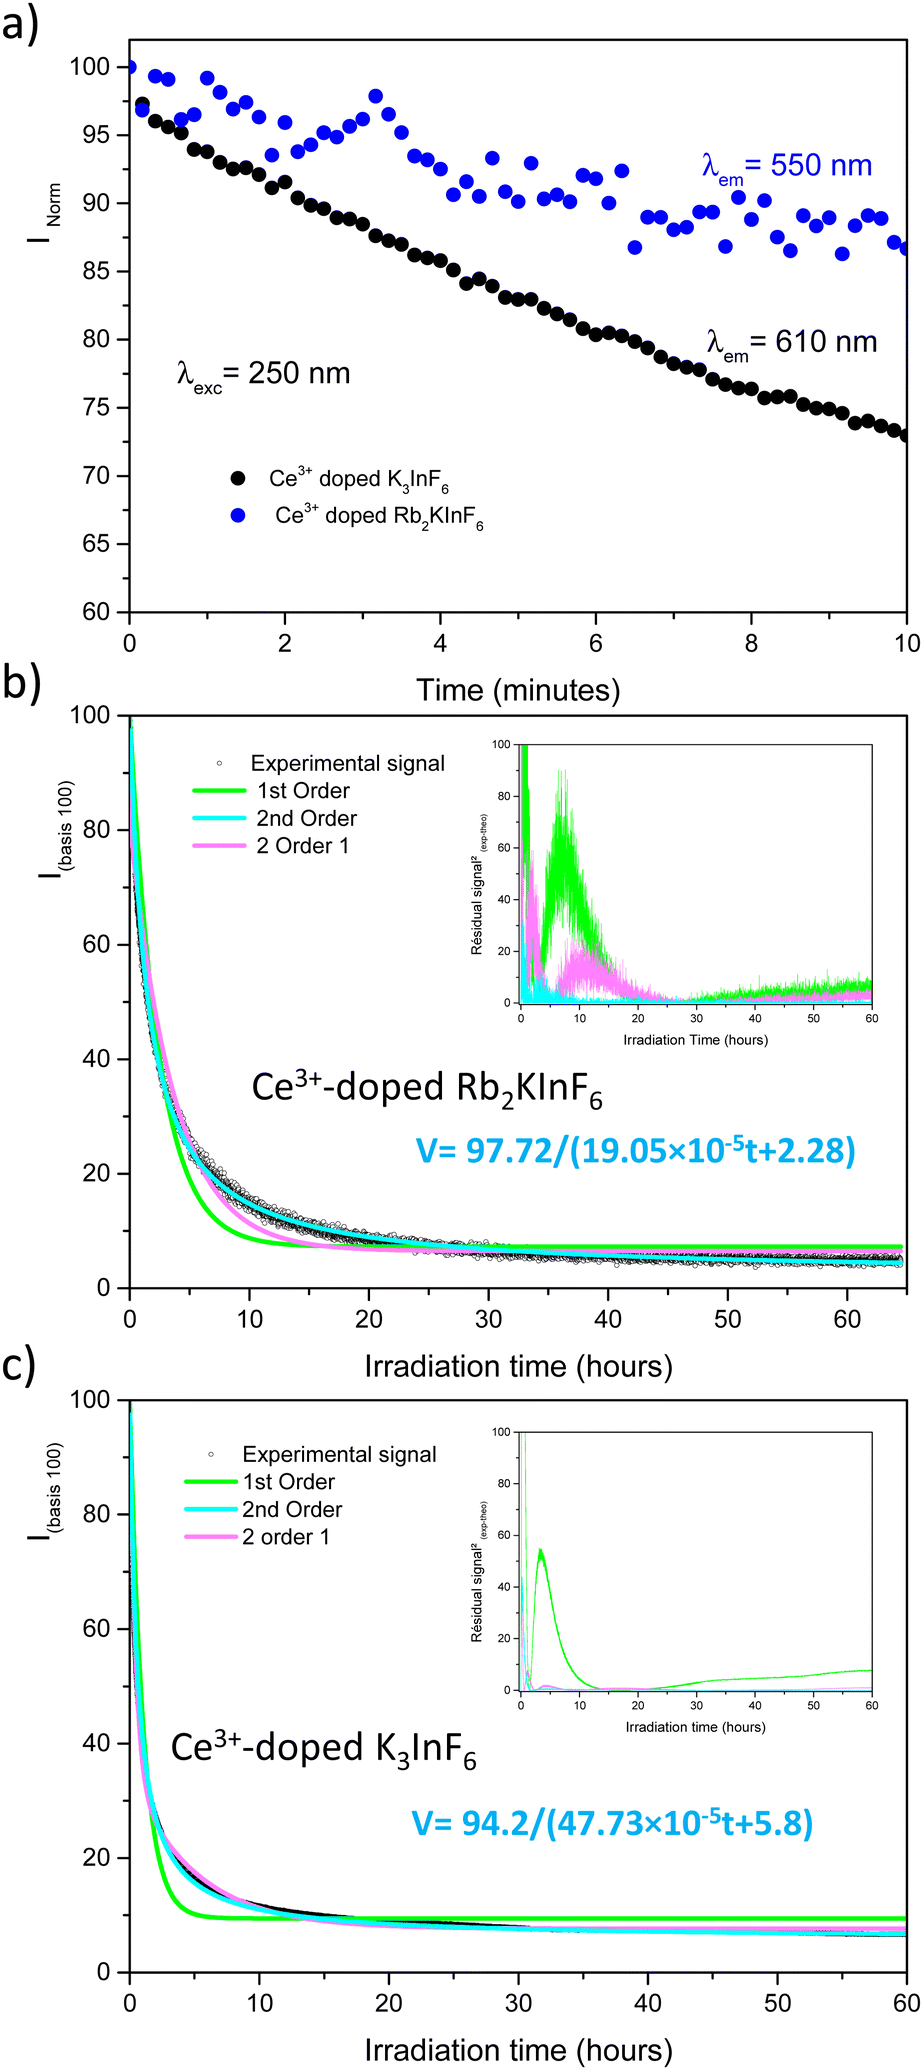
As published previously, the emission of Ce3+-doped Rb2KInF6 elpasolite is not stable under UV excitation. An electron transfer occurs between the rare earth and indium cations, leading to a redox process (fourth reaction) between the two elements. It is thus possible to record the kinetics of Ce3+ ion oxidation by following the decrease in the corresponding emission curve. As illustrated below (Fig. 7a), the redox process has also been detected on the K2Na and K3 compounds. After 10 minutes, losses in intensity of approximately 15%, 6% and 20% are observed for the Rb2K, K2Na and K3 compounds, respectively. A deeper characterization is proposed for both the Rb2K elpasolite and K3 cryolite. The kinetic curves of the Ce3+ ions were recorded under excitation at 315 nm and a maximum emission fixed at 485 nm and 435 nm for Rb2K and K3, respectively. On one hand, the oxidation velocity of Ce3+ cations and their disappearance have been considered equal to the global emission. Considering this hypothesis for the low doping rate, the emission intensity is proportional to the concentration of luminescent cations and can be expressed as V = −d[Ce3+]/dt avec [Ce3+] with [Ce3+], the concentration and t, the time. On the other hand, several kinetic models following the general rule V = k[Ce3+]α with α, the order of the reaction and k, the velocity constant, have been run by changing the α value.
 | ||
| Fig. 7 Kinetic curves of Ce-doped Rb2K and K2Na elpasolites K3 cryolite (a); fit of a long-time acquisition of the kinetic curves of Rb2K and K3 compounds. The square value of the residual difference between the calculated and experimental values is reported in inset (b and c). The fitting equations based on the iii model are indicated in pink. | ||
The results of the fits are illustrated in Fig. 7b and c, and the corresponding parameters are listed in Table S2 (ESI†). The R2 reliability factor was calculated as follows.18,19

Different hypotheses were considered. (i model) is a single first-order kinetic model corresponding to the disappearance of a single cerium luminescent centre such as −d[Ce3+]/dt = k1[Ce3+]1, leading to [Ce3+]t = [Ce3+]0exp(−kt) expressed as (100 − A)exp(−k1t) + A on a 100 basis to take into account the A nonreacting cerium fraction. A is the threshold of the minimum intensity reached over a long time, and k1 is the constant velocity (s−1) of cerium III photooxidation. The results are shaped as green curves in Fig. 7b and c. (ii model) The reaction is considered a second-order mechanism, always relying on a single redox centre. V is calculated as follows: −d[Ce3+]/dt = k2[Ce3+]2, equal to (100 − A)/(1 + 2(100 − A)) × k2t + A, where k2 is the two-order velocity constant (s−1) (blue curves). Finally, the accumulation of two simultaneous 1st order kinetic laws (iii model) (pink curves) is such as −d[Ce3+]/dt = k1[Ce3+]1 + k2[Ce3+]2 leading to a disappearance kinetic such as (100 − A − B)exp(−k1t) + Bexp(−k2t) + A, with k1 and k2 used for the slow and fast kinetic constants, respectively. The two first law models are not fully satisfactory, and significant residual signals are obtained at the beginning of the irradiation and at 16 hours and 4 hours for Rb2K and K3, respectively. However, the (iii model) leads to a very low R2 value, and it is reasonable to conclude that two different Ce3+ sites with two different kinetics are involved. The total fitted parameter values are reported in Table S2 (ESI†).
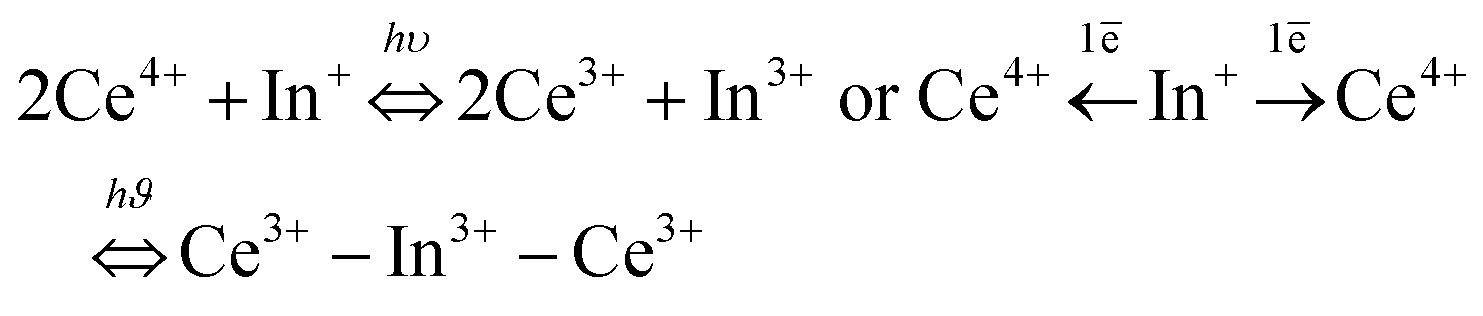
The most surprising finding is that the main part of the cerium is actively embedded in the redox process since the A nonreacting fraction is approximately 20–30% (28.13 and 18.34 are the values extracted from the fit on Rb2K and K3, respectively). Indeed, we have shown in our previous work in Rb2K compound that the redox is clearly originating from an overlapping of the cerium and indium external atomic orbitals, i.e., from cations in the first neighbouring positions. The redox process involves two Ce3+ ions for one In+ cation, as illustrated below:

The probability of being involved in a redox process for Ce3+ ions, i.e., to not be “isolated” from other Ce3+ ions is P = 1 − (1 − p)n, where p is the substitution rate by Ce3+ at the indium site, and n is the total amount of potential locations to find cerium cations that can coparticipate in the redox reaction (active redox coordination sphere number). The n value is equal to 56 because, to be isolated from redox potentiality, each Ce3+ ion must be placed farther from a next-to-next neighbouring position from a second Ce3+ ion (56 next-to-next neighbours).20 The probability of finding a second active cerium ion around the one considered in the active sphere is 1 − 0.9856 ≈ 68% for p = 2%, in relatively good agreement with the A value (nonreactive cerium fraction). This first calculation indicates that the redox mechanism is effective, while two cerium cations belong to the first neighbouring sphere of a single indium site (with 12 neighbours). Furthermore, electron transfer between two cerium III must also be considered helpful for this process. Additionally, it can be imagined that Ce3+–Ce3+–In3+ chains within a “cascade” double electron injection from the two cerium ions towards the indium site, occur more quickly than the case that two independent cerium ions have to inject one electron each into a “central” indium site. Then, B eliminates the cerium rate, which is the proportion of ions concerned by the rapid kinetic law (k2 constant) and can correspond to cerium ions involved in this “cascade” transfer. Considering a doping with exactly 2% of cerium on indium site with perfectly homogeneous distribution, the iii model, implemented with consideration of a quick (Ce–Ce–In triplets) and slow (Ce–In–Ce triplets) redox centre mechanisms, proportion of nonreacting cerium ions (A fraction)/reacting with fast kinetic (B fraction)/reacting with slow kinetic (100 − A − B fraction) will be: 1 − (1 − 0.9856) = 32%/1 − (0.9812 × (1 − 0.9856)) = 46.6%/100 − 46.6 − 32 = 21.4%, respectively. These results are in good agreement with the experimental values.
After far UV irradiation, the luminescence of monovalent indium cations was detected for the three studied compounds. It consists of 5s2 ↔ 5s15p1 transitions. Concerning the In+ cation, spin–orbit coupling results in the global splitting of the p orbitals into 3P0, 3P1, 3P2 and 1P1 levels, with 1S0 being the ground state. The absorption bands are labelled A (1S0–3P0,1), B (1S0–3P2), and C (1S0–1P1).21 In an octahedral environment, the emission results from the de-excitation of the 3P1 level, which is split into a 3A1u (AT high energy component) and a 3A1u (Ax low energy component). The first transition is usually quenched at room temperature. In addition, the Jahn–Teller effect is predominant among the spin–orbit couplings, and the spectral distribution in absorption and emission is strongly affected Fig. 8 shows the excitation and emission spectra of the three fluoride compounds.22–25
 | ||
| Fig. 8 Excitation (a) and emission spectra (b) after 10 minutes of irradiation at 315 nm of Ce3+ doped fluoride compounds. Measurements were performed at room temperature. | ||
As indicated above, the redox process induced under UV irradiation stabilized indium in the monovalent oxidation state. In the three fluorides, a large orange-red emission due to the Ax (3P0) → 1A1 (1S0) transition is observed, and the corresponding excitation bands peak at approximately 240 nm. For the Rb2K and K3 compounds, measurements were performed at 8 K to confirm the origin of these transitions through the expected appearance of the AT component. The spectral characteristics are listed in Table 4.
| λ ex max (cm−1) | λ em max (cm−1) | ΔE (cm−1) | |||||
|---|---|---|---|---|---|---|---|
| Compound | T = 293 K | A T (293 K) | A X (293 K) | A T (8 K) | A X (8 K) | Δ(3P0,1(Ax)–1S0) (cm−1) 293 K | Δ(AT − AX) (cm−1) 8 K |
| Rb2K # ref. 8 | 40485 (247 nm) |
— | 15385 (650 nm) |
25000# (400 nm) |
15152# (660 nm) |
25100 |
9848# |
| K2Na | 42017 (238 nm) |
— | 17587 (560 nm) |
— | — | 24430 |
— |
| *K3 | 41322 (242 nm) |
380 | 16526 (605 nm) |
26316 (380 nm) |
15873 (630 nm) |
24800 |
10443 |
Both excitation and emission bands are redshifted in parallel to the decrease in the alkali radii. This reflects the Nephelauxetic effect first described by C. K. Jørgensen in 1962.26 The interelectronic repulsion of a transition metal is weaker when integrated in a complex than for the free ion because of the overlap of the ligand–metal orbitals and the expansion of the electronic cloud over a wider area. The electronic repulsion is reduced, leading to decreased energy levels.27,28 This effect is driven by the covalence and polarizability of the chemical bonding. The excitation energy decreases with increasing bond covalence. Antagonist chemical bonding needs to be considered to better understand the observed shifts in excitation and emission. In all the studied A2BInF6 (A = B for K3InF6 cryolite) compounds, indium cations are surrounded by fluorine anions. The stronger the A–F bond ionicity (A = Rb, K, Na) is (Fig. S2, ESI†), the higher the covalence of the In–F bond, and the lower the energetic levels at the origin of the indium luminescence. Under excitation, the order of Eex(Rb2K) = 40485 cm−1 < Eex(K3) = 41322 cm−1 < Eex(K2Na) = 42017 cm−1 is observed. Consequently, the corresponding emission bands appear to shift in the same manner. RGB colour emission is illustrated as previously.
The reversibility of the redox process (back redox reaction) was checked for both compounds. Fig. 9 illustrates the kinetic curves of In+ luminescence under 250/245 nm excitation for Rb2K and K3. After 10 minutes of irradiation at room temperature, 50% of the Rb2K signal (Ax component peaking at 650 nm) is lost, whereas this value is equal to approximately 30% for the K3 compound (Ax component peaking at 610 nm). The decrease in In+ is associated with a recovery of Ce3+ ions, as mentioned previously.8,9
 | ||
| Fig. 9 Kinetic curves of Rb2K elpasolite and K3 cryolite (a) after irradiation at 315 nm; fit of a long time acquisition of the kinetic curves. The square value of the residual difference between the calculated and experimental values is reported in inset (b and c). The fitting equations based on the ii model are indicated in blue. | ||
The three previously described kinetic models have been applied similarly to the In+ ion decreasing curves. The different fitted parameters are listed in Table S3 (ESI†); the residual signals are reported in the inset of Fig. 9.
Nearly all the In+ luminescent ions that were formed during the fourth redox process are involved in the back-redox reaction (98% and 94% for Rb2K and K3, respectively). The fits show that the best result is obtained for the 2nd order kinetic law (lowest residual signal and highest value of R2), in agreement with the fact that the indium ions have to release two electrons through two different neighbouring ceriums (one per cerium cation) to be reoxidized.
The constant k1 for the K3 compound is twice the value of Rb2K. A total of 170 hours of irradiation are necessary to reach 10% of the initial signal for Rb2K, whereas 12 hours are sufficient to quench 90% of the K3 emission. This can be interpreted as the smaller the alkali cations are, the more rigid the host lattice is thus, the rigidity of the crystallographic network could accelerate the electron transfer.
Finally, the UV irradiation of Ce3+-doped Rb2KInF6, K2NaInF6 elpasolites and K3InF6 cryolite makes possible a reversible switch of the luminescence from blue to yellow-orange-red from a reversible redox process between cerium and indium ions due to atomic orbital overlapping. Due to different polarizabilities, the use of various alkali cations makes it possible to tune the redox kinetics and these emissive colours, as illustrated in Fig. 10.
 | ||
| Fig. 10 CIE xy trichromatic diagram based on Ce3+ and In+ in Ce3+-doped Rb2KInF6, K2NaInF6 elpasolites and K3InF6 cryolite. | ||
From the chromatic x and y parameters between the Ce3+ and In+ spectral distributions, the maximum of the calculated optical contrast 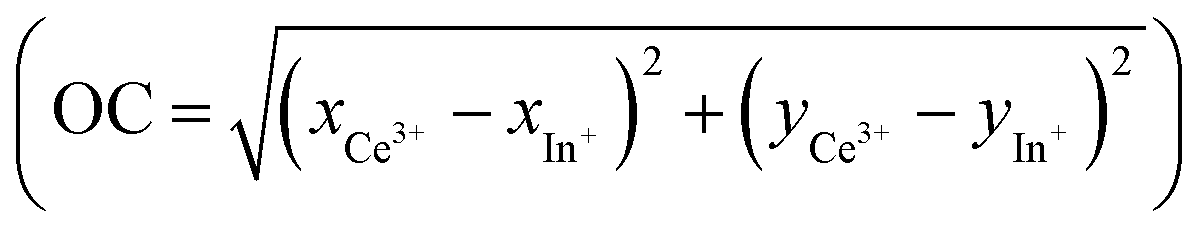 is obtained with the cryolite compound and is equal to 0.482. OC values of 0.314 and 0.424 are calculated for the Rb2K and K2Na compounds, respectively.
4. Conclusion
From solid-state synthesis, three Ce3+-doped fluorides, Ce-doped Rb2KInF6 and K2NaInF6 elpasolite-type and Ce-doped K3InF6 cryolite-type, have been prepared. In addition to the refinement of the crystallographic elpasolite structures as already well described in the literature, coupling X-ray diffraction and Raman spectroscopy, a new space group with full atomic positioning was herein proposed for the cryolite-type compound.The reversible photochromoluminescent properties of Ce3+-doped Rb2KInF6, K2NaInF6 elpasolite and K3InF6 cryolite have been demonstrated. Supported by the neighbouring probability of the involved cations, photoluminescence is confirmed to come from the redox process between neighbouring cerium and indium ions due to orbital overlap. Before far UV irradiation (Ce3+/In3+ state), Ce3+ emission bands are shifted to lower energy with increasing alkali size. After the forth-redox reaction (Ce4+/In+ state), the In+ luminescence is also tuned by the alkali size due to the Nephelauxetic effect. Hence, cyan to red (Rb2K) or blue to yellow (K3) photochromism can be achieved. A deep kinetic investigation was performed to better understand the successive decrease in Ce3+ and In+ emission during forth- and back-irradiation, respectively. The forth-redox is governed by the accumulation of two 1st order laws, while for the back-redox, the In+ disappearance kinetic curve follows a 2nd order law. The redox processes appear faster for the cryolite compound than for the Rb2K compound, suggesting that a more rigid host lattice accelerates electron transfer. Noticeable changes in the optical contrasts were obtained along the fluoride series.
Conflicts of interest
There are no conflicts to declare.Acknowledgements
This investigation was supported by the CNRS and the Nouvelle Aquitaine region. This study was carried out with financial support from the French State, managed by the French National Research Agency (ANR) in the frame of a nonthematic program (PRIDE – ANR-16-CE08-0029) and in the frame of “the Investments for the future” Program IdEx Bordeaux – LAPHIA (ANR-10-IDEX-03-02).References
- Y. Hirshberg, Reversible Formation and Eradication of Colors by Irradiation at Low Temperatures. A Photochemical Memory Model, J. Am. Chem. Soc., 1956, 78(10), 2304, DOI:10.1021/ja01591a075.
- G. P. Smith, Photochromic glasses: Properties and applications, J. Mater. Sci., 1967, 2, 139, DOI:10.1007/BF00549573.
- R. Zhang, The Syntheses, NMR and Photochromic Properties of Modified Dimethyldihydropyrenes, PhD thesis, University of Victoria 2002, https://hdl.handle.net/1828/247.
- H. J. Hoffmann, The use of silver salts for photochromic glasses, Stud. Org. Chem., 2003, 40, 822 Search PubMed.
- H. Rosset, Security element having a variable optical effect and security sheet or document or article comprising it, FR2933428, 2010 Search PubMed.
- W. J. Cross and W. J. Hillebrand, Beitr. Krystallogr. Mineral., 1887, 12, 495 Search PubMed.
- J. P. Chaminade, A. Garcia, T. Gaewdang, M. Pouchard, J. Grannec and B. Jacquier, Reversible photoionization process in luminescent Ce3+ doped elpasolite-type fluoroindates, Radiat. Eff. Defects Solids, 1995, 135(1-4), 137, DOI:10.1080/10420159508229823.
- L. Cornu, M. Gaudon, O. Toulemonde and P. Veber, Optical contrast and cycling of bistable luminescence properties in Rb2KIn(1-x)CexF6 compounds, Dalton Trans., 2016, 45, 3380, 10.1039/C5DT04772B.
- L. Cornu, M. Gaudon, P. Veber, A. Villesuzanne, S. Pechev, A. Garcia and V. Jubera, Discussion on the Structure Stability and the Luminescence Switch under Irradiation of a Ce-Doped Elpasolite Compound, Chem. – Eur. J., 2015, 21(13), 5242, DOI:10.1002/chem.201405784.
- G. Blasse and B. C. Grabmaier, Luminescent materials, Springer-Verlag; Berlin Heidelberg New York, 1994, London Paris Tokyo, Hong Kong Barcelona Budapest, ISBN: 978-3-642-79017-1 DOI:10.1007/978-3-642-79017-1.
- Y. Mao, H. Zhou and S. S. Wong, Synthesis, Properties, and Applications of Perovskite- Phase Metal Oxide Nanostructures, Mater. Matters, 2010, 50, 1 Search PubMed.
- H.-R. Wenk and A. G. Bulach, Minerals: their constitution and origin, Cambridge Univ. Press, 2004 Search PubMed.
- D. Babel, R. Haegele, G. Pausewang and F. Wall, Ueber kubische und hexagonale elpasolithe AI2BIMIIIF6, Mater. Res. Bull., 1973, 8(12), 1371, DOI:10.1016/0025-5408(73)90021-4.
- H. Bode and E. Voss, Strukturen der Hexafluorometallate(III), Z. Anorg. Allg. Chem., 1957, 290(1-2), 1, DOI:10.1002/zaac.19572900102.
- K. S. Aleksandrov, S. V. Misyul, M. S. Molokeev and V. N. Voronov, Structures of distorted phases and critical and noncritical atomic displacements of elpasolite Rb2KInF6 during phase transitions, Phys. Solid State, 2009, 51, 2505 CrossRef CAS.
- K. Nakamoto, Infrared and Raman Spectra of Inorganic and Coordination Compounds: Part B: Applications in Coordination, Organometallic, and Bioinorganic Chemistry, 2008 DOI:10.1002/978047.
- W. M. Yen, S. Shionoya and H. Yamamoto, Phosphor handbook, Boca Raton, FL: CRC Press/Taylor and Francis, 2nd edn, 2007 Search PubMed.
- https://fr.wikiversity.org/wiki/Cin%C3%A9tique_chimique/Lois_de_vitesse_simples .
- https://www.techno-science.net/definition/3325.html .
- L. Cornu, Matériaux X-Chromo-Luminescent de type Spinelle et elpasolite: relation structure-propriétés, thèse de doctorat en chimie, Univ. Bordeaux, 2015, 49–179 Search PubMed.
- A. Fukuda, Jahn-Teller Effect on the Structure of the Emission Produced by Excitation in the A Band of KI: Tl-Type Phosphors. Two Kinds of Minima on the Γ4−(3T1u) Adiabatic Potential-Energy Surface, Phys. Rev. B: Solid State, 1970, 1(10), 4161, DOI:10.1103/PhysRevB.1.4161.
- D. Klick and H. G. Drickamer, High-pressure studies of Jahn-Teller-split luminescence in alkali halides doped with In+ and Tl+, Phys. Rev. B: Solid State, 1978, 17(3), 952, DOI:10.1103/PhysRevB.17.952.
- A. Fukuda, Magnetic Field Effect on the Triplet Relaxed Excited States Responsible for the AT and AX Emission bands of Ga+ and In+ Centers in Alkali Halides, J. Phys. Soc. Jpn., 1976, 40(3), 776, DOI:10.1143/JPSJ.40.776.
- A. I. Popov and I. Plavina, Photostimulated emission of KBr-In previously exposed to UV- or X-radiation, Nucl. Instrum. Methods Phys. Res., Sect. B, 1995, 101, 252 CrossRef CAS.
- V. S. Sivasankar, K. Schmitt and P. W. M. Jacobs, Luminescence and decay times of CsI: In+, J. Lumin., 1985, 33(4), 409, DOI:10.1016/0022-2313(85)90110-3.
- C. K. Jørgensen, Absorption spectra of transition group complexes of sulphur-containing ligands, J. Inorg. Nucl. Chem., 1962, 24(12), 1571, DOI:10.1016/0022-1902(62)80011-6.
- C. K. Jørgensen, Spectroscopy of Transition-Group Complexes, in Advances in Chemical Physics, ed. I. Prigogine, John Wiley & Sons, Inc., Hoboken, NJ, USA, 2007, p. 33 Search PubMed.
- A. L. Tchougréeff and R. Dronskowski, Nephelauxetic effect revisited, Int. J. Quantum Chem., 2009, 109(11), 2606, DOI:10.1002/qua.21989.
Footnote |
| † Electronic supplementary information (ESI) available. See DOI: https://doi.org/10.1039/d2ma00840h |
| This journal is © The Royal Society of Chemistry 2022 |