
 Open Access Article
 This Open Access Article is licensed under a Creative Commons Attribution-Non Commercial 3.0 Unported Licence
When does a macromolecule transition from a polymer chain to a nanoparticle?†
Jacob
Fischer
a,
Lu
Han
b,
Tomonori
Saito
 b and
Mark
Dadmun
*ab
b and
Mark
Dadmun
*ab
aDepartment of Chemistry, University of Tennessee, Knoxville, Tennessee, USA. E-mail: dad@utk.edu
bChemical Sciences Division, Oak Ridge National Lab, Oak Ridge, Tennessee, USA
First published on 8th November 2022
Abstract
Frequently, the defining characteristic of a nanoparticle is simply its size, where objects that are 1–100 nm are characterized as nanoparticles. However, synthetic and biological macromolecules, in particular high molecular weight chains, can satisfy this size requirement without providing the same phenomena as one would expect from a nanoparticle. At the same time, soft polymer nanoparticles are important in a broad range of fields, including understanding protein folding, drug delivery, vitrimers, catalysis and nanomedicine. Moreover, the recent flourish of all polymer nanocomposites has led to the synthesis of soft all-polymer nanoparticles, which emerge from internal crosslinking of a macromolecule. Thus, there exists a transition of an internally crosslinked macromolecule from a polymer chain to a nanoparticle as the amount of internal crosslinks increases, where the polymer chain exhibits different behavior than the nanoparticle. Yet, this transition is not well understood. In this work, we seek to address this knowledge gap and determine the transition of a macromolecule from a polymer chain to a nanoparticle as internal crosslinking increases. In this work, small angle neutron scattering (SANS) offers insight into the structure of polystyrene and poly(ethyl hexyl methacrylate) nanostructures in dilute solutions, with crosslinking densities that vary from 0.1 to 10.7%. Analyses of the SANS data provides structural characteristics to classify a nanostructure as chain-like or particle-like and identify a crosslinking dependent transition between the two morphologies. It was found that for both types of polymeric nanostructures, a crosslinking density of 0.81% (∼ a crosslink for every 1 in 125 monomers) or higher exhibit clear particle-like behavior. Lower crosslinking density nanostructures showed amounts of collapse similar to that of a star polymer (0.1% XL) or a random walk polymer chain (0.4% XL). Thus, the transition of an internally crosslinked macromolecule from a polymer chain to a nanoparticle is not an abrupt transition but occurs via the gradual contraction of the chain with incorporated crosslinks.
Introduction
Polymer nanocomposites (PNC) are a class of materials in which a nano-sized particle is dispersed in a bulk polymer matrix. The addition of these small structures improves the bulk mechanical, thermal, or chemical properties of the polymer.1–5 Often, the nanomaterial is comprised of an inorganic core with polymer grafted to the surface,6–8 however, recent interest has focused on developing and implementing all-polymer nanocomposites, or all-PNC.9–13 An all-polymer composite consists of a polymer matrix with a nanoparticle that is entirely comprised of organic material, foregoing the traditional inorganic center. This class of nanoparticles is interesting and desirable as the nanoparticle generally disperses more readily in the polymer matrix than hard impenetrable nanoparticles.14–16 This is primarily due to more favorable interactions between the bulk polymer and polymer nanoparticle.17 Poor interactions between nanoparticle and polymer usually leads to nanoparticle agglomeration, and inferior properties.18–28More broadly, soft nanoparticles have received great interest lately due to their potential use in a range of sectors, such as drug delivery systems, tissue engineering, improved biological targeting, and all polymer nanocomposites.10,11,16,29–35 These soft nanoparticles are generally formed via extensive branching and/or internal crosslinking of macromolecules to form nanoscale particle-like structures.9,36–38 Two classes of polymer nanoparticles formed via internal crosslinking include a single chain nanoparticle (SCNP), or a soft polymeric nanoparticle. SCNPs are commonly formed by synthesizing a linear precursor polymer chain with a known amount of crosslinker distributed along the polymer chain.39–43 This precursor then undergoes crosslinking reactions, collapsing the chain, and forming a nanoparticle. This process is akin to protein folding and typically contains crosslinking moieties in excess of 20%.38,39,44–47 Because of the random distribution of the crosslinking sites along the polymer chain and during particle formation, the structure of SCNPs is typically not well defined or controlled. Alternatively, soft polymer nanoparticles are synthesized in a reaction where the monomers and crosslinking agents react simultaneously during polymerization. The structure of soft polymeric nanoparticles is very well controlled synthetically, where the molar ratio of crosslinking agent to monomer and the rate of monomer addition in the polymerization are easily varied and controlled and impact the structure of the fabricated soft nanoparticle.17,36 Soft polymeric nanoparticles exhibit a fuzzy sphere morphology, as shown in Fig. 1, defined by a crosslinked core (green arrow in Fig. 1) and fuzzy loops and tails on the outer shell (purple arrow in Fig. 1) of the particle. In general, increasing crosslinking density increases the core size and reduces the size of the fuzzy interface.16,17,36,48,49
 | ||
| Fig. 1 Illustration of the fuzzy sphere structure of the soft polymer nanostructures studied. | ||
One of the more interesting results regarding all polymer nanocomposites is the variation of the transport properties of all PNCs from Stokes–Einstein behavior. In the early 1900s, Einstein's study of Brownian particles suspended in a liquid led to the understanding that the viscosity of a liquid increases with the inclusion of particles, where this concept holds true for polymeric melts as well.50,51 Mackay et al. were one of the first to observe a reduction in the measured viscosity of a polymeric melt with the addition of a nanoscale additive, an SCNP.52 Further work by Chen et al. hypothesized that the source of this viscosity reduction is rooted in the deformability, or softness, of the SCNPs and is related to a reduction in the friction between the nanoparticle and polymer chain.37
On the other hand, the addition of an impenetrable nanoparticle to a polymer matrix slows the center of mass diffusion of the polymer chain.53–58 However, when a soft penetrable (i.e. polymeric) nanoparticle is added to a polymer matrix, the diffusion coefficient of the polymer chain may increase.16,31,36 For instance, Martin et al. showed that the relative size of the polymer chain to that of the soft nanoparticle plays an important role in realizing this modification of polymer diffusion. This work showed that the diffusion of the polymer is enhanced when the radius of gyration of the bulk polymer is greater than that of the soft polymer nanoparticle. Moreover, nanoparticles with lower crosslink density enhance the polymer diffusion the most.31 Following this logic, a polymer chain is the nanostructure with the lowest crosslink density (i.e. 0%), and thus should provide the optimal enhancement of the polymer diffusion in the nanocomposite. However, the addition of a linear polymer with the same molecular weight as the soft nanoparticle slows polymer diffusion. Thus, the ‘particle-like’ nature of the soft nanoparticle must be an important factor in realizing this diffusive behavior. Therefore, to maximize the polymer diffusion in an all-PNC, a polymeric nanoparticle with minimal crosslinking density that still exhibits particle-like behavior is needed. To date, the lowest crosslink density examined is 0.81%, where all structural analyses confirm particle-like structure. Given the requirement for particle like behavior, the correlation of crosslink density to particle-like behavior must be more thoroughly defined. Will a single crosslink in a long polymer chain form a ‘nanoparticle’? Is there a limiting percent of crosslinking that is needed to transition a polymer chain to a soft nanoparticle? The experiments described in the paper seek to address these questions.
From a broader perspective the definition of what makes a construct a ‘nanoparticle’ is not clearly defined. In the most general sense, nanoparticles are defined as objects with sizes ranging from 1–100 nm. However, the dominance of the presence of a surface on a nanoparticle often results in unique properties that differ from those of the bulk material, a feature that makes nanoparticles an area of great research interest.59–63 Typically, the emergence of unique properties of a nanoparticle arises from the balance between the bulk properties of the particle and those of its surface. When sufficiently small, the particles may become thermodynamically unstable due to excess energy of the surface.59 In order to stabilize the nanostructure, the nanoparticles often change their crystallographic structure, and this variation in assembly leads to many of the unique features of nanoparticles.60–62 Thus, many of the unique properties observed in nanoparticles are governed by the presence and properties of the surface structure of the nano-object. Therefore, we posit that for a polymeric nanostructure to behave as a nanoparticle, the assembly of the crosslinked assembly must develop an external surface. To test this hypothesis, we have completed a set of small angle neutron scattering experiments to correlate the topology, morphology, and crosslink density to the presence of a surface in soft nanoparticles to identify the correlation of crosslink density to the transition of a crosslinked polymer chain to a polymeric nanoparticle.
Previously, Tuteja et al. characterized the molecular architecture of polystyrene SCNPs.64 This study characterized these nanostructures by analyzing Kratky plots, and the ratio of the radius of gyration to the hydrodynamic radius of nanoparticles with two different crosslinking densities, 2.5% and 20%, and three different molecular weights. Their study found that all three SCNPs with a crosslinking density of 2.5% expressed clear chain-like characteristics in both analyses, whereas the more tightly 20% crosslinked SCNPs exhibited a more particle-like structure approaching that of a hard sphere with increasing molecular weight. This study indicates a crosslinking dependent transition from chain-like to particle-like morphology exists but does not define the crosslinking density where this transition occurs. The introduction of the crosslinks into the system at different stages of polymerization, in situ during synthesis for the soft nanostructure at hand and post chain synthesis for SCNPs, appears to be an important point in defining the relationship between the crosslink density and conformation of a soft nanoparticle. The importance of the incorporation of crosslinking in the synthetic protocol is already apparent as our previous studies of the soft nanostructures studied here, which have shown those with as low as a 0.8% crosslinking density behave as a particle in all-polymer nanocomposites.11,16,31,48
Small angle neutron scattering (SANS) offers a method to determine the morphological characteristics of soft polymeric nanostructures including size, structure, compactness, and the globular nature of the nanostructure. Because the configurations of soft polymeric nanostructures are readily controlled synthetically by varying the crosslinking density of the sample, the impact of varying crosslink density on the chain-like or particle-like nature of the nanostructure is examined. In addition to characterizing the impact of crosslinking density on the conformation of the soft nanostructures, segmental rigidity and molecular weight are also evaluated for their impact on the conformation of the soft nanoparticles. Two different types of polymers are used to produce the soft nanostructures, polystyrene (PS) and poly(ethyl hexyl methacrylate) (PEHMA) where PEHMA is less rigid than polystyrene. Additionally, the impact of molecular weight is evaluated by comparing the conformation of the PS soft nanostructures of equal crosslinking density, but varying Mw. The neutron scattering curves are analyzed to elucidate particle like structure by examination of the Kratky plot, fractal dimension, and ratio of the radius of gyration to the hydrodynamic radius of the nanostructure. Careful analysis of the scattering data offers insight into the transition of the morphology of the soft polymer nanostructure from random coil chain-like to collapsed globular particle-like as a function of structure crosslink density.
Experimental
Materials
Ethyl hexyl methacrylate (EHMA, 2-ethylhexyl-2-methylprop-2-enoate: TCI, >99.0%), 1,6 hexanediol dimethacrylate (HDDMA, 6-(2-methylprop-2-enoyloxy)hexyl 2-methylprop-2-enoate: Aldrich, ≥90%), styrene (Aldrich, 99.9%) and divinylbenzene (DVB, Aldrich, 90%, 80 para content, technical mixture) were passed through an alumina column to remove inhibitors prior to use. Dodecyl(trimethyl)ammonium bromide (DTMAB, 1-dodecyl (trimethyl)azanium; bromide: TCI > 98%), potassium persulfate (KPS, >99% Acros Organics), tetrahydrofuran (THF, Sigma-Aldrich, >99%), methanol (Sigma-Aldrich, >99%), and deionized water (DI water, Sigma-Aldrich, HPLC Plus) were used as received.Synthesis of soft nanostructures
The soft polymer nanostructures were synthesized via a modified semi-batch nano-emulsion polymerization previously detailed by Martin et al.36 In this procedure, a surfactant solution is first prepared by combining 20 g of DTMAB, 25 mg of KPS, and 50 mL of DI water in a round bottom flask. The flask is then capped with a rubber septum, purged with argon, and sonicated for 30 minutes to ensure homogeneity of the solution. The surfactant flask is then placed into an oil bath at 65 °C and stirred for 10 minutes to allow the solution to reach the required reaction temperature. In a separate vial, 5 mL of the monomer (EHMA or styrene) is combined with the appropriate amount of crosslinker (HDDMA or DVB) to attain the targeted crosslinking density. The monomer solution is then capped and purged with argon for 10 minutes. The monomer solution is then drawn into an airtight glass syringe and added to the surfactant solution at the desired rate of addition using a syringe pump. For the polystyrene (PS) samples, the monomer rate of addition was varied between 2 and 10 mL h−1 depending on the sample, while the poly(ethyl hexyl methacrylate) (PEHMA) samples all utilized a monomer rate of addition of 2 mL h−1. The variation in the monomer rate of addition results in control of the nanoparticle molecular weight, independent of crosslinking.36 Following the entire monomer addition, the reaction is allowed to proceed for 2 h. Once completed, 5 mL of THF was added to the flask to swell the polymer. The synthesized nanostructures were precipitated in excess methanol (∼300 mL) and placed in the refrigerator (∼7 °C) overnight. Excess methanol was decanted, and the precipitate was removed. Particulates remaining in the solvent were separated via vacuum filtration. The precipitated polymer was then washed three times by dissolving in THF and re-precipitating in methanol. To remove any traces of water, the samples were dried in a vacuum oven over the course of 2 days at ∼90 °C. Additionally, 1H NMR confirmed the removal of surfactant after this cleaning process. The amount DTMAB surfactant is in huge excess compared to that of the KPS initiator. While KPS is not visible in 1H NMR, the complete removal of the DTMAB following the extraction process suggests no residual KPS in the soft nanostructures. Thus, the chain conformation of the soft nanostructures is not expected to be impacted by the anionic polymerization process. The resulting polymer was then dried in a vacuum at 50 °C (PS) and 90 °C (PEHMA) for 48 h. Throughout the remainder of this manuscript, the nanostructures will be referenced based on their extent of crosslinking and polymeric structure. For example, a 0.8% crosslinking density polystyrene nanostructure will be referred to as 0.8% XL PS where XL ≡ crosslinking density.Small angle neutron scattering
Small angle neutron scattering (SANS) experiments were conducted using 1% wt solutions of the soft polymer nanostructures in d8-THF at 25 °C at the Oak Ridge National Laboratory (ORNL) HFIR beam line CG-2 (GP-SANS). Three sample-to-detector distances were used; 18 m, 2 m, and 0.3 m with a wavelength of 12 Å allowing for a q range of 0.0015 to 0.6 Å−1 where q = (4π/λ)sin(θ/2), λ is the neutron wavelength, and θ is the scattering angle. The raw data was reduced using SPICE ORNL reduction macros in Igor Pro. Samples were measured at 25 °C and the data was transformed into absolute intensities by correcting for incoherent, background, solvent, and empty cell scattering, neutron beam flux, and normalized to the scattering of a known standard. The fitting of the data was performed using SASView software.65Dynamic light scattering
Dynamic Light Scattering (DLS) was used to determine the hydrodynamic radius, RH, of the polymeric nanoparticles. The nanoparticles were dissolved in THF to produce a concentration of 1 mg mL−1, then filtered through a 0.22 μm syringe filter. DLS was performed with a home-built instrument in 90° geometry. The vertically polarized light was generated from a HeNe laser – Newport R-31425, 633 nm, 35 mW and focused by an F = 100 mm lens into a cylindrical vial. The light scattered at 90° was passed through a similar lens and filtered with 632.8 nm MaxLine laser clean-up filter from Semrock to suppress fluorescence and improve signal to the noise ratio. The filtered light went through an enhances + fiber optical beam splitter from ALV and was captured by Single Photon Counting Module (SPCM) light detectors from Excelitas. These detectors were connected to an ALV-7004/Fast correlator that was used in cross-correlation mode for all experiments.SANS analyses
The conformation of a polymeric nanostructure is determined by the analysis of its scattering curve, where different structural characteristics are elicited with various analyses. A Kratky plot, which emphasizes the rate of change in scattering intensity at higher q, provides insight on the local structure of a scattering object. Similarly, a fractal analysis offers insight to the fractal dimension of an object which can be correlated to the structure's compactness. Finally, the ratio of the radius of gyration (Rg) of an object to its hydrodynamic radius (RH), which will be referred to as the ‘radius ratio’ of an object, varies with the architecture of the nanoscale object, and when considered in conjunction with the results of a Kratky and fractal analysis will further illuminate the structural conformation of the polymeric nanostructures.Typically, SANS curves are depicted as a plot of the scattering intensity, I(q), as a function of the scattering vector, q. The variation of the scattering intensity with q provides information on the size, compactness, structure, and alignment of a polymeric nanostructure. The SANS data are fit to Guinier's law to determine the radius of gyration of the scattering object as shown in eqn (1), which is valid at low q where qRg ≪ 1.
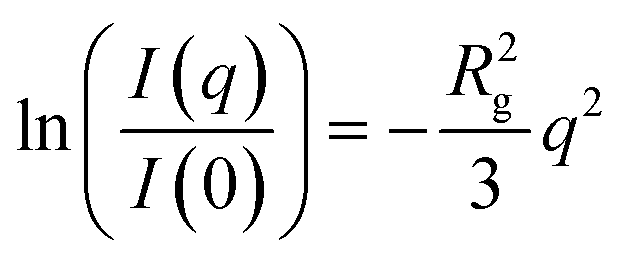 | (1) |
The weight average molecular weight (Mw) of the polymeric structures are determined from this analysis. Eqn (2) shows the relationship of the forward-scattering intensity, I(0), from the Guinier analysis to Mw, where this analysis requires knowledge of the nanostructure's density, ρ, Avogadro's number, NA, volume fraction of nanoparticle in solution, ϕ, and the difference in scattering length densities between the polymeric nanostructure and solvent, Δn.17
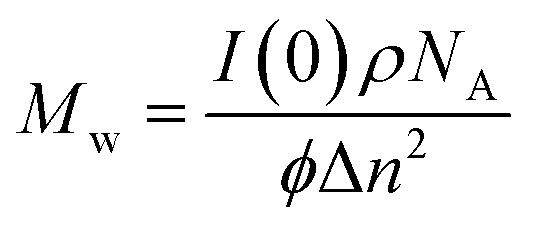 | (2) |
Kratky plot
A Kratky plot, which presents the data as I(q) × q2vs. q, is a common analysis method used to monitor the structure of biomacromolecules such as proteins, where the analysis elucidates the random-coil nature or extent of molecular folding of a protein molecule (i.e., its globular nature). Similarly, the Kratky analysis of the scattering of a polymer chain provides a measure of the deviation of the chain from an ideal Gaussian coil. The scattering intensity of an ideal Gaussian chain scales with q−2, which manifests in a Kratky plot as a plateau at high q due to the coupling of the scattering intensity with q2. Moreover, as a polymer chain deviates from ideal Gaussian behavior, a deviation from that plateau is readily apparent in the Kratky plot. Furthermore, as a polymer chain collapses and becomes more compact, its scattering intensity scales more strongly with q which leads to the emergence of a peak in the Kratky plot before the plateau.66–70 Therefore, the Kratky plot offers evidence of the particle-like behavior of a polymer based on the existence and intensity of a peak found in the Kratky plot.While a standard Kratky plot offers a qualitative assessment of the particle-like nature of a polymer chain, a dimensionless Kratky plot is necessary to compare the structure of different polymeric nanostructures that may differ in size (Rg) and molecular weight. The normalization of the Kratky plot is implemented by scaling the q axis with radius of gyration of the measured polymer, where doing so normalizes the differences in size of the polymeric nanostructures. The scattering intensity, I(q), is also divided by I(0), where this normalization takes into account the polymer molecular weight and solution concentration. These normalizations are implemented in the analysis discussed below and allows the quantitative comparison between different polymer nanostructures in the determination of their particle-like behaviors.67
Further, the location and intensity of a peak that may occur in a dimensionless Kratky plot provides insight into the exact conformation of the polymer, where a globular compact particle will exhibit a peak at qRg = √3 ≈ 1.73 and have an intensity of approximately 1.1. Deviations from this peak location and intensity in a dimensionless Kratky plot indicate that the structure is less compact than that of a completely compacted globule.66,71
Fractal dimension
Scattering in the range of wavevectors 2π/R < q < 2π/b, where R is the radius of the polymer chain, and b is the statistical segment length, probes length scales that are below that of the polymer chain as a whole, but are larger than a statistical segment of the polymer. Analysis of the scattering over this q-range provides information on how compact the polymer segments are packed in the nanostructure, or its fractal dimension. The scattering intensity in this regime scales with q−D, where D is the fractal dimension of the polymer. Therefore, analysis of the slope of a log–log plot of the scattering intensity as a function of the scattering vector, sometimes referred to as a Porod plot, provides a quantitative measure of the fractal dimension of the polymer nanostructure.Moreover, correlating the fractal dimension of a polymer chain to its conformation is reasonably straight forward. It is well established that the size of a polymer coil, R, scales with its molecular weight as R ∼ Mυ, where υ is the Flory exponent of the polymer. The scattering vector is defined as q = 4π![[thin space (1/6-em)]](https://www.rsc.org/images/entities/char_2009.gif) sinθ/λ, where θ is the scattering angle, and λ is wavelength of the radiation source. The intensity of scattering at scattering vector q monitors the structure of the scattering object at a length scale, d, where d ∼ 2π/q. Therefore, the fractal dimension is inversely related to the Flory exponent of a polymer, υ, as shown in eqn (3).
sinθ/λ, where θ is the scattering angle, and λ is wavelength of the radiation source. The intensity of scattering at scattering vector q monitors the structure of the scattering object at a length scale, d, where d ∼ 2π/q. Therefore, the fractal dimension is inversely related to the Flory exponent of a polymer, υ, as shown in eqn (3).
| I(q) ∝ q−D = q−1/υ | (3) |
The Flory exponent for polymers in good solvents, theta solvents and in the melt are well known, where a linear polymer in a good solvent behaves like a self-avoiding walk (υ = 0.6) and a linear polymer in a theta solvent or a melt behave like a random walk (υ = 0.5). Further collapse of a polymer chain in a poor solvent will form a globular like structure (0.3 < υ < 0.5). These translate into a swollen polymer chain in a good solvent having fractal dimensions of 1.67, the D of a polymer in a theta solvent equal to 2, and a globular like polymer has 2 < D < 3. Therefore, as a chain collapses (and becomes more particle like), the fractal dimension increases.
Fractal dimensions below 3 correspond to a mass fractal dimension, where a value of 3 describes a collapsed, 3-dimensional solid structure. However, once a structure is fully collapsed the scattering of the surface contributes to the measured scattering and provide a measured fractal dimension that exceeds 3. In this case, a measured fractal dimension that emerges from the analysis above ranges between 3 and 4 and is a “surface fractal dimension” that physically describes the structure of a surface, ranging from a rough surface to one that is very smooth.70,72,73
Ratio of Rg/RH, the radius ratio of a nanostructure
The ratio of a polymer's radius of gyration, found via SANS, to its hydrodynamic radius, found via dynamic light scattering, is related to the conformation and assembly of a polymer nanostructure. We designate this parameter the ‘radius ratio’. The change in the value of the radius ratio of a macromolecule with variation in conformation has been well documented, where a polymer chain that obeys a self-avoiding walk (i.e. in a good solvent) exhibits a radius ratio of ∼1.56, while a polymer chain that obeys a random walk (i.e., in a theta solvent) has a radius ratio of ∼1.24.74–77 Moreover, it is also well documented that a hard sphere exhibits a radius ratio of 0.78.74 Furthermore, values of the radius ratio that are less than that of a hard sphere correlate to an object that adheres to a core–shell structure. A core–shell structure shows a smaller Rg/RH when the mass of the structure is more densely concentrated in the core but is less dense in the outer shell. This construct results in the radius of gyration of the nanostructure that is much smaller than the hydrodynamic radius, resulting in a small Rg/RH. Thus, a decrease in Rg/RH from above 1 to 0.78 signifies the densification of the nanostructure to a homogeneous globule, with values of Rg/RH below 0.78 signifying heterogeneity of the radial distribution of mass within the nanostructure, i.e., a core–shell type structure.Results and discussion
Table 1 describes the structural characteristics of all of the polymeric nanostructures analyzed via SANS. The weight average molecular weight was determined via SANS as previously described using eqn (2), the nanostructure's radius of gyration was determined via a Guinier analysis of the SANS curves, and the hydrodynamic radii were determined using DLS. These fundamental structural parameters are useful when interpreting the results of the later SANS analyses.| Nanoparticle | M w (×10−5) (g mol−1) | R g (nm) | R H (nm) |
|---|---|---|---|
| a Black and blue text denote PS and PEHMA respectively. | |||
| Linear PEHMA | 1.73 | 24.0 | 13.9 |
| Linear PS | 2.53 | 22.1 | 14.0 |
| 0.1% XL PS | 0.89 | 20.1 | 21.6 |
|
3.26 | 13.5 | 12.6 |
| 0.4% XL PS | 1.06 | 11.9 | 13.9 |
|
5.51 | 12.0 | 14.5 |
| 0.8% XL PS (low MW) | 5.32 | 15.9 | 20.1 |
| 0.8% XL PS (high MW) | 6.74 | 12.5 | 22.0 |
|
7.19 | 10.5 | 16.7 |
|
9.03 | 9.5 | 14.5 |
|
3.30 | 9.2 | 10.0 |
| 10.7% XL PS (low MW) | 3.55 | 6.4 | 8.3 |
| 10.7% XL PS (high MW) | 11.7 | 10.9 | 14.5 |
Kratky plot analysis
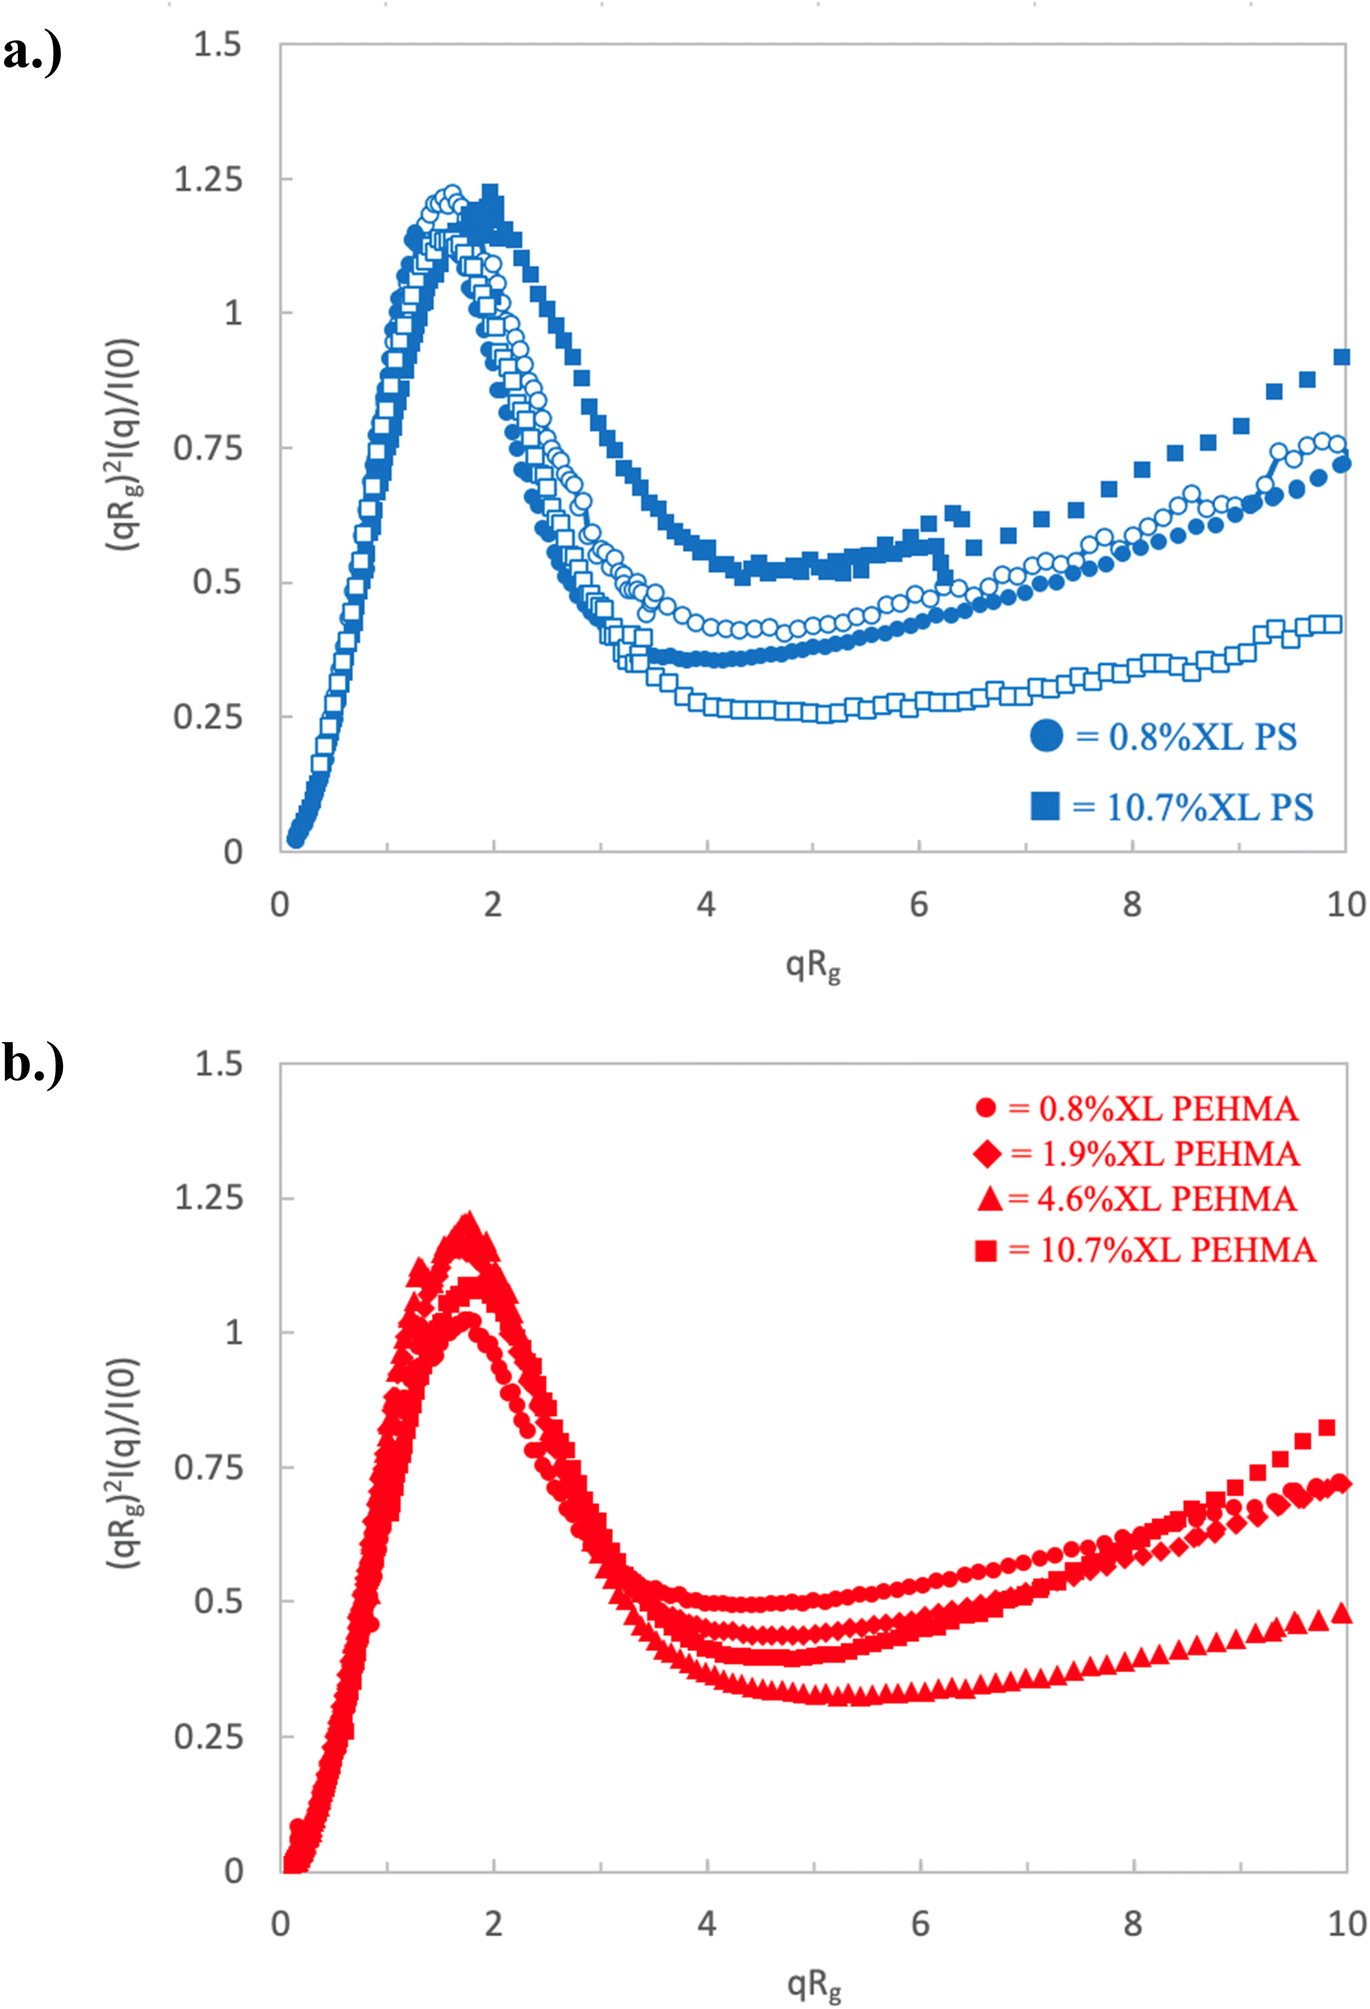
The scattering of a linear, or 0% crosslinked, nanostructure of both polymers (i.e., a polymer chain) is measured and analyzed and serves as a baseline to compare the behavior of other nanostructures that are crosslinked. The dimensionless Kratky plots of polystyrene and poly(ethyl hexyl methacrylate) are shown in Fig. 2 and present similar behavior. As previously stated, a polymer in a theta solvent, which obeys a random walk, is expected to exhibit a plateau in the Kratky plot at qRg ≳ 1.5, and that the emergence of a peak in this region indicates particle-like behavior. Neither the PEHMA nor PS chains show these characteristics, but rather show a linear increase above qRg ≳ 1.5, which indicates that the polymer does not obey random walk statistics. This lack of a plateau is consistent with the conformation of the polymer in a good solvent, i.e., a self-avoiding walk. This is not surprising, as deuterated THF is a good solvent for both polymers at the concentration and temperature of the scattering experiments.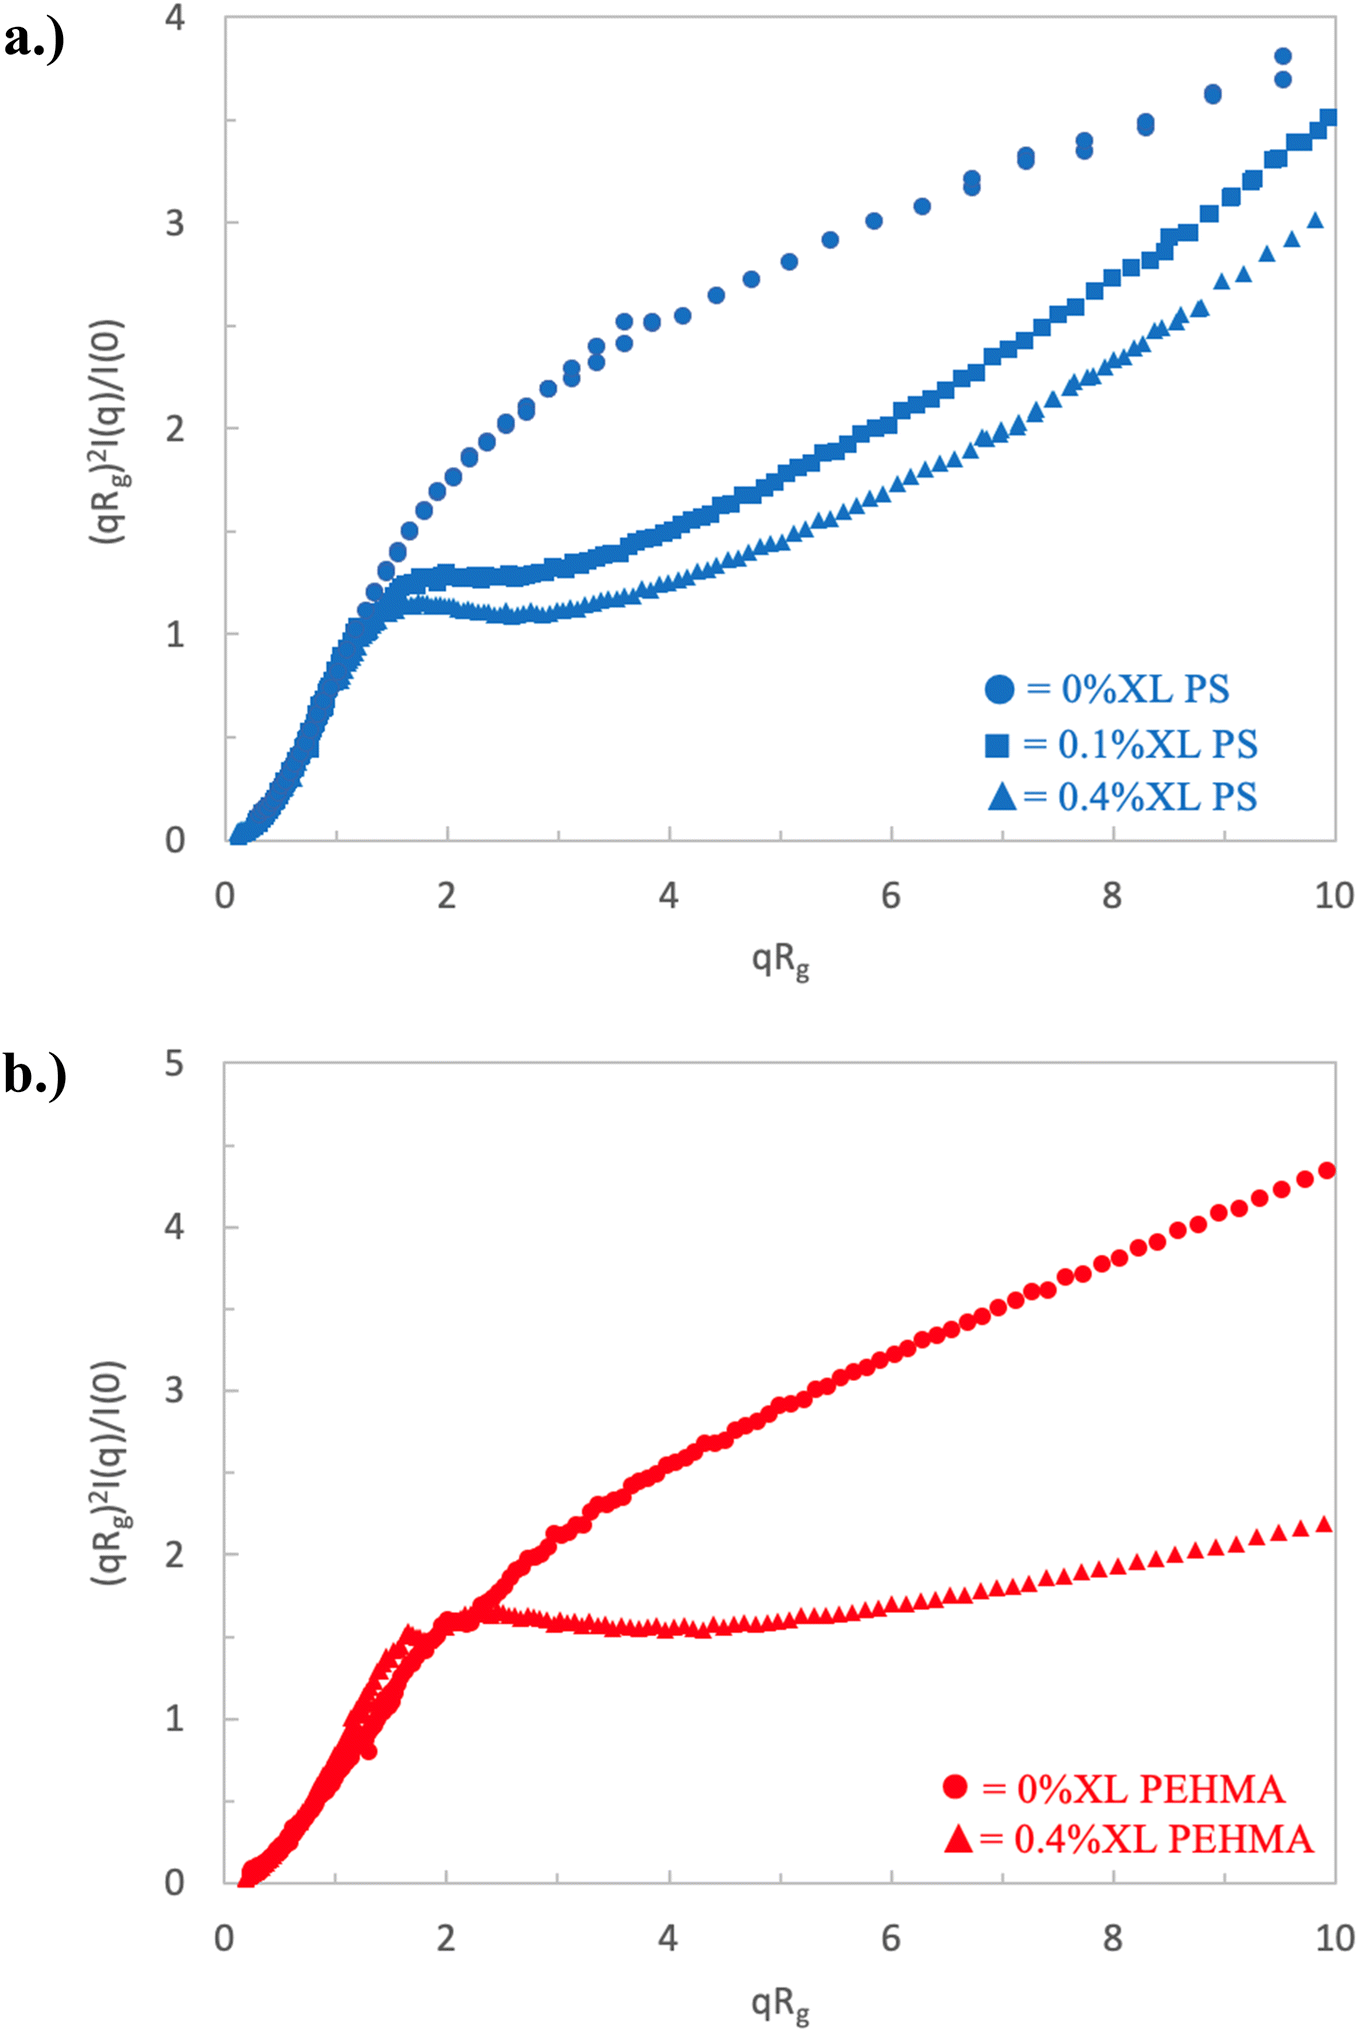 | ||
| Fig. 2 Dimensionless Kratky plot of low crosslinked nanostructures for (a) polystyrene nanoparticles and (b) PEHMA nanoparticles. | ||
The nanostructures formed with the addition of crosslinking agents to the synthetic procedure show considerably different Kratky plots compared to that the linear samples. These results are plotted in Fig. 2 and 3, where the samples with less than 0.8% crosslinking are plotted in Fig. 2, while those with crosslinking ≥ 0.8% are plotted in Fig. 3. In Fig. 2, the samples with the lowest crosslinking density readily show Kratky plots that differ significantly from that of the linear polymer chain. The scattering of the 0.1% XL PS sample, the blue closed squares in Fig. 2a, shows a short plateau in the Kratky plot from ca. 1.5 < qRg < 2.5, followed by a monotonic increase. The emergence of this plateau, and lack of any measurable peak in this sample is consistent with a structure that resembles a polymer chain in a theta solvent, i.e., a random walk.
 | ||
| Fig. 3 Dimensionless Kratky plot of high crosslinking nanostructures for (a) polystyrene nanoparticles and (b) PEHMA nanoparticles. | ||
Thus, the incorporation of only 0.1% crosslinking (ca. 1 in 1000 monomers is crosslinked) transforms the conformation of the polymeric nanostructure from a swollen polymer chain to a more collapsed polymer chain, but does not establish an observable surface based on the absence of a peak. Increasing the crosslinking density to 0.4%, which is plotted as the blue closed triangles in Fig. 2a, results in a Kratky plot that exhibits similar characteristics, but a slight peak at qRg ∼ 1.7 begins to emerge. At this crosslink density, the plateau begins at a similar qRg as the 0.1% XL sample and spans a similar range. Further, the increase from the plateau occurs at a similar qRg, indicating that these two nanostructures have comparable flexibility (i.e., identical Kuhn or persistence length). Thus, increasing the crosslinking by a factor of 4 (ca. 1 in 250 monomers is crosslinked) results in a similar collapsed polymer chain-like structure, and the beginnings of an observable surface as indicated by the peak emergence. Inspection of the scattering of the 0.4% XL PEHMA sample, plotted as the closed triangles in Fig. 2b also displays an extended plateau with a slight peak at qRg ∼ 2.4 in the Kratky plot. The deviation from the plateau occurs at a larger qRg than the polystyrene nanostructures, which is consistent with the fact that the PEHMA is more flexible (i.e., smaller Kuhn length) than the polystyrene. The shift of the peak to a larger qRg value for similar crosslink densities is also consistent with the greater flexibility of the low crosslinked PEHMA samples relative to the polystyrene structures.
All of the nanostructures with higher crosslink density (≥0.8%) show Kratky plots that differ significantly from those of the nanostructures with lower crosslink density, as shown in Fig. 3. In each of these samples, a clear and well-defined peak in the Kratky plot is observed indicating that all of these samples have definable surfaces and attain a globular particle-like structure. The upturn in normalized scattering intensity at larger qRg indicates that these particles still maintain some flexibility/deformability at local lengths scales (qRg ≳ 4–5).
More detailed analysis of these peaks provides further insight into the variation in structure of these particle-like structures with crosslink density. The peak height, position, and maximum scattering intensity of the Kratky peak at qRg ∼ 1.5–2, are determined and listed in Table 1. The peak height is defined as the difference between the local maximum peak intensity and the local minima following the peak. A nanostructure akin to an ideal Gaussian chain does not exhibit a peak in the Kratky plot, and as a result will not have a measurable peak height. Recalling that the low crosslinking density nanostructures present plateaus in their Kratky plot, this results in a minimal measurable peak height. As the crosslinking density increases and the nanostructures begin to take on more particle-like morphologies, the peak height increases. This is a particularly effective analysis to quantitatively compare the extent of the particle-like nature of the lower crosslinking nanostructures whose morphologies are somewhere between that of an ideal Gaussian chain and a fully formed particle.
Inspection of the peak height reinforces the previous qualitative observations of the Kratky plot that indicate a clear transition to particle-like behavior for nanostructures with a crosslink density of at least 0.8%. This transition can be seen in Fig. 4, which plots the Kratky plot peak height as a function of crosslink density. In this plot, the nanostructures fall into three distinct clusters. The 0.1% XL polystyrene is in a group of its own, there the dimensionless Kratky peak height is minimal, and is the only nanostructure categorized as behaving similarly to a random walk polymer chain. The two 0.4% XL nanostructures make up the second cluster corresponding to an intermediately collapsed polymer chain. While these nanostructures behave similar to the ultra-low crosslinking sample, indicating some chain-like behavior, they exhibit a discernible peak which is an indication of the development of a measurable surface, which is a property not associated with polymer chains. The remaining nanostructures (crosslink density ≥ 0.8%) all exhibit a distinct and measurable peak height denoting a well-defined particle like structure.
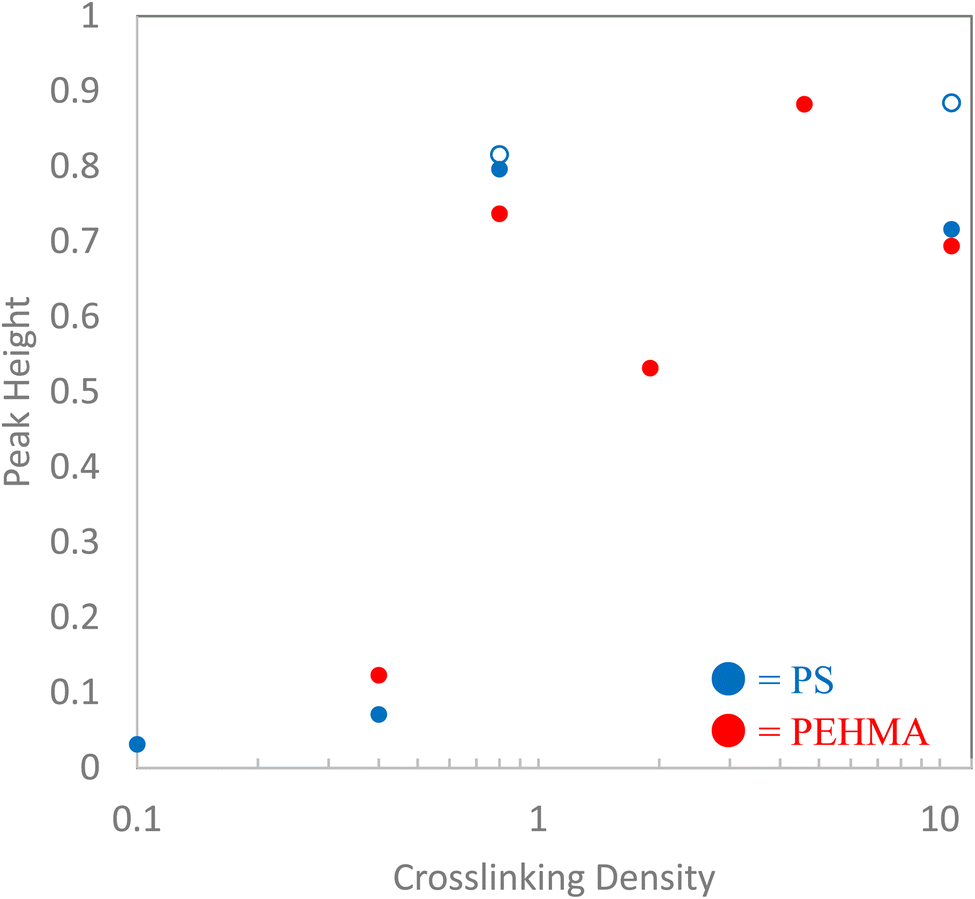 | ||
| Fig. 4 Peak height in the dimensionless Kratky plot analysis as a function of the crosslinking density of each polymeric nanostructure. Open markers correspond to a higher molecular weight. Error bars are smaller than the markers. | ||
Interestingly, inspection of Table 2 shows that the PEHMA nanostructures behave very similar to an ideal globular particle as their normalized peak maximum and position are very similar to the theoretical values of 1.1 and 1.74, respectively. The peak position of the 0.8% XL PEHMA nanostructure is most shifted from the expected value (qRg ∼ 1.63). This variation suggests that this lower crosslinked nanostructure maintains a higher local flexibility than its higher crosslinking counterparts, while this nanostructure still exhibits strong particle-like behavior. The PS nanostructures show a wider variation in their peak location compared to the PEHMA samples. A deviation from the theoretical qRg value of 1.74 indicates that these nanoparticles are not fully compacted and may show some asymmetry in their surface structure, while still exhibiting very strong particle-like characteristics. This suggests that the local rigidity of the styrene segments impacts the local assembly, limits the globule like nature of the particle, and results in a less compact structure than similar PEHMA nanoparticles.
| Nanoparticle | Peak heightb | Peak maximumc | Peak locationd (qRg) |
|---|---|---|---|
| a Black and blue text denote PS and PEHMA respectively. b Peak height – difference in normalized scatting intensity of local peak maxima and local minima following peak. c Peak maximum – normalized scattering intensity of local peak maximum. d Peak qRg location – qRg corresponding to local peaks maximum. | |||
| 0.1% XL PS | 0.033 ± 0.004 | 1.268 ± 0.078 | 1.761 ± 0.053 |
|

|

|

|
| 0.4% XL PS | 0.071 ± 0.001 | 1.160 ± 0.018 | 1.737 ± 0.013 |
|

|

|

|
| 0.8% XL PS (low MW) | 0.796 ± 0.004 | 1.150 ± 0.003 | 1.270 ± 0.005 |
| 0.8% XL PS (high MW) | 0.816 ± 0.001 | 1.220 ± 0.001 | 1.625 ± 0.014 |
|

|

|

|
|

|

|

|

|

|

|

|
| 10.7% XL PS (low MW) | 0.716 ± 0.003 | 1.223 ± 0.001 | 1.975 ± 0.046 |
| 10.7% XL PS (high MW) | 0.884 ± 0.001 | 1.137 ± 0.001 | 1.494 ± 0.011 |
Fractal dimension analysis
The measured fractal dimension, D, of the polymeric nanostructures provides corroborating evidence of the chain-like or particle-like nature of the nanostructures to the analysis and interpretation of the dimensionless Kratky plots. The measured fractal dimensions of each nanostructure are plotted in Fig. 5, where the blue symbols denote the polystyrene nanomaterials, while the red symbols denote the PEHMA structures. Both linear polymer chains (0% crosslinked) have fractal dimensions of approximately 1.5. This result is not surprising as it indicates that both polymeric nanostructures are slightly more swollen than a polymer in a good solvent. The fractal dimension of the crosslinked samples offers further evidence that their internal structures differ from that of the linear polymer chain. The 0.1% XL PS sample manifests as similar to random-walk polymer chain with a fractal dimension of 2.04, which is consistent with the Kratky analysis of this sample. Furthermore, the fractal dimension of the 0.4% crosslinked sample shows that the polystyrene nanostructure becomes slightly more collapsed (D = 2.21). This difference in fractal dimension illuminates a slight variation in the structures of the two low-crosslinked polystyrene samples that is not immediately evident from analysis of the Kratky plot. Interestingly, the fractal dimension of the 0.4% crosslinked PEHMA sample shows a comparable fractal dimension to the 0.1% XL PS sample despite showing a more pronounced peak in the Kratky plot. It's believed that this variation is a product of the higher flexibility of the PEHMA monomer, as indicated by the much longer Kratky plot plateau than either of the low-crosslink density polystyrene nanostructures. | ||
| Fig. 5 Relationship between crosslinking density of nanostructure and measured fractal dimension. Open circles denote higher molecular weight PS structures. Solid lines denote the fractal dimension of linear PS and PEHMA chains. Error bars are smaller than the markers. | ||
All nanostructures, both PEHMA and PS, with at least 0.8% crosslink density show fractal dimensions of at least 3 signifying that the cores of the nanostructures are collapsed, a surface emerges that contributes to the scattering (D > 3) and these nanostructures can be thought of as particles. In these samples, the fractal dimension offers further evidence that delineates these structures as particles, where progressing from a fractal dimension of 3 to 4 signifies the change in the surface of the particle from a rough surface to a smooth surface (i.e., a sharp interface). Thus, the increase in the measured fractal dimension of nanoparticles above 0.8% crosslinking shows that increasing crosslinking density correlates to the formation of smoother surfaces.
R g/RH – radius ratio analysis
The ratio of the radius of gyration to hydrodynamic radius (Rg/RH) of all of the polymeric nanostructures are shown in Fig. 6. For many of the nanostructures, the radius ratio corroborates the interpretation of the Kratky plot and Fractal dimension analyses. The linear PEHMA chain possesses a radius ratio of 1.7, while the linear PS chain's radius ratio is slightly lower at 1.58. Recalling the expected radius ratio of a self-avoiding walk polymer chain (i.e. in a good solvent) as 1.56, these values indicate that both linear chains adhere to a self-avoiding walk conformation. There is some variation of the radius ratios of nanostructures with comparable crosslinking densities, which can be attributed to the variation in flexibility of the PS and PEHMA segments, where more flexible PEHMA chains exhibit a larger radius ratio. Since PEHMA has a smaller Kuhn length than polystyrene, but shows a larger radius ratio, this suggests that while both linear chains adhere to a self-avoiding walk conformation, the PHEMA is slightly more soluble in THF than PS. This is an artifact that was not immediately identifiable in the previous analyses. | ||
| Fig. 6 Polymeric nanostructure's radius ratio (Rg/RH) as a function of crosslinking density. Open symbols denote high MW PS structures. Solid lines correspond to linear chains. | ||
Interpretation of the radius ratios of the low crosslinking density samples provides additional insight that is not obvious from the Kratky or fractal dimension analyses. The 0.1% XL polystyrene sample exhibited strong signs of a random walk polymer chain in the Kratky plot and fractal dimension, but only possesses a radius ratio of 0.93, which is well below the theoretical value of a random walk polymer chain radius ratio of 1.24. This lower radius ratio is consistent with that of a star polymer in good solvent,78,79 suggesting that this low crosslinking density nanostructure is star-like in structure. This is consistent with previous studies which have characterized these nanostructures as a fuzzy sphere with the crosslinks concentrated at core of the structure with an outer corona of loops and tails.36,80–83 The 0.1% crosslink density nanostructure corresponds to a crosslink between every 1 in 1000 monomers. The molecular weight of this nanostructure is below 100 kDa, therefore, on average, there is 1–2 crosslinks in these nanostructures. A nanostructure with one or two divinyl benzene crosslinks near the core will resemble a multi-armed star-like topology, as depicted in Fig. 7. In this figure, the chains connect near the core at a single crosslink, as designated by the red box, which results in four “arms” emerging from that crosslink. Therefore, the 0.1% XL nanostructure is better described as a star like structure than a slightly collapsed, random-walk chain, as the previous analyses suggest.
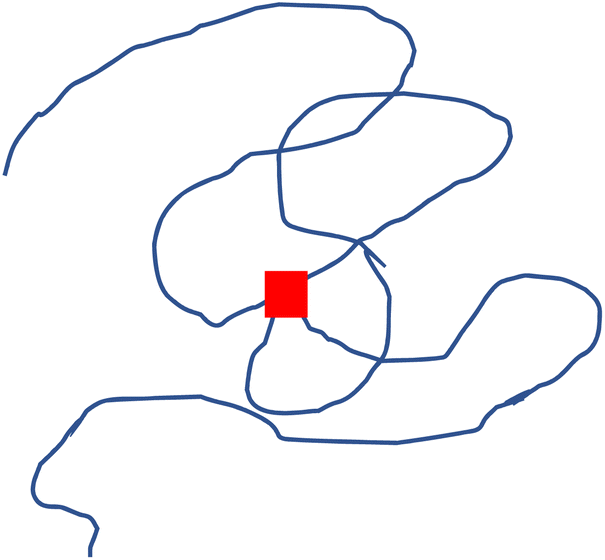 | ||
| Fig. 7 Illustration of a polymer chain with a single crosslink (red square), emphasizing the similarity to a four-armed star polymer. | ||
Comparing the 0.4% XL polystyrene to the 0.1% XL polystyrene nanostructure, the radius ratio continues to decrease, consistent with the collapse of the structure, which is in line with the Kratky and fractal analyses. The 0.4% XL PEHMA structure exhibits a radius ratio of 1.07, which indicates the nanostructure is slightly more collapsed than a random walk polymer chain, while the 0.4% XL polystyrene nanostructure exhibits a decrease in its radius ratio compared to the 0.1% XL nanostructure indicating that it is further collapsed.
At 0.8% XL the radius ratios of the polymeric nanostructures are near that of a homogeneous globule at approximately 0.8, which indicates a near complete collapse of the chain, aligning with the particle-like characterization that arose from the other analyses. The higher molecular weight polystyrene sample has a radius ratio far below that of a hard sphere which is consistent with a core–shell structure, this suggests that while the two 0.8% XL polystyrene samples have similar particle like structures, the internal morphology of the higher molecular weight is much less homogenous. The radius ratios of the PEHMA samples with crosslinking density above 0.8% also adhere to a core–shell morphology. The interpretation that these nanostructures form a core–shell morphology is consistent with the structural characterization of similar polystyrene nanostructures at crosslinking densities of at least 0.8% using SANS.31 In these studies, the scattering of the polystyrene samples are best modeled by a fuzzy-sphere Gaussian gel model that have a measurable core and a fuzzy outer shell.36 The fit of the SANS scattering of the PEHMA nanoparticles to the fuzzy-sphere Gaussian gel model was confirmed and is presented in the ESI.† Furthermore, the Rg/RH increases with increasing crosslink density in the PEHMA sample, approaching the theoretical value for a hard sphere at 10% crosslinking. Thus, the nanoparticles become more homogeneous, and less core–shell like with increased crosslink density. This interpretation also agrees well with the fractal dimension analysis where the nanostructures approach a smooth surfaced, compact particle-like structure as the crosslinking density increases.
In summary, the particle like nature of crosslinked soft nanoparticles is quantified by a thorough analysis of small angle neutron scattering data using of Kratky analysis, and determination of the fractal dimension and radius ratio. The results of these analyses show that these soft polymeric nanostructures can be described as particle-like for any crosslinking density of at least 0.8%, regardless of monomer rigidity or nanostructure molecular weight. This result is especially surprising as it only requires 1 crosslink for every 125 monomers to develop a clear, measurable surface, the hallmark of nanoparticle functionality. Samples with crosslinking densities between 0.1% and 0.8% show a significant amount of collapse from a swollen polymer chain in a good solvent, such that their structure is best described as between a star-like polymer, a random walk chain and a completely collapsed particle. These transitive structures exhibit both chain-like and particle-like characteristics. A plot of the dimensionless Kratky plot peak height as a function of crosslinking density (Fig. 4) offers a depiction of the transition among these structural morphologies. Additional fractal dimension and radius ratio analyses provide additional insight into the extent of the particle-like structure of the crosslinked nanostructures. These additional analyses further confirm the chain-like and particle-like morphologies of nanostructures that are readily characterized by the dimensionless Kratky plot. A fractal dimension of a nanostructure offers additional detail in the appearance of a surface, and provides a measure of the relative collapse of the nanostructure's chains not easily seen in the Kratky analysis. The fractal dimension analysis also allows for a measure of the homogeneity of the surface of clear particle-like structures. The analysis of the radius ratio further enhances our understanding of the structures of the nanoparticles. The radius ratio offers insight into both star-like and core–shell like morphologies that would otherwise merely appear as varying degrees of chain collapse with the Kratky plot and fractal dimension analyses.
As discussed in the introduction, previous studies have shown that SCNPs with a crosslinking density of 2.5% do not present particle-like characteristics;64 thus, it is somewhat surprising that the soft nanostructures studied here present such strong a particle-like identity at a much lower crosslinking density of 0.8%. We ascribe this difference to the internal structure and distribution of the crosslinks in the nanoparticle. The soft nanoparticles studied here are known to exhibit a structure that is depicted in Fig. 1, where the crosslinks congregate towards the center of the structure producing a core–shell architecture. This distribution of crosslinks appears to play a vital role in their particle-like characteristics. In contrast, the crosslinks within a SCNP are more homogeneously dispersed throughout the structure. This distribution of crosslinks appears to require higher degree of crosslinking to exhibit a particle-like morphology. The results of these analyses, therefore, emphasize the structural differences between a SCNP and a soft nanoparticle synthesized via in situ crosslinking and should impact their performance and properties.
Conclusions
Small angle neutron scattering studies have been completed to provide insight into the transition from a polymer chain to a nanoparticle via internal crosslinking. A combination of analyses of the SANS curves, including the dimensionless Kratky plot, the fractal dimension, and the ratio of Rg/RH, provides insight into the particle-like properties of the examined polymer constructs. These results show that the primary characteristic that delineates a polymeric chain from a nanoparticle is not its size, but the presence of a surface, which can be detected via these analyses. Using the idea that a nanostructure requires the presence of a surface to be a nanoparticle leads to the surprising conclusion that crosslinking densities as low as 0.8%, or 1 crosslink for every 125 monomers, is sufficient to realize very strong particle-like characteristics. This indicates that even at these extremely low crosslinking densities, a measurable surface has developed in these polymeric nanostructures.This study therefore provides analyses and insights that enable the delineation of particle-like characteristics of a polymeric nanostructure from chain-like structures. It also establishes clear domains of chain-like and particle-like morphologies with variation in crosslink density and identifies a transitive state at the lowest crosslinking densities of the nanostructure. These results clearly show that the overarching characteristic that controls whether a polymeric nanostructure is a chain or a nanoparticle is its crosslink density, with segmental flexibility or nanostructure molecular weight as secondary effects.
Conflicts of interest
There are no conflicts to declare.Acknowledgements
This research was supported by the U.S. Department of Energy, Office of Science, Basic Energy Sciences, Materials Sciences and Engineering Division. A portion of this research was also completed at ORNL's High Flux Isotope Reactor, which was sponsored by the Scientific User Facilities Division, Office of Basic Energy Sciences, US Department of Energy. This work benefited from the use of the SasView application, originally developed under NSF award DMR-0520547. SasView contains code developed with funding from the European Union's Horizon 2020 research and innovation program under the SINE2020 project, grant agreement No 654000.References
- S. K. Kumar, B. C. Benicewicz, R. A. Vaia and K. I. Winey, 50th Anniversary Perspective: Are Polymer Nanocomposites Practical for Applications?, Macromolecules, 2017, 50(3), 714–731 CrossRef CAS.
- S. K. Kumar, N. Jouault, B. Benicewicz and T. Neely, Nanocomposites with Polymer Grafted Nanoparticles, Macromolecules, 2013, 46(9), 3199–3214 CrossRef CAS.
- J. Loste, J.-M. Lopez-Cuesta, L. Billon, H. Garay and M. Save, Transparent polymer nanocomposites: An overview on their synthesis and advanced properties, Prog. Polym. Sci., 2019, 89, 133–158 CrossRef CAS.
- D. J. Kim, M. J. Jo and S. Y. Nam, A review of polymer–nanocomposite electrolyte membranes for fuel cell application, J. Ind. Eng. Chem., 2015, 21, 36–52 CrossRef CAS.
- W. Zhang, G. Camino and R. Yang, Polymer/polyhedral oligomeric silsesquioxane (POSS) nanocomposites: An overview of fire retardance, Prog. Polym. Sci., 2017, 67, 77–125 CrossRef CAS.
- J. Shen, X. Li, X. Shen and J. Liu, Insight into the Dispersion Mechanism of Polymer-Grafted Nanorods in Polymer Nanocomposites: A Molecular Dynamics Simulation Study, Macromolecules, 2017, 50(2), 687–699 CrossRef CAS.
- M. Eriksson, J. Hamers, T. Peijs and H. Goossens, The Influence of Graft Length and Density on Dispersion, Crystallisation and Rheology of Poly(ε-caprolactone)/Silica Nanocomposites, Molecules, 2019, 24(11), 2106 CrossRef PubMed.
- K. R. Medidhi and V. Padmanabhan, Diffusion of polymer-grafted nanoparticles in a homopolymer matrix, J. Chem. Phys., 2019, 150(4), 044905 CrossRef PubMed.
- H. W. Yong and A. Kakkar, Nanoengineering Branched Star Polymer-Based Formulations: Scope, Strategies, and Advances, Macromol. Biosci., 2021, 21(8), 2100105 CrossRef CAS PubMed.
- S. Rostom, B. T. White, G. Yuan, T. Saito and M. D. Dadmun, Polymer Chain Diffusion in All-Polymer Nanocomposites: Confinement vs Chain Acceleration, J. Phys. Chem. C, 2020, 124(34), 18834–18839 CrossRef CAS.
- U. M. Shrestha, L. Han, T. Saito, K. S. Schweizer and M. D. Dadmun, Mechanism of Soft Nanoparticle Diffusion in Entangled Polymer Melts, Macromolecules, 2020, 53(17), 7580–7589 CrossRef.
- J. Maiz, E. Verde-Sesto, I. Asenjo-Sanz, L. Mangin-Thro, B. Frick, J. A. Pomposo, A. Arbe and J. Colmenero, Disentangling Component Dynamics in an All-Polymer Nanocomposite Based on Single-Chain Nanoparticles by Quasielastic Neutron Scattering, Macromolecules, 2022, 55(6), 2320–2332 CrossRef CAS PubMed.
- R. Chen and E. B. Berda, 100th Anniversary of Macromolecular Science Viewpoint: Re-examining Single-Chain Nanoparticles, ACS Macro Lett., 2020, 9(12), 1836–1843 CrossRef CAS PubMed.
- T. Chen, H.-J. Qian, Y.-L. Zhu and Z.-Y. Lu, Structure and Dynamics Properties at Interphase Region in the Composite of Polystyrene and Cross-Linked Polystyrene Soft Nanoparticle, Macromolecules, 2015, 48(8), 2751–2760 CrossRef CAS.
- M. E. Mackay, A. Tuteja, P. M. Duxbury, C. J. Hawker, B. Van Horn, Z. Guan, G. Chen and R. S. Krishnan, General Strategies for Nanoparticle Dispersion, Science, 2006, 311(5768), 1740–1743 CrossRef CAS PubMed.
- B. Miller, A. E. Imel, W. Holley, D. Baskaran, J. W. Mays and M. D. Dadmun, The Role of Nanoparticle Rigidity on the Diffusion of Linear Polystyrene in a Polymer Nanocomposite, Macromolecules, 2015, 48(22), 8369–8375 CrossRef CAS.
- D. W. Holley, M. Ruppel, J. W. Mays, V. S. Urban and D. Baskaran, Polystyrene nanoparticles with tunable interfaces and softness, Polymer, 2014, 55(1), 58–65 CrossRef CAS.
- J. Jordan, K. I. Jacob, R. Tannenbaum, M. A. Sharaf and I. Jasiuk, Experimental trends in polymer nanocomposites—a review, Mater. Sci. Eng., A, 2005, 393(1), 1–11 CrossRef.
- D. Ciprari, K. Jacob and R. Tannenbaum, Characterization of Polymer Nanocomposite Interphase and Its Impact on Mechanical Properties, Macromolecules, 2006, 39(19), 6565–6573 CrossRef CAS.
- U. Khan, K. Ryan, W. J. Blau and J. N. Coleman, The effect of solvent choice on the mechanical properties of carbon nanotube–polymer composites, Compos. Sci. Technol., 2007, 67(15), 3158–3167 CrossRef CAS.
- P. Banerjee, D. Conklin, S. Nanayakkara, T.-H. Park, M. J. Therien and D. A. Bonnell, Plasmon-Induced Electrical Conduction in Molecular Devices, ACS Nano, 2010, 4(2), 1019–1025 CrossRef CAS PubMed.
- C. Mattevi, G. Eda, S. Agnoli, S. Miller, K. A. Mkhoyan, O. Celik, D. Mastrogiovanni, G. Granozzi, E. Garfunkel and M. Chhowalla, Evolution of Electrical, Chemical, and Structural Properties of Transparent and Conducting Chemically Derived Graphene Thin Films, Adv. Funct. Mater., 2009, 19(16), 2577–2583 CrossRef CAS.
- F. Puosi and D. Leporini, Scaling between Relaxation, Transport, and Caged Dynamics in Polymers: From Cage Restructuring to Diffusion, J. Phys. Chem. B, 2011, 115(48), 14046–14051 CrossRef CAS PubMed.
- Y. Ying, R. K. Saini, F. Liang, A. K. Sadana and W. E. Billups, Functionalization of Carbon Nanotubes by Free Radicals, Org. Lett., 2003, 5(9), 1471–1473 CrossRef CAS PubMed.
- J. L. Bahr and J. M. Tour, Covalent chemistry of single-wall carbon nanotubes, J. Mater. Chem., 2002, 12(7), 1952–1958 RSC.
- J.-E. Huang, X.-H. Li, J.-C. Xu and H.-L. Li, Well-dispersed single-walled carbon nanotube/polyaniline composite films, Carbon, 2003, 41(14), 2731–2736 CrossRef CAS.
- J. Chen, H. Liu, W. A. Weimer, M. D. Halls, D. H. Waldeck and G. C. Walker, Noncovalent Engineering of Carbon Nanotube Surfaces by Rigid, Functional Conjugated Polymers, J. Am. Chem. Soc., 2002, 124(31), 9034–9035 CrossRef CAS PubMed.
- D. Baskaran, J. W. Mays and M. S. Bratcher, Noncovalent and Nonspecific Molecular Interactions of Polymers with Multiwalled Carbon Nanotubes, Chem. Mater., 2005, 17(13), 3389–3397 CrossRef CAS.
- X. Tian, R. Xue, F. Yang, L. Yin, S. Luan and H. Tang, Single-Chain Nanoparticle-Based Coatings with Improved Bactericidal Activity and Antifouling Properties, Biomacromolecules, 2021, 22(10), 4306–4315 CrossRef CAS PubMed.
- K. Elkhoury, C. S. Russell, L. Sanchez-Gonzalez, A. Mostafavi, T. J. Williams, C. Kahn, N. A. Peppas, E. Arab-Tehrany and A. Tamayol, Soft-Nanoparticle Functionalization of Natural Hydrogels for Tissue Engineering Applications, Adv. Healthcare Mater., 2019, 8(18), 1900506 CrossRef PubMed.
- H. J. Martin, B. T. White, G. Yuan, T. Saito and M. D. Dadmun, Relative Size of the Polymer and Nanoparticle Controls Polymer Diffusion in All-Polymer Nanocomposites, Macromolecules, 2019, 52(7), 2843–2852 CrossRef CAS.
- A. P. P. Kröger, N. M. Hamelmann, A. Juan, S. Lindhoud and J. M. J. Paulusse, Biocompatible Single-Chain Polymer Nanoparticles for Drug Delivery—A Dual Approach, ACS Appl. Mater. Interfaces, 2018, 10(37), 30946–30951 CrossRef PubMed.
- A. Latorre-Sánchez and J. A. Pomposo, Recent bioinspired applications of single-chain nanoparticles, Polym. Int., 2016, 65(8), 855–860 CrossRef.
- J. H. Na, S.-Y. Lee, S. Lee, H. Koo, K. H. Min, S. Y. Jeong, S. H. Yuk, K. Kim and I. C. Kwon, Effect of the stability and deformability of self-assembled glycol chitosan nanoparticles on tumor-targeting efficiency, J. Controlled Release, 2012, 163(1), 2–9 CrossRef CAS PubMed.
- A. C. Anselmo, M. Zhang, S. Kumar, D. R. Vogus, S. Menegatti, M. E. Helgeson and S. Mitragotri, Elasticity of Nanoparticles Influences Their Blood Circulation, Phagocytosis, Endocytosis, and Targeting, ACS Nano, 2015, 9(3), 3169–3177 CrossRef CAS PubMed.
- H. J. Martin, B. T. White, C. J. Scanlon, T. Saito and M. D. Dadmun, Tunable synthetic control of soft polymeric nanoparticle morphology, Soft Matter, 2017, 13(46), 8849–8857 RSC.
- T. Chen, H.-Y. Zhao, R. Shi, W.-F. Lin, X.-M. Jia, H.-J. Qian, Z.-Y. Lu, X.-X. Zhang, Y.-K. Li and Z.-Y. Sun, An unexpected N-dependence in the viscosity reduction in all-polymer nanocomposite, Nat. Commun., 2019, 10(1), 5552 CrossRef CAS PubMed.
- E. Blasco, B. T. Tuten, H. Frisch, A. Lederer and C. Barner-Kowollik, Characterizing single chain nanoparticles (SCNPs): a critical survey, Polym. Chem., 2017, 8(38), 5845–5851 RSC.
- A. M. Hanlon, C. K. Lyon and E. B. Berda, What Is Next in Single-Chain Nanoparticles?, Macromolecules, 2016, 49(1), 2–14 CrossRef CAS.
- N. Ormategui, I. García, D. Padro, G. Cabañero, H. J. Grande and I. Loinaz, Synthesis of single chain thermoresponsive polymer nanoparticles, Soft Matter, 2012, 8(3), 734–740 RSC.
- A. M. Hanlon, R. Chen, K. J. Rodriguez, C. Willis, J. G. Dickinson, M. Cashman and E. B. Berda, Scalable Synthesis of Single-Chain Nanoparticles under Mild Conditions, Macromolecules, 2017, 50(7), 2996–3003 CrossRef CAS.
- J. Zhang, G. Gody, M. Hartlieb, S. Catrouillet, J. Moffat and S. Perrier, Synthesis of Sequence-Controlled Multiblock Single Chain Nanoparticles by a Stepwise Folding–Chain Extension–Folding Process, Macromolecules, 2016, 49(23), 8933–8942 CrossRef CAS.
- J. A. Pomposo, I. Perez-Baena, F. Lo Verso, A. J. Moreno, A. Arbe and J. Colmenero, How Far Are Single-Chain Polymer Nanoparticles in Solution from the Globular State?, ACS Macro Lett., 2014, 3(8), 767–772 CrossRef CAS PubMed.
- C. K. Lyon, A. Prasher, A. M. Hanlon, B. T. Tuten, C. A. Tooley, P. G. Frank and E. B. Berda, A brief user's guide to single-chain nanoparticles, Polym. Chem., 2015, 6(2), 181–197 RSC.
- A. Rasheed, H. G. Chae, S. Kumar and M. D. Dadmun, Polymer nanotube nanocomposites: Correlating intermolecular interaction to ultimate properties, Polymer, 2006, 47(13), 4734–4741 CrossRef CAS.
- J. De-La-Cuesta, E. González, A. J. Moreno, A. Arbe, J. Colmenero and J. A. Pomposo, Size of Elastic Single-Chain Nanoparticles in Solution and on Surfaces, Macromolecules, 2017, 50(16), 6323–6331 CrossRef CAS.
- A. Arbe, J. A. Pomposo, A. J. Moreno, F. LoVerso, M. González-Burgos, I. Asenjo-Sanz, A. Iturrospe, A. Radulescu, O. Ivanova and J. Colmenero, Structure and dynamics of single-chain nano-particles in solution, Polymer, 2016, 105(suppl. C), 532–544 CrossRef CAS.
- A. E. Imel, S. Rostom, W. Holley, D. Baskaran, J. W. Mays and M. D. Dadmun, The tracer diffusion coefficient of soft nanoparticles in a linear polymer matrix, RSC Adv., 2017, 7(25), 15574–15581 RSC.
- W. Wichaita, Y.-G. Kim, P. Tangboriboonrat and H. Thérien-Aubin, Polymer-functionalized polymer nanoparticles and their behaviour in suspensions, Polym. Chem., 2020, 11(12), 2119–2128 RSC.
- A. B. Metzner, Rheology of Suspensions in Polymeric Liquids, J. Rheol., 1985, 29(6), 739–775 CrossRef CAS.
- A. Einstein, On the theory of Brownian movement, Ann. Phys., 1906, 19, 371–381 CrossRef CAS.
- M. E. Mackay, T. T. Dao, A. Tuteja, D. L. Ho, B. Van Horn, H.-C. Kim and C. J. Hawker, Nanoscale effects leading to non-Einstein-like decrease in viscosity, Nat. Mater., 2003, 2, 762 CrossRef CAS PubMed.
- J. S. Meth, S. Gam, J. Choi, C.-C. Lin, R. J. Composto and K. I. Winey, Excluded Volume Model for the Reduction of Polymer Diffusion into Nanocomposites, J. Phys. Chem. B, 2013, 117(49), 15675–15683 CrossRef CAS PubMed.
- W. Cui, W. You, Z. Sun and W. Yu, Decoupled Polymer Dynamics in Weakly Attractive Poly(methyl methacrylate)/Silica Nanocomposites, Macromolecules, 2021, 54(12), 5484–5497 CrossRef CAS.
- E. J. Bailey, R. A. Riggleman and K. I. Winey, Polymer Conformations and Diffusion through a Monolayer of Confining Nanoparticles, Macromolecules, 2020, 53(19), 8171–8180 CrossRef CAS.
- S. Gam, J. S. Meth, S. G. Zane, C. Chi, B. A. Wood, K. I. Winey, N. Clarke and R. J. Composto, Polymer diffusion in a polymer nanocomposite: effect of nanoparticle size and polydispersity, Soft Matter, 2012, 8(24), 6512–6520 RSC.
- C.-C. Lin, K. Ohno, N. Clarke, K. I. Winey and R. J. Composto, Macromolecular Diffusion through a Polymer Matrix with Polymer-Grafted Chained Nanoparticles, Macromolecules, 2014, 47(15), 5357–5364 CrossRef CAS.
- W.-S. Tung, P. J. Griffin, J. S. Meth, N. Clarke, R. J. Composto and K. I. Winey, Temperature-Dependent Suppression of Polymer Diffusion in Polymer Nanocomposites, ACS Macro Lett., 2016, 5(6), 735–739 CrossRef CAS PubMed.
- J.-P. Jolivet, C. Froidefond, A. Pottier, C. Chanéac, S. Cassaignon, E. Tronc and P. Euzen, Size tailoring of oxide nanoparticles by precipitation in aqueous medium. A semi-quantitative modelling, J. Mater. Chem., 2004, 14(21), 3281–3288 RSC.
- R. Lamber, S. Wetjen and N. I. Jaeger, Size dependence of the lattice parameter of small palladium particles, Phys. Rev. B, 1995, 51(16), 10968–10971 CrossRef CAS PubMed.
- P. Ayyub, V. R. Palkar, S. Chattopadhyay and M. Multani, Effect of crystal size reduction on lattice symmetry and cooperative properties, Phys. Rev. B, 1995, 51(9), 6135–6138 CrossRef CAS PubMed.
- S. Brice-Profeta, M. A. Arrio, E. Tronc, N. Menguy, I. Letard, C. Cartier dit Moulin, M. Noguès, C. Chanéac, J. P. Jolivet and P. Sainctavit, Magnetic order in γ-Fe2O3 nanoparticles: a XMCD study, J. Magn. Magn. Mater., 2005, 288, 354–365 CrossRef CAS.
- M. Auffan, J. Rose, J.-Y. Bottero, G. V. Lowry, J.-P. Jolivet and M. R. Wiesner, Towards a definition of inorganic nanoparticles from an environmental, health and safety perspective, Nat. Nanotechnol., 2009, 4(10), 634–641 CrossRef CAS PubMed.
- A. Tuteja, M. E. Mackay, C. J. Hawker, B. Van Horn and D. L. Ho, Molecular architecture and rheological characterization of novel intramolecularly crosslinked polystyrene nanoparticles, J. Polym. Sci., Part B: Polym. Phys., 2006, 44(14), 1930–1947 CrossRef CAS.
- SasView, http://www.sasview.org/.
- V. Receveur-Brechot and D. Durand, How random are intrinsically disordered proteins? A small angle scattering perspective, Curr. Protein Pept. Sci., 2012, 13(1), 55–75 CrossRef CAS PubMed.
- V. M. Burger, D. J. Arenas and C. M. Stultz, A Structure-free Method for Quantifying Conformational Flexibility in proteins, Sci. Rep., 2016, 6(1), 29040 CrossRef CAS PubMed.
- K. Amitani, K. Terao, Y. Nakamura and T. Norisuye, Small-Angle X-Ray Scattering from Polystyrene Polymacromonomers in Cyclohexane, Polym. J., 2005, 37(4), 324–331 CrossRef CAS.
- G. Allegra, E. Colombo and F. Ganazzoli, Linear and regular star polymer in a good solvent, Macromolecules, 1993, 26(2), 330–338 CrossRef CAS.
- R. Upadhya, N. S. Murthy, C. L. Hoop, S. Kosuri, V. Nanda, J. Kohn, J. Baum and A. J. Gormley, PET-RAFT and SAXS: High Throughput Tools To Study Compactness and Flexibility of Single-Chain Polymer Nanoparticles, Macromolecules, 2019, 52(21), 8295–8304 CrossRef CAS PubMed.
- D. Durand, C. Vivès, D. Cannella, J. Pérez, E. Pebay-Peyroula, P. Vachette and F. Fieschi, NADPH oxidase activator p67(phox) behaves in solution as a multidomain protein with semi-flexible linkers, J. Struct. Biol., 2010, 169(1), 45–53 CrossRef CAS PubMed.
- B. Hammouda, A new Guinier-Porod model, J. Appl. Crystallogr., 2010, 43(4), 716–719 CrossRef CAS.
- G. Beaucage, Small-Angle Scattering from Polymeric Mass Fractals of Arbitrary Mass-Fractal Dimension, J. Appl. Crystallogr., 1996, 29(2), 134–146 CrossRef CAS.
- M. Nygaard, B. B. Kragelund, E. Papaleo and K. Lindorff-Larsen, An Efficient Method for Estimating the Hydrodynamic Radius of Disordered Protein Conformations, Biophys. J., 2017, 113(3), 550–557 CrossRef CAS PubMed.
- K. L. Linegar, A. E. Adeniran, A. F. Kostko and M. A. Anisimov, Hydrodynamic radius of polyethylene glycol in solution obtained by dynamic light scattering, Colloid J., 2010, 72, 279–281 CrossRef CAS.
- Y. Oono and M. Kohmoto, Renormalization group theory of transport properties of polymer solutions. I. Dilute solutions, J. Chem. Phys., 1983, 78(1), 520–528 CrossRef CAS.
- E. Kokufuta, K. Ogawa, R. Doi, R. Kikuchi and R. S. Farinato, Geometrical characteristics of polyelectrolyte nanogel particles and their polyelectrolyte complexes studied by dynamic and static light scattering, J. Phys. Chem. B, 2007, 111(29), 8634–8640 CrossRef CAS PubMed.
- K. Ishizu, T. Ono and S. Uchida, Geometrical structure of star polymers in solution, Macromol. Chem. Phys., 1997, 198(10), 3255–3265 CrossRef CAS.
- K. Ishizu, K. Sunahara and S.-i. Asai, Synthesis and solution properties of gradient-modulus star copolymers, Polymer, 1998, 39(4), 953–957 CrossRef CAS.
- E. Galbis, M. V. de-Paz, N. Iglesias, B. Lacroix, A. Alcudia and J. A. Galbis, Core cross-linked nanoparticles from self-assembling polyfma-based micelles. Encapsulation of lipophilic molecules, Eur. Polym. J., 2017, 89, 406–418 CrossRef CAS.
- M. D. D. Hossain, L. T. B. Tran, J. M. Park and K. T. Lim, Facile synthesis of core-surface crosslinked nanoparticles by interblock RAFT polymerization, J. Polym. Sci., Part A: Polym. Chem., 2010, 48(22), 4958–4964 CrossRef CAS.
- B. Liu and S. Thayumanavan, Three-Component Sequential Reactions for Polymeric Nanoparticles with Tailorable Core and Surface Functionalities, Chem, 2019, 5(12), 3166–3183 CAS.
- J. Matsuno, T. Kanamaru, K. Arai, R. Tanaka, J. H. Lee, R. Takahashi, K. Sakurai and S. Fujii, Synthesis and characterization of nanoemulsion-mediated core crosslinked nanoparticles, and in vivo pharmacokinetics depending on the structural characteristics, J. Controlled Release, 2020, 324, 405–412 CrossRef CAS PubMed.
Footnote |
| † Electronic supplementary information (ESI) available. See DOI: https://doi.org/10.1039/d2na00617k |
| This journal is © The Royal Society of Chemistry 2022 |