Oxygen vacancy enriched Cu-WO3 hierarchical structures for the thermal decomposition of ammonium perchlorate†
Jing
Shi
ab,
Xiangying
Xing
b,
Huixiang
Wang
*c,
Lin
Ge
a,
Haizhen
Sun
a and
Baoliang
Lv
 *c
*c
aInstitutional Center for Shared Technologies and Facilities, State Key Laboratory of Coal Conversion, Institute of Coal Chemistry, Chinese Academy of Sciences, Taiyuan, 030001, China
bUniversity of Chinese Academy of Sciences, Beijing 100049, China
cState Key Laboratory of Coal Conversion, Institute of Coal Chemistry, Chinese Academy of Sciences, Taiyuan, 030001, China
First published on 9th November 2021
Abstract
The design and fabrication of efficient catalysts for ammonium perchlorate (AP) decomposition is crucial for the performance of composite solid propellants. Herein, a novel hierarchical structure material of Cu-WO3 nanowire arrays on a nanoflower flake (Cu-WO3 NANF) was synthesized by a facile hydrothermal reaction. The negatively charged (001) polar facets of hexagonal WO3 and the action of Cu2+ induced growth were two important factors for the formation of hierarchical structures. The Cu-WO3 NANF exhibited remarkable catalytic activity for the thermal decomposition of AP. The temperature and activation energy of high temperature AP decomposition were significantly decreased to 378.3 °C and 147.01 kJ mol−1, respectively, which are attributed to the more oxygen vacancies and lower band gap energy of the Cu-WO3 NANF. Thus, it was excited at a lower heat to produce activated species. Under the strong adsorption of Cu-WO3 NANF surface Lewis acid, the activated species can react with NH3 quickly and deeply to produce N2, N2O, NO2 and NO gases, accompanied by a heat release of up to 1118 J g−1. The proposed catalytic mechanism was further corroborated by the in situ TG-MS result. This facile strategy provided a new idea for the design of hierarchical catalysts, and our research opened up a new field for WO3 applications.
1. Introduction
Because of the high oxygen content, high enthalpy and ease of availability, ammonium perchlorate (AP) is often used as a significant oxidizer for composite solid propellants.1 Its thermal decomposition mainly goes through two stages: low temperature decomposition (LTD) and high temperature decomposition (HTD). In the end, AP can be decomposed into gas mixtures of NO, N2O, NH3, O2 and ClO2 by releasing a lot of heat and thereby producing a powerful pushing force.2 Aiming at more powerful solid fuel rockets, researchers have been working to acquire the decomposition of AP at a lower temperature with higher heat release.3 The most effective strategy is to add a thermal combustion catalyst to AP decomposition. Various transition metal oxides were applied to catalyze AP decomposition, such as CeO2,4 Co3O4,5,6 MnO2,7 Fe2O3,8 CuO,9 and ZnO.10Tungsten oxide (WO3) is widely used in many fields due to its narrow band gap, including chemical catalytic oxidation,11,12 photocatalysis,13,14 and electrochemical supercapacitors.15,16 But so far, AP decomposition catalyzed by WO3 has not been reported. Generally, the catalytic performance of metal oxides is highly sensitive to oxygen vacancies and surface acidic sites.4,11,17,18 The WOx structure with a non-stoichiometric ratio often appears during the preparation of WO3, accompanied by lots of oxygen vacancies.19,20 It has been reported that the key factor limiting AP decomposition is the accumulation of NH3 on the AP surface, resulting in a stagnating stage.6 The N atom of NH3 gas has stronger ability to donate electrons, and Lewis acid sites are just good electron acceptors. From this point of view, increasing the amount of Lewis acid sites could facilitate the adsorption of NH3, and then weaken the accumulation of NH3, which is critical to the subsequent decomposition reaction. As it proceeds, WO3 is a typical acidic metal oxide with abundant acid sites on its surface.
Moreover, the structural characteristics and morphologies also affect the catalytic performance of metal oxides.6,16,21 Compared with other dimensions, one-dimensional WO3 nanostructures have the advantages of smoother ions and charge transfer, and the hierarchical structures assembled from them have a larger specific surface area, ensuring the crystallinity. Therefore, a useful strategy is expected to achieve superior performance for the design of catalysts with hierarchical structures based on one-dimensional nanostructures.
Some achievements have been made towards the synthesis of hierarchical WO3 consisting of one-dimensional nanostructures, but these reports have been based on the introduction of growth substrates. For example, Diao et al. prepared a WO3 hierarchical material by virtue of nickel foam, which provided efficient pathways for electron and mass transfer, showing excellent catalytic activity for the oxygen evolution reaction.17 Zhang et al. synthesized a series of hierarchical hexagonal WO3 films on fluorine-doped tin oxide glass, and they exhibited better photocatalytic O2 generation activity.22 The above hierarchical structure material grown on the substrate can only be applied for a specific reaction. The preparation of substrate-free WO3 hierarchical structures in a simple way remains a challenge.
According to the theoretical calculations, Chen et al. confirmed that one-dimensional WO3 structures can be fabricated by the action of monovalent cations in the absence of substrates.23 Jia et al. proved that WO3 nanorod arrays could be prepared without substrates. In their work, the nucleation and growth of WO3 proceeded continuously, leading to a flake structure in the initial growth stage. After that, WO3 crystal nuclei grew along the [001] direction and eventually developed into a nanorod array.24 On the basis of these studies, we tried to limit the growth of nanorods and make them into nanowires in the later stage, so as to get the three-dimensional hierarchical structure of nanowire arrays grown on nanoflakes. How to limit the growth of nanorods? Our group's previous work shows that high valence metal cations (Fe3+ and Cr3+) could not only increase the oxygen vacancy concentration, but also effectively prevent the crystallization and growth of WO3, and finally, WO3 with different morphologies and crystal structures were obtained.11,13,25 Therefore, it is theoretically feasible and interesting to prepare a three-dimensional hierarchical WO3 structure material by means of metal cation induction.
Satisfyingly, after optimizing the experimental conditions, we successfully prepared a Cu-WO3 hierarchical structure by the Cu2+ cation induced method, which was composed of nanowire arrays on nanoflower flakes (NANFs). The morphology, structure, surface chemical state and formation mechanism were carefully studied. The obtained sample showed outstanding catalytic performance for the thermal decomposition of AP. The reaction kinetics and distribution of gaseous products of AP decomposition were also systematically investigated, and a possible decomposition mechanism of AP was finally proposed.
2. Experimental
2.1 Materials
Sodium tungstate (Na2WO4·2H2O, 99.5%) and copper acetate (Cu(CH3COO)2·H2O, 99.0%) were obtained from Tianjin Fuchen Chemical Reagent Factory. Ammonium perchlorate (AP, 99.0%), hydrochloric acid (HCl, 36.0–38.0%) and anhydrous ethanol (CH3CH2OH, 99.7%) were obtained from Sinopharm Chemical Reagent Co. Ltd. All the above chemical reagents were used without further purification. Distilled water was used throughout the experiment.2.2 Synthesis
Typically, Na2WO4·2H2O (3.0 mmol) and Cu(CH3COO)2·H2O (0.3 mmol) were dissolved in 30 mL of distilled water and treated with ultrasound for 15 minutes. The precursor solution appeared clear light blue. Then, the pH of the solution was adjusted to 2.0 by dropping 3.0 M HCl aqueous solution under stirring. After that, the solution was transferred into a 150 mL Teflon-lined autoclave, and then sealed and maintained at 180 °C for an hour. After the reaction, the autoclave was naturally cooled to room temperature. The obtained precipitate was separated by centrifugation, and washed with distilled water and ethanol several times, respectively. The product was dried in a vacuum drying oven at 60 °C and then calcined in a muffle furnace at 300 °C for 2 h. The synthesized sample was denoted as Cu-WO3 NANF. By comparison, the pure WO3 nanorod array in a saucer-shape was prepared and denoted as WO3 NASS, which had the same operational steps except for the addition of Cu(CH3COO)2·H2O to the precursor solution.2.3 Characterization
The crystal phase of the product was determined by X-ray powder diffraction (XRD, AXS D8 advance diffractometer) using Cu-Kα radiation in the 2θ range of 10–70°. The morphology, elemental distribution and fine crystal structure of the sample were determined by scanning electron microscopy (SEM, JSM-7001F), X-ray energy dispersive spectroscopy (EDS, X-Flash 5010) and transmission electron microscopy (TEM, JEM-2100F), respectively. X-ray photoelectron spectroscopy (XPS, Kratos Axis Ultra DLD, Al-Kα radiation) was used to determine surface elemental distribution. The specific surface area was calculated using the Brunauer–Emmett–Teller method (BET, Micromeritics ASAP 2000). The diffuse reflectance UV-Vis absorption spectrum was recorded on a Shimadzu UV-3150 spectrophotometer. The surface acidic properties of the catalysts were characterized using a Fourier transform pyridine infrared adsorption spectrometer (Py-IR, Bruker Tensor 27). An electron paramagnetic resonance spectrometer (EPR, Bruker EMXPLUS 10/12) was used to monitor the existence of oxygen vacancies at room temperature.2.4 Decomposition of AP
To evaluate the catalytic performance of the sample in the thermal decomposition of AP, the Cu-WO3 NANF and WO3 NASS were homogeneously mixed with AP in an agate mortar containing 5 mL of ethanol with a mass ratio of 1: 49, respectively. The mixture was separately ground and then dried at 80 °C for 6 h. Pure AP and the two mixtures were analyzed using a thermogravimetric and differential scanning calorimeter (TG-DSC, Setaram's SETSYS Evolution 16/18). The TG analysis combined with mass spectra (TG-MS) coupling technology was performed on a Perkin Pfeiffer OMNI star mass spectrometer. For each procedure, a sample mass of 10 mg in a platinum sample cup was heated from 25 °C to 600 °C at a heating rate of 10 °C min−1 under an Ar atmosphere.3. Results and discussion
3.1 Morphological and structural characterization
The morphology of the Cu-WO3 NANF was first detected by SEM. The low magnification image (Fig. 1a) shows that the flake crosses each other to form a flower. A partial enlargement image is shown in Fig. 1b, and we observed that a nanowire array of about 20 nm diameter is vertically anchored on the two sides of the nanoflower flake. The thickness of the flake was 100 nm and the length of the nanowire array varied greatly. The closer to the edge of the flake, the shorter the length of the array becomes. The longest array was up to 800 nm. To get information about the content and distribution of the Cu element on the Cu-WO3 NANF, selected area analysis and elemental mapping by SEM-EDS were performed, and the results are presented in Fig. S1.† O, W and Cu elements were observed in the EDS spectrum, and the mass percentage of the doped Cu element was 3.8%. Also, these three elements uniformly distribute on the surface of the Cu-WO3 NANF without obvious agglomeration (Fig. S1c–e†). For comparison, the morphology of the sample obtained without the addition of Cu2+ cation is shown in Fig. S2.† The particle exhibits a saucer-shaped structure (Fig. S2a†), which is wide in the middle and narrow at both ends. It was seen from the side of the high magnification SEM image (Fig. S2b†) that the two sides are exactly symmetrical with the centerline as the axis, and the saucer is self-assembled from nanorod arrays of different lengths with a diameter of 50 nm. Therefore, the introduction of the Cu2+ cation does prevent the growth of nanorods in a diameter direction, thus realizing the synthesis of the three-dimensional Cu-WO3 hierarchical structure of the nanowire array growing on the nanoflower flake. | ||
| Fig. 1 (a) Low magnification, (b) high magnification SEM images and (c) XRD pattern of the Cu-WO3 NANF. | ||
XRD analysis (Fig. 1c) was carried out to identify the crystal structure of the Cu-WO3 NANF. All peaks were indexed to hexagonal WO3 (h-WO3, JCPDS 33-1387), but only several (100) and (001) peaks and their double diffraction peaks are shown. Compared with the XRD pattern of the WO3 NASS (Fig. S2c†), the crystallinity of the Cu-WO3 NANF is significantly reduced. In addition, there is no peak corresponding to Cu or Cu compounds (Fig. S3†), which can be attributed to the high dispersion, low crystallinity or small particle size of the Cu species in the sample. It is noticeable that the (001) peak is stronger than the standard data. The intensity ratio of the (001) peak to the (200) peak was about 2.87, which should be 0.5 in the standard data. We presume the reason is that the material grows preferentially along the [001] direction, coming from the contribution of the growth characteristics of nanowires.
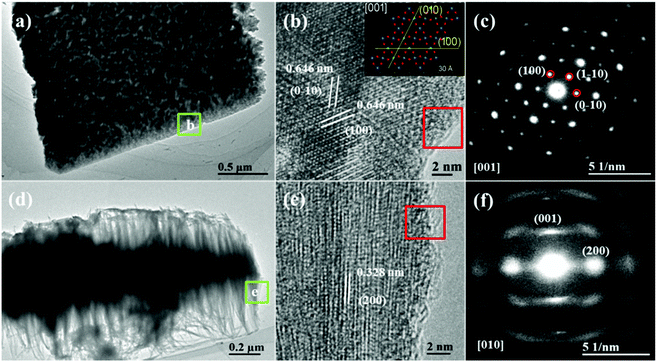
TEM and HRTEM analyses were carried out on the Cu-WO3 NANF sample. Because the hierarchical structure was too compact, ultrasound was performed for 5 minutes before TEM characterization. A fraction of the nanoflower flake with the nanowire array was dropped from the sample. Fig. 2a shows the top view image from which we found that the density of the nanowire array is low at the edge of the flake. HRTEM analysis was used to analyze the marginal area (Fig. 2b), and the two interplanar distances were both 0.646 nm with an angle of 60°. This result is highly consistent with the crystal structure of the (001) plane (inset of Fig. 2b). Under the incident electron along the [001] direction, the selected area electron diffraction (SAED) pattern (Fig. 2c) shows (0–10), (1–10), and (100) planes and/or their equivalent planes, and the sharp diffraction spots reveal that the sample is well single crystalline. Fig. 2d shows the side view of a single flake in the Cu-WO3 NANF. The nanowire array is almost uniformly distributed on either side of the flake, and the shortest array is located at the very edge. According to the HRTEM image in Fig. 2e, the fringe spacing was 0.328 nm, which matches the (200) plane. The SAED pattern (Fig. 2f) is attributed to the (001) and (200) planes and/or their equivalent planes under the incident electron along the [010] direction. On the basis of the above HRTEM and SAED analyses, we conclude that the growth direction of the array in the Cu-WO3 NANF is [001]. This result is consistent with the XRD data, in which the (001) peak is very strong, demonstrating that the speculation about the preferential growth along [001] is right. Similar TEM, HRTEM and SAED data of the WO3 NASS are shown in Fig. S4,† and the difference is that its array is made up of nanorods. The N2 adsorption–desorption isotherm was used to demonstrate the advantage of the NANF hierarchical structure, as shown in Fig. S5.† The isotherms of both samples are similar to each other and exhibit the type III characteristics of an H3 hysteresis loop in the relative pressure range of 0.3–1.0. The calculated specific surface area of the Cu-WO3 NANF reached up to 60.4 m2 g−1, which is much higher than that of the WO3 NASS (12.7 m2 g−1).
3.2 Growth mechanism study
We understood the detailed structure and morphology information of the Cu-WO3 NANF material. But why do particles grow in this way? To gain more information about the growth process, time dependent experiments were carried out in both systems with and without the Cu2+ cation. Regardless of the presence or absence of the Cu2+ cation, there was no product when the reaction time is less than 25 min. When the reaction time is 30 min, the morphology of both samples was irregular flakes with different sizes. In the system without the Cu2+ cation, the size of the original flake was larger (Fig. 3a). With the reaction time increasing to 40 min, the flake crossed each other and became thicker. A lot of short nanorods were found on the surface of the flake (Fig. 3b). After growth for another 10 min, the nanorods became thicker and longer, but the flake became thinner (Fig. 3c). After the 60 min reaction, the product grew into an independent saucer composed of nanorod arrays, and the middle flake became faintly visible (Fig. S2b†). When the Cu2+ cation was added to the system, there were only a few flakes in the product after the reaction for 30 min (Fig. 3d). Increasing the time to 40 min and 50 min, the morphology of the product gradually changed from a smooth intersecting flake to an intersecting flake with many short nanowires on the surface (Fig. 3e and f). After another 10 min, the nanowires on the flake grew longer and thinner, and finally, the Cu-WO3 NANF was formed (Fig. 1a). It can be seen that the Cu2+ cation not only restricts the lateral growth of the nanorod but also prevents the growth of the nanoflake at the initial stage, making it thinner and smaller in diameter.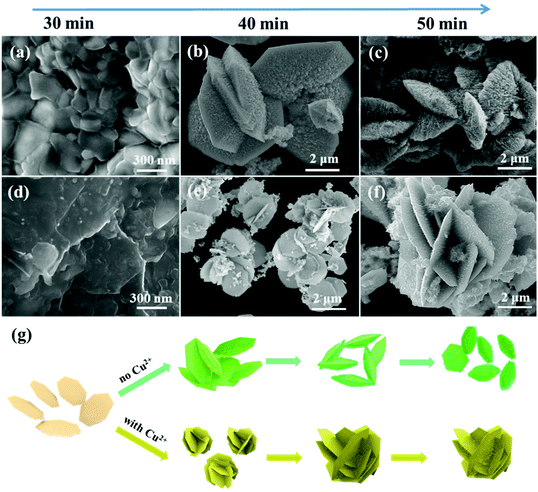 | ||
| Fig. 3 SEM images of the (a–c) WO3 NASS and (d–f) Cu-WO3 NANF at different reaction times, (g) illustration of the formation process of the WO3 NASS and Cu-WO3 NANF. | ||
Fig. 3g shows the illustration of the formation process. As seen from the time dependent experiments, the growth process of the WO3 NASS and Cu-WO3 NANF is quite similar. It mainly goes through three stages: the formation of the flake structure, the oriented growth of the nanorod (or the nanowire) array along the [001] direction, and an Ostwald ripening process between different facets. The first step is the formation of the flake structure exposed (001) facet. This is because both the two samples have hexagonal crystal structures (Fig. 1c and Fig. S2c†), which usually possess total oxide terminated (001) polar facets (Fig. S6†).26–28 Because the isoelectric point (IEP) of WO3 in water is smaller than 1.5, and the pH of the reaction system is 2.0, the (001) facet would concentrate much more negative charges in comparison with other facets.29–32 Therefore, a lot of WO3 nuclei with negatively charged (001) polar facets appear and get together quickly to reduce their high surface energy after the nucleation process. Under the electrostatic repulsion effect, these nuclei would mainly get together by the combination of other nonpolar facets, and the initial flake structure is formed. At the same time, the flake crosses each other, further reducing the energy of the whole system. According to the literature, polar facets diminish easily along the crystal growth direction as a result of surface energy minimization.26,33,34 This means that polar facets possess a higher growth speed than non-polar facets, that is to say, the growth along the [001] direction would be faster. The exposed (001) facet on the flake is divided into many small areas by adsorbed cations (such as Na+ and H+), and thus the nanorod array is formed with the aggregation of WO3 particles oriented in the [001] direction. Due to the steric hindrance of the intersecting flake, the edges of the flake have more chances of coming in contact with cations than the middle position. This restricts the growth of the nanorod at the edge and makes it shorter. Because of the limited space, the intersecting flake with the nanorod array falls off and grows into an independent saucer. The high valence Cu2+ cation existing in solution will also attach to the (001) polar facet, but it is more likely to adsorb on some equatorial oxygens of h-WO3 and terminate the growth of the non-(001) crystal plane, according to our group's previous research.11,13,25 Under the co-action of the three kinds of cation (Cu2+, H+ and Na+), the intersecting flake structure remains unchanged, but the nanorod array that grows on the flake becomes the nanowire array with a small diameter. As the nanowire array gets longer, the size of the underlying flake becomes smaller. This is because growth and decomposition is a dynamic equilibrium process. On (001) facets, growth obviously dominates the equilibrium and they would acquire more tungsten sources from the reaction solution. To maintain the balance of the concentration of the solution, decomposition would dominate the equilibrium on those slower growth facets. Actually, we can understand it as the Ostwald ripening process between different facets.
3.3 Thermal decomposition performance tests
To study the catalytic performance of Cu-WO3 NANF and WO3 NASS catalysts for AP decomposition, DSC and TG tests were conducted. As shown in Fig. 4a, pure AP decomposition can be divided into three stages: firstly, an endothermic peak at 250.2 °C is the phase transition of AP; then a weak exothermic peak at 317.3 °C is attributed to the partial decomposition of AP at the low temperature decomposition (LTD) stage; and finally, a main exothermic peak corresponding to the high temperature decomposition (HTD) stage appears at 449.3 °C. Seen from DSC curves, heterophase additives have little effect on phase transition and the LTD temperature. However, the HTD temperature obviously decreases. With the addition of the catalyst, the HTD peak decreases from 449.3 °C to 435.9 °C (WO3 NASS) and 378.3 °C (Cu-WO3 NANF), respectively. In addition, Fig. 4a shows that AP decomposition can release much more heat in the presence of a catalyst. The overall heat releases (ΔH) were determined to be 462, 808 and 1118 J g−1 for pure AP, and AP with WO3 NASS and Cu-WO3 NANF samples, respectively. The TG curves (Fig. 4b) indicate that the addition of the Cu-WO3 NANF decreases the ending mass loss temperature by more than 70 °C compared to that of pure AP (450.1 °C), which was 11.6 °C for the WO3 NASS.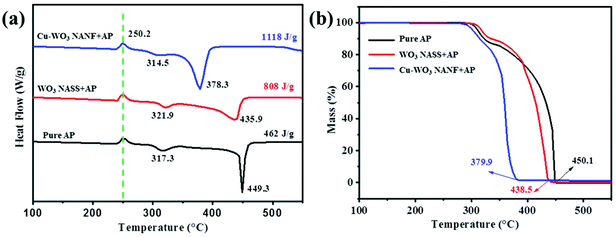 | ||
| Fig. 4 (a) DSC and (b) TG curves for AP decomposition in the absence or presence of the Cu-WO3 NANF and WO3 NASS. | ||
The catalytic decomposition reaction kinetics of pure AP and AP with the catalyst was performed by DSC tests at different heating rates (5, 10, 15 and 20 °C min−1), as shown in Fig. S7.† It can be seen that there is almost no change in the endothermic peak (250.2 °C), but the positions of exothermic peaks change noticeably, especially for the HTD peak. With the decrease of the heating rate, the temperature of HTD drops more sharply, as shown in Table 1. The activation energy was figured out according to the Kissinger formula:
| Samples | T p (°C) | E a (kJ mol−1) | |||
|---|---|---|---|---|---|
| 5 °C min−1 | 10 °C min−1 | 15 °C min−1 | 20 °C min−1 | ||
| Pure AP | 437.67 | 449.29 | 451.86 | 454.56 | 265.03 |
| WO3 NASS + AP | 424.12 | 435.94 | 444.16 | 446.89 | 226.69 |
| Cu-WO3 NANF + AP | 369.48 | 378.31 | 392.28 | 396.72 | 147.01 |
To find the reason for the low activation energy, diffuse reflectance UV-Vis spectra were recorded for the two samples, as shown in Fig. 5. Both the WO3 NASS and Cu-WO3 NANF have absorption in the wavelength range of ultraviolet and visible light. Compared with the WO3 NASS, the light absorption of the Cu-WO3 NANF shows a red shift, and an obvious absorption tail is present in the visible and near infrared regions. According to the literature,20,35,36 this could be attributed to the existence of lots of oxygen vacancies. The energy band gap (Eg) is an important characteristic of semiconductor materials, and the Tauc plot (F(R∞)hν)mversus incident photon energy (hν) was applied to calculate Eg.13 The band gap Eg values were calculated to be 2.46 eV (Cu-WO3 NANF) and 2.75 eV (WO3 NASS), respectively. From this, we speculate that the Cu2+ cation may enter the WO3 lattice during preparation to form effective doping, resulting in more oxygen vacancies, smaller band gaps and easier transition of charge carriers.
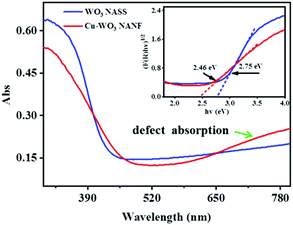 | ||
| Fig. 5 Diffuse reflectance UV-Vis absorption spectra of the WO3 NASS and Cu-WO3 NANF, and the inset is their corresponding band gap data. | ||
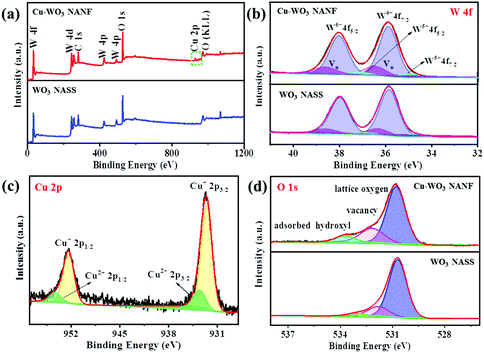
XPS analysis was performed to characterize the surface composition and chemical state. The XPS full spectrum of the Cu-WO3 NANF is shown in Fig. 6a, showing the presence of W, O and Cu elements. The W 4f peaks of these two samples could be both fitted by using three doublets (Fig. 6b). In the WO3 NASS sample, the first doublet centered at 35.84 eV and 37.98 eV is assigned to W atoms with an oxidation state of +6 (WO3). The second doublet centered at 34.67 eV and 36.91 eV can be attributed to the W atoms near the oxygen vacancies (i.e. sub-stoichiometric WO3−x). While the third doublet centered at 36.36 eV and 38.56 eV was reported to be associated with local variations in the vacuum-level energy caused by a surface oxygen vacancy (denoted as VO).37,38 In the Cu-WO3 NANF sample, the positions of three doublets move to higher binding energies, which were 35.88, 38.04, 34.93, 37.13, 36.47 and 38.62 eV, respectively. This is due to the interaction between WO3 and Cu, and the electrons migrate from WO3 to Cu species, resulting in a decrease of the electron cloud density. Calculated from the peak area, the percentage of the oxygen vacancy was 16.8% on the Cu-WO3 NANF, which is higher than that of the WO3 NASS (6.7%). Fig. 6c shows the result of the Cu 2p dividing peak, in which 932.58 eV and 952.44 eV are attributed to Cu+, while 933.56 eV and 954.35 eV are allocated to Cu2+.39 It can be seen from the peak area that Cu mainly exists as Cu+. Because there is no information about Cu in XRD and HRTEM, it is difficult to determine the existing form of the Cu species. Combined with the results of EDS and XPS, it may be speculated that Cu2+ is mainly adsorbed on the WO3 surface and reduced to amorphous Cu+ species by sub-stoichiometric WO3−x while restricting the growth of WO3.20 In addition, some Cu2+ or Cu+ might go into the WO3 lattice in the manner of surface doping, realizing the substitution of the W atom lattice. It increases the oxygen vacancy on the surface, and the impurity level is observed in the WO3 band gap. Thus the Cu-WO3 NANF can be excited at a lower heat to produce reactive active species: holes (h+) and electrons (e−). In Fig. 6d, the O 1s of the WO3 NASS can be deconvoluted into three component peaks: 530.71, 531.84 and 533.10 eV, corresponding to the lattice oxygen, oxygen vacancy and surface adsorbed hydroxyl species, respectively.11,40 Also, all the peaks shift to higher binding energies in the Cu-WO3 NANF (530.81, 531.93 and 533.45 eV). This is due to the fact that Cu2+ cations can attract electrons from oxygen, leading to a decrease in the electron cloud density and generating a high valence state of oxygen in the Cu-WO3 NANF. According to the peak area estimation, we found that more oxygen vacancies and surface hydroxyl species are present on the surface of the Cu-WO3 NANF.
An EPR spectrometer was employed to further determine the defective structure, as shown in Fig. S9.† There was a faint EPR signal (g = 2.002) for the WO3 NASS, while two remarkable symmetrical signals at a g values of 2.002 and 2.170 were detected for the Cu-WO3 NANF. They correspond to free-electron-trapped oxygen vacancies and Cu2+ ions in the structure,41,42 respectively. The result further proves that the oxygen vacancy concentration increases significantly in the Cu-WO3 NANF due to the introduction of the Cu species.
3.4 Decomposition mechanism study
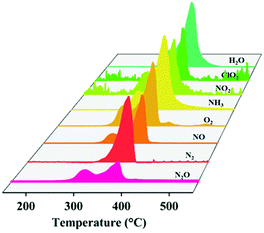
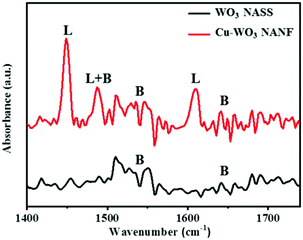
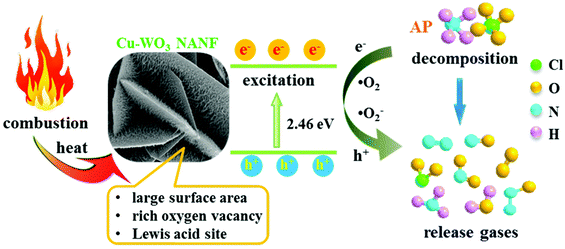
To understand the catalytic decomposition mechanism, the TG-MS coupling technology was adopted to analyze the decomposition products of AP. In the presence of the Cu-WO3 NANF, a mixture of gaseous products was detected (Fig. 7), including N2O, N2, NO, O2, NH3, NO2, ClO2 and H2O, which is consistent with the previous reports.10,43 These products are released dramatically in the temperature range of 280–380 °C. For pure AP, the decomposition is mainly concentrated at 290–450 °C (Fig. S10†). In addition, while the release of NO decreases, an obvious peak of N2 appears (Fig. S11†). The formation of N2 is due to the deep dissociation of NH3. The Lewis acid sites of the catalyst surface can act as acceptors to accept the isolated electrons from N atoms, promoting the adsorption and deep oxidation of NH3.6,44 The surface acidity of the catalyst was determined by Py-IR, as shown in Fig. 8. It can be seen that the introduction of Cu2+ has a great effect on the shape of the adsorption peak. There is a weak signal of pyridine adsorption on the WO3 NASS, which may be due to the small specific surface area. The Cu-WO3 NANF has several strong adsorption peaks. Generally, the adsorption peaks at 1540 cm−1 and 1448 cm−1 are considered as fingerprints, characterizing for Brønsted and Lewis acid sites, respectively.11 Obviously, the Lewis acid sites occupy the main position on the surface of the Cu-WO3 NANF, which is different from the acidic property of the WO3 NASS based on Brønsted acid sites.45 Combined with the structural features of the sample, we consider that some Cu+ sites and oxygen vacancies may be the main source of Lewis acid sites on the Cu-WO3 NANF.Fig. 9 shows the schematic diagram of the AP decomposition process in the presence of the Cu-WO3 NANF catalyst. The Cu-WO3 NANF with a large specific surface area and rich oxygen vacancies is excited to produce charge carriers (e− and h+) at a lower heating temperature because of its narrow band gap.21 Generally, AP decomposes into NH3 and HClO4 at a low temperature. The resulting HClO4 reacts with e− to form ClO2 and superoxide radicals (˙O2− and ˙O2).9,21 Under the action of the surface Lewis acid, the active species (h+, ˙O2− and ˙O2) rapidly oxidized NH3 to N2O, NO2, H2O and N2 with less NO release in a short time. The faster the AP decomposes to produce gases, the higher the combustion temperature, which is more favorable for the further oxidation of fuels in a propellant combustion system.
4. Conclusions
In this work, a Cu-WO3 NANF hierarchical structure was successfully prepared by a rapid hydrothermal approach. We investigated the effect of Cu2+ cation introduction on the morphology, surface properties and growth process of WO3. The growth mechanism was put forward based on time comparison experiments. Modified by the Cu species (Cu+ and Cu2+), the Cu-WO3 NANF had a large specific surface area of 60.4 m2 g−1, a low band gap energy of 2.46 eV, rich oxygen vacancies and Lewis acid sites. In the synergy of multiple factors, the thermal decomposition of AP was promoted. The Cu-WO3 NANF decreased the ending mass loss temperature by more than 70 °C and increased the heat release by 656 J g−1. The excellent activity of the Cu-WO3 NANF on the thermal decomposition of AP suggested its potential application as a high performing combustion catalyst.Conflicts of interest
There are no conflicts to declare.Acknowledgements
This work was supported by the National Natural Science Foundation of China (No. 21972158), the Fundamental Research Program of Shanxi Province (201901D211583 and 20210302124625) and the Doctoral Start-up Foundation of Shanxi Province (SQ2019006).Notes and references
- B. C. Terry, T. R. Sippel, M. A. Pfeil, I. E. Gunduz and S. F. Son, Removing hydrochloric acid exhaust products from high performance solid rocket propellant using aluminum-lithium alloy, J. Hazard. Mater., 2016, 317, 259–266 CrossRef CAS PubMed.
- S. G. Hosseini, S. Gholami and M. Mahyari, Highly dispersed Ni-Mn bimetallic nanoparticles embedded in 3D nitrogen-doped graphene as an efficient catalyst for the thermal decomposition of ammonium perchlorate, New J. Chem., 2018, 42, 5889–5899 RSC.
- W. D. Zhou, L. Wang, H. J. Yu and X. Xia, Synthesis of ferrocene-modified poly(glycidyl methacrylate) and its burning rate catalytic property, Appl. Organomet. Chem., 2018, 32, e3932 CrossRef.
- J. Shi, H. X. Wang, Y. Q. Liu, X. B. Ren, H. Z. Sun and B. L. Lv, Rapid microwave-assisted hydrothermal synthesis of CeO2 octahedra with mixed valence states and their catalytic activity for thermal decomposition of ammonium perchlorate, Inorg. Chem. Front., 2019, 6, 1735–1743 RSC.
- H. Zhou, B. L. Lv, D. Wu and Y. Xu, Synthesis and properties of octahedral Co3O4 single-crystalline nanoparticles enclosed by (111) facets, CrystEngComm, 2013, 15, 8337–8344 RSC.
- L. Y. Zhou, S. B. Cao, L. L. Zhang, G. L. Xiang, J. X. Wang, X. F. Zeng and J. F. Chen, Facet effect of Co3O4 nanocatalysts on the catalytic decomposition of ammonium perchlorate, J. Hazard. Mater., 2020, 392, 122358 CrossRef CAS PubMed.
- T. Zhang, Y. Guo, C. C. Li, Y. Y. Li, J. C. Li, F. Q. Zhao and H. X. Ma, The effect of LaFeO3@MnO2 on the thermal behavior of energetic compounds: An efficient catalyst with core-shell structure, Adv. Powder Technol., 2020, 31, 4510–4516 CrossRef CAS.
- J. X. Wang, W. C. Zhang, Z. L. Zheng, Y. Gao, K. F. Ma, J. H. Ye and Y. Yang, Enhanced thermal decomposition properties of ammonium perchlorate through addition of 3DOM core-shell Fe2O3/Co3O4 composite, J. Alloys Compd., 2017, 724, 720–727 CrossRef CAS.
- Y. H. Hu, Y. L. Yang, R. Q. Fan, K. F. Lin, D. Y. Hao, D. B. Xia and P. Wang, Enhanced thermal decomposition properties and catalytic mechanism of ammonium perchlorate over CuO/MoS2 composite, Appl. Organomet. Chem., 2019, 33, e5060 CrossRef.
- G. Tang, Y. W. Wen, A. M. Pang, D. W. Zeng, Y. G. Zhang, S. Q. Tian, B. Shan and C. S. Xie, The atomic origin of high catalytic activity of ZnO nanotetrapods for decomposition of ammonium perchlorate, CrystEngComm, 2014, 16, 570–574 RSC.
- H. X. Wang, M. X. Tang, F. L. Shi, R. M. Ding, L. C. Wang, J. B. Wu, X. K. Li, Z. Liu and B. L. Lv, Amorphous Cr2WO6-modified WO3 nanowires with a large specific surface area and rich Lewis acid sites: A highly efficient catalyst for oxidative desulfurization, ACS Appl. Mater. Interfaces, 2020, 12, 38140–38152 CrossRef CAS PubMed.
- H. X. Wang, X. B. Ren, Z. Liu, D. Jiang and B. L. Lv, Bubble-template synthesis of WO3·0.5H2O hollow spheres as a high-activity catalyst for catalytic oxidation of benzyl alcohol to benzaldehyde, CrystEngComm, 2019, 21, 1026–1033 RSC.
- H. X. Wang, C. H. Wang, X. M. Cui, L. Qin, R. M. Ding, L. C. Wang, Z. Liu, Z. F. Zheng and B. L. Lv, Design and facile one-step synthesis of FeWO4/Fe2O3 di-modified WO3 with super high photocatalytic activity toward degradation of quasi-phenothiazine dyes, Appl. Catal., B, 2018, 221, 169–178 CrossRef CAS.
- Y. L. Ling and Y. Z. Dai, Direct Z-scheme hierarchical WO3/BiOBr with enhanced photocatalytic degradation performance under visible light, Appl. Surf. Sci., 2020, 509, 145201 CrossRef CAS.
- F. Zheng, J. Wang, W. B. Liu, J. M. Zhou, H. Li, Y. Yu, P. F. Hu, W. Yan, Y. Liu and R. Li, Novel diverse-structured h-WO3 nanoflake arrays as electrode materials for high performance supercapacitors, Electrochim. Acta, 2020, 334, 135641 CrossRef CAS.
- A. V. Salkar, A. P. Naik, S. V. Bhosale and P. P. Morajkar, Designing a rare DNA-like double helical microfiber superstructure via self-assembly of in situ carbon fiber-encapsulated WO3−x nanorods as an advanced supercapacitor material, ACS Appl. Mater. Interfaces, 2021, 13, 1288–1300 CrossRef CAS PubMed.
- J. X. Diao, W. Y. Yuan, Y. Qiu, L. F. Cheng and X. H. Guo, A hierarchical oxygen vacancy-rich WO3 with “nanowire-array-on-nanosheet-array” structure for highly efficient oxygen evolution reaction, J. Mater. Chem. A, 2019, 7, 6730–6739 RSC.
- Y. L. Wang, T. An, N. Yan, Z. F. Yan, B. D. Zhao and F. Q. Zhao, Nanochromates MCr2O4 (M = Co, Ni, Cu, Zn): Preparation, characterization and catalytic activity on the thermal decomposition of fine AP and CL-20, ACS Omega, 2020, 5, 327–333 CrossRef CAS PubMed.
- J. F. Al-Sharab, R. K. Sadangi, V. Shukla, S. D. Tse and B. H. Kear, Synthesis of nanostructured tungsten oxide (WO2.9) fibers and discs, Cryst. Growth Des., 2009, 9, 4680–4684 CrossRef CAS.
- G. C. Xi, J. H. Ye, Q. Ma, N. Su, H. Bai and C. Wang, In situ growth of metal particles on 3D urchin-like WO3 nanostructures, J. Am. Chem. Soc., 2012, 134, 6508–6511 CrossRef CAS PubMed.
- J. H. Xu, S. Y. Li, L. H. Tan and B. Kou, Enhanced catalytic activity of mesoporous graphitic carbon nitride on thermal decomposition of ammonium perchlorate via copper oxide modification, Mater. Res. Bull., 2017, 93, 352–360 CrossRef CAS.
- S. Zhang, S. F. Wu, J. M. Wang, J. P. Jin and T. Y. Peng, Controllable syntheses of hierarchical WO3 films consisting of orientation-ordered nanorod bundles and their photocatalytic properties, Cryst. Growth Des., 2018, 18, 794–801 CrossRef CAS.
- L. Chen, S. W. Lam, Q. H. Zeng, R. Amal and A. B. Yu, Effect of cation intercalation on the growth of hexagonal WO3 nanorods, J. Phys. Chem. C, 2012, 116, 11722–11727 CrossRef CAS.
- J. Z. Jia, X. C. Liu, R. Mi, N. Liu, Z. W. Xiong, L. Yuan, C. Y. Wang, G. M. Sheng, L. H. Cao, X. W. Zhou and X. D. Liu, Self-assembled pancake-like hexagonal tungsten oxide with ordered mesopores for supercapacitors, J. Mater. Chem. A, 2018, 6, 15330–15339 RSC.
- H. X. Wang, R. M. Ding, C. H. Wang, X. B. Ren, L. C. Wang and B. L. Lv, Iron cation-induced biphase symbiosis of h-WO3/o-WO3·0.33H2O and their crystal phase transition, CrystEngComm, 2017, 19, 3979–3985 RSC.
- X. J. Zhang, A. X. Gu, G. F. Wang, B. Fang, Q. Y. Yan, J. X. Zhu, T. Sun, J. Ma and H. H. Hng, Enhanced electrochemical catalytic activity of new nickel hydroxide nanostructures with (100) facet, CrystEngComm, 2011, 13, 188–192 RSC.
- B. L. Lv, Z. Liu, R. M. Ding, D. Wu and Y. Xu, Fast production of β-Ni(OH)2 nanostructures with (001) and (100) plane exposure and their electrochemical properties, J. Mater. Chem. A, 2013, 1, 5695–5699 RSC.
- M. L. Huang, Y. Yan, W. H. Feng, S. X. Weng, Z. Y. Zheng, X. Z. Fu and P. Liu, Controllable tuning various ratios of ZnO polar facets by crystal seed-assisted growth and their photocatalytic activity, Cryst. Growth Des., 2014, 14, 2179–2186 CrossRef CAS.
- Y. Y. Petrov, S. Y. Avvakumova, M. P. Sidorova, L. E. Ermakova and O. M. Merkushev, Electrosurface properties of tungsten(VI) oxide in electrolyte solutions, Colloid J., 2010, 72, 663–668 CrossRef CAS.
- A. Koliadima, L. A. Pérez-Maqueda and E. Matijević, Monodispersed colloidal salts of tungstosilicic acid, Langmuir, 1997, 13, 3733–3736 CrossRef CAS.
- M. Anik and T. Cansizoglu, Dissolution kinetics of WO3 in acidic solutions, J. Appl. Electrochem., 2006, 36, 603–608 CrossRef CAS.
- G. M. Veith, A. R. Lupini, S. J. Pennycook, A. Villa, L. Prati and N. J. Dudney, Magnetron sputtering of gold nanoparticles onto WO3 and activated carbon, Catal. Today, 2007, 122, 248–253 CrossRef CAS.
- H. G. Yang, C. H. Sun, S. Z. Qiao, J. Zou, G. Liu, S. C. Smith, H. M. Cheng and G. Q. Lu, Anatase TiO2 single crystals with a large percentage of reactive facets, Nature, 2008, 453, 638–641 CrossRef CAS PubMed.
- X. W. Xie, Y. Li, Z. Q. Liu, M. Haruta and W. J. Shen, Low-temperature oxidation of CO catalysed by Co3O4 nanorods, Nature, 2009, 458, 746–749 CrossRef CAS PubMed.
- D. B. Migas, V. L. Shaposhnikov, V. N. Rodin and V. E. Borisenko, Tungsten oxides. I. Effects of oxygen vacancies and doping on electronic and optical properties of different phases of WO3, J. Appl. Phys., 2010, 108, 093713 CrossRef.
- J. P. Wang, Z. Y. Wang, B. B. Huang, Y. D. Ma, Y. Y. Liu, X. Y. Qin, X. Y. Zhang and Y. Dai, Oxygen vacancy induced band-gap narrowing and enhanced visible light photocatalytic activity of ZnO, ACS Appl. Mater. Interfaces, 2012, 4, 4024–4030 CrossRef CAS.
- A. P. Shpak, A. M. Korduban, M. M. Medvedskij and V. O. Kandyba, XPS studies of active elements surface of gas sensors based on WO3−x nanoparticles, J. Electron Spectrosc. Relat. Phenom., 2007, 156, 172–175 CrossRef.
- C. Navío, S. Vallejos, T. Stoycheva, E. Llobet, X. Correig, R. Snyders, C. Blackman, P. Umek, X. X. Ke, G. V. Tendeloo and C. Bittencourt, Gold clusters on WO3 nanoneedles grown via AACVD: XPS and TEM studies, Mater. Chem. Phys., 2012, 134, 809–813 CrossRef.
- P. Mao, L. Y. Qi, X. D. Liu, Y. Liu, Y. Jiao, S. W. Chen and Y. Yang, Synthesis of Cu/Cu2O hydrides for enhanced removal of iodide from water, J. Hazard. Mater., 2017, 328, 21–28 CrossRef CAS.
- B. B. Zhang, L. Wang, Y. J. Zhang, Y. Ding and Y. P. Bi, Ultrathin FeOOH nanolayers with abundant oxygen vacancies on BiVO4 Photoanodes for efficient water oxidation, Angew. Chem., Int. Ed., 2018, 57, 2248–2252 CrossRef CAS PubMed.
- M. Q. Shen, C. X. Li, J. Q. Wang, L. L. Xu, W. L. Wang and J. Wang, New insight into the promotion effect of Cu doped V2O5/WO3-TiO2 for low temperature NH3-SCR performance, RSC Adv., 2015, 5, 35155–35165 RSC.
- Y. T. Wang, J. M. Cai, M. Q. Wu, J. H. Chen, W. Y. Zhao, Y. Tian, T. Ding, J. Zhang, Z. Jiang and X. G. Li, Rational construction of oxygen vacancies onto tungsten trioxide to improve visible light photocatalytic water oxidation reaction, Appl. Catal., B, 2018, 239, 398–407 CrossRef CAS.
- Y. H. Hu, Y. L. Yang, K. F. Lin, D. Y. Hao, L. L. Qiu, D. K. Wang, R. Q. Fan and D. B. Xia, Ammonium perchlorate encapsulating nanothermites as high energetic composites: Preparation, thermal decomposition and combustion properties, Chem. Eng. Sci., 2019, 207, 334–343 CrossRef CAS.
- K. Shojaee, B. S. Haynes and A. Montoya, The catalytic oxidation of NH3 on Co3O4(110): A theoretical study, Proc. Combust. Inst., 2017, 36, 4365–4373 CrossRef CAS.
- G. Rodriguez-Gattorno, A. Galano and E. Torres-García, Surface acid-basic properties of WOx-ZrO2 and catalytic efficiency in oxidative desulfurization, Appl. Catal., B, 2009, 92, 1–8 CrossRef CAS.
Footnote |
| † Electronic supplementary information (ESI) available: The EDS spectrum and mapping of the Cu-WO3 NANF; the XRD pattern, and SEM, TEM and HRTEM images of the WO3 NASS; the atomic structure of the WO3 (001) crystal plane; N2 adsorption–desorption isotherms and EPR spectra of the Cu-WO3 NANF and WO3 NASS; DSC curves at different heating rates, kinetic equation lines, TG-MS curves and the comparison of N2 and NO release for different reaction systems. See DOI: 10.1039/d1qi01027a |
| This journal is © the Partner Organisations 2022 |

