 Open Access Article
Extraction of essential oil from Zingiber officinale and statistical optimization of process parameters
Haidar Hasan Mohammeda,
Waham Ashaier Laftah *b,
Akos Noel Ibrahimc and
Mohd Azizi Che Yunusd
aDepartment of Chemical Engineering and Petroleum Refining, College of Oil and Gas Engineering, Basra University for Oil and Gas, Basra 61004, Iraq
bDepartment of Polymers and Petrochemical Engineering, College of Oil and Gas Engineering, Basra University for Oil and Gas, Basra 61004, Iraq. E-mail: waham1980@yahoo.com.my
cDepartment of Science Laboratory Technology, School of Science Technology, The Federal Polytechnic, Kaura Namoda, Nigeria
dDepartment of Chemical Engineering, School of Chemical and Energy Engineering, Faculty of Engineering, Universiti Teknologi Malaysia, 81310 UTM Skudai, Johor, Malaysia
First published on 9th February 2022
Abstract
The main objective of this study is to investigate the effect of process extraction variables (extraction time, volume of solvent, weight of sample) on the production of essential oil from ginger rhizome using Response Surface Methodology (RSM). A gas chromatography-mass spectrometry (GC-MS) method was employed to obtain the essential oil concentration in percentage (%) area. The RSM indicated that the weight of the sample had a major linear effect on the oil recovery while the extraction time had a major quadratic effect on the essential oil concentration in % area. The highest oil recovery and essential oil concentration in % area were 15.2% and 22.64%, respectively. The best operation conditions for the oil recovery were 4 hours of extraction time, 750 mL volume of methanol and 30 g weight of sample. The best operation conditions for the essential oil concentration in % area were 5 hours of extraction time, 500 mL volume of methanol and 30 g weight of sample.
1. Introduction
Herbs and spices have been used for thousands of years to enhance the color, flavor and aroma of food. Besides boosting flavor, herbs and spices are also known for their preservative,1 anti-oxidative,2 antimicrobial,3 and various other medicinal uses.4 On the other hand, there is valuable interest in the production of functional, high value, natural products without chemical modification and residues of solvents or additives. Essential oils, which are natural volatile extracts of plant materials, hold high export potential since they are of great interest in the pharmaceutical and nutrition sectors. Plant essences and extracts that have developed into our modern essential oils were in regular use in Rome, Greece, Egypt and throughout the Middle and Far East for some centuries.5 The highest concentration of oils can be extracted using different extraction methods. Essential oils can be obtained from different types and parts of the plants. Flowers, fruits, herbs, stems, roots, leaves, buds, blossoms, seeds, nuts and even tree bark produce some of the most aromatic and therapeutic essential oils. Essential oils are aromatic substances that are widely used in the perfume industries, pharmaceutical sector, food and human nutrition field. They are mixtures of more than 200 compounds,6 that can be grouped basically into two fractions: a volatile fraction that constitutes 90 to 95% of the whole oil, hydrocarbons and their oxygenated derivatives along with aliphatic aldehydes, alcohols and esters and the non-volatile residue that constitutes 5 to 10% of the whole oil, hydrocarbons, fatty acids, sterols and waxes. Essential oils contrary to the use of the word “oil” are not really oily-feeling at all. Most essential oils are clear, but some oils such as patchouli, orange and lemon grass are amber or yellow in color. Essential oils contain the true essence of the plant it is derived from. They are not the same as perfume or fragrance oils because they are derived from the true plants. Perfume oils are industrially created fragrances or contain artificial substances and do not offer the therapeutic benefits that essential oils offer. Essential oils are commonly extracted by distillation or solvent extraction. They are used in perfumes, cosmetics, soap and other products. Also, for flavoring food, drink, scenting incense, and household cleaning products. Essential oils vary greatly in quality and price. Factors that can affect the quality and price of the oil includes rarity of the plant, country and conditions that the plant grew, quality standards of the distiller, and how much oil is produced by the plant. Essential oils can also be purchased as blends of several essential oils. The advantage, if it is a blend from pure essential oils is that you can save from having to buy every essential oil individually. However, the disadvantage is that you cannot mix the blends with other oils.Ginger is one of the oldest herbs known by humankind and it is one of the earliest spices to be known in the east. Ginger consists of thick scaly rhizomes of the plant Zingiber officinale; it belongs to the family Zingiberaceae. The plant is indigenous to warm tropical climates, particularly south eastern Asia. It is now widely transplanted in many countries like: India, China, Nigeria, Jamaica, Mexico and Hawaii. Indian ginger is characterized as an erect perennial growing plant from 1–3 ft in height.7 The ginger rhizomes are aromatic, thick lobed, branched and scaly structures with a spicy lemon-like scent. They contain both aromatic and pungent components. The essential oil and oleoresins extracted from ginger rhizomes are very valuable products responsible for the characteristic ginger flavor and pungency. Both the oil and oleoresins are used in many food items and medicinal substances.
The Soxhlet extraction technique is one method that is effective in the extraction of essential oils. The method is environmentally friendly, has low operating cost and all the parameters that are involved in the extraction process are easy to control. Response surface methodology (RSM) was used to optimize the extraction parameters. This assisted in determining the best operation conditions of extracting the essential oil from ginger.
The increasing importance of essential oils as pharmaceutical and aromatherapy aid besides their traditional role in cosmetics not only as potent ingredients but also as a fragrance donor has opened up wide opportunities for global marketing. Besides having medicinal properties, the ginger oil is used as an ingredient in aromatherapy candles, oils, lotion and in perfumes. The essential oil from ginger rhizome (Zingiber officinale) was successfully extracted using Soxhlet extraction. The process extraction variables such as extraction time, volume of solvent and weight of sample on essential oil recovery were optimized.
2. Methodology
2.1 Sample preparation
The sample of ginger used in this study was purchased from the local market in Skudai, Johor Bahru, Malaysia. The ginger was washed thoroughly with tap water after which it was dried in an oven at 30 °C for 5 days. The dried ginger was grinded to powder using a grinder and stored in a closed receptacle. 10 g of the powdered ginger sample was placed inside a thimble and inserted into the Soxhlet extractor. 250 mL of methanol was added to 10 g ginger sample and extraction of the oil was carried out for 3 hours. The procedure was repeated for 20 g and 30 g of the powdered sample using 500 mL and 750 mL of methanol for 4 hours and 5 hours respectively. The quantity of ginger sample used were based on the statistical design as specified in Box–Behnken standard design. The refluxing temperature was 65 °C. After extraction, the methanol was removed using rotary evaporator leaving the essential oil only. The essential oil was kept in a bottle for the gas chromatography-mass spectrometry (GC-MS) analysis.2.2 Percentage of essential oil
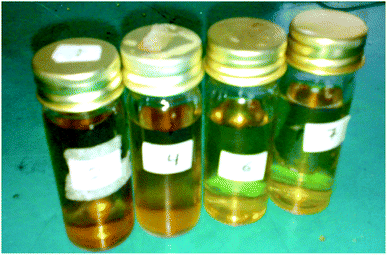
GC-MS was used to obtain the essential oil concentration in percentage area. Fig. 1 shows the homogenous mixture of the essential oil and methanol. The GC-MS equipped with a capillary column type HP-5MS 5% phenyl methyl siloxane (30 m × 0.25 mm i.d. × film thickness 0.25 μm) was used. The split ratio was 1![[thin space (1/6-em)]](https://www.rsc.org/images/entities/char_2009.gif) :
:![[thin space (1/6-em)]](https://www.rsc.org/images/entities/char_2009.gif) 100 and the injection volume was 1 μL. The oven temperatures were as follows: the initial temperature was 50 °C and held for 5 min. It was raised to 200 °C at rate of 10 °C min−1, then to 300 °C at the rate of 5 °C min−1 until 320 °C. The detector, ion source and quadruple temperatures were 250 °C, 230 °C and 150 °C respectively. Helium was used as the carrier gas with a flow rate of 2 mL min−1 and ionizing energy of 70 eV.
100 and the injection volume was 1 μL. The oven temperatures were as follows: the initial temperature was 50 °C and held for 5 min. It was raised to 200 °C at rate of 10 °C min−1, then to 300 °C at the rate of 5 °C min−1 until 320 °C. The detector, ion source and quadruple temperatures were 250 °C, 230 °C and 150 °C respectively. Helium was used as the carrier gas with a flow rate of 2 mL min−1 and ionizing energy of 70 eV.
The quantification of compounds of interest was measured in percentage area. The concentrations of essential oils in % area were identified by matching their mass ionization spectral with those in the WILEY database and the NIST (National Institute of Standards and Technologies) mass spectral libraries. The percentage of matching was assigned above 79%. The selection of 79% as the minimum matching similarity was due to the complex multi-components nature of the oil rather than pure components.
2.3 Statistical analysis
In this research, two responses which are weight of the extracted oil and the concentration of essential oil in percentage area were considered. The two responses and three independent variables were analyzed using RSM in order to determine the most dominant factor on the responses. Fifteen run of the extraction were required using Soxhlet extraction to cover all possible relation of variable levels as presented in Table 2. This help in determining the optimum condition of the parameters to produce the highest value of extracted oil. Table 1 shows the variables for each run. The second-order model shows the relationship between the dependent variables of extraction process which are the weight of oil recovery (Y1) and the percentage of recovery (Y2), with the independent variables, which are extraction time X1, volume of methanol X2, and weight of sample X3.| y = β0 + β1X1 + β2X2 + β11X112 + β22X222 + β12X1X2 + ε |
| Coded variables level (Zi) | Encoded variables level | ||
|---|---|---|---|
| Extraction time (h), X1 | Volume of methanol (mL), X2 | Weight of sample (g), X3 | |
| +1 | 5 | 750 | 30 |
| 0 | 4 | 500 | 20 |
| −1 | 3 | 250 | 10 |
| ΔXi | 1 | 250 | 10 |
3. Results and discussions
3.1 Produced oil
Table 2 shows the oil outcome results from each run. The three independent variables were plotted versus the produced oil using response surface plot in order to get the mathematical model for the extraction process.| Run | Extraction time (hour) | Volume of methanol (mL) | Weight of sample (g) | Extracted oil | |
|---|---|---|---|---|---|
| (g) | % | ||||
| 1 | 3 | 250 | 20 | 2.02 | 10.1 |
| 2 | 5 | 250 | 20 | 2.29 | 11.45 |
| 3 | 3 | 750 | 20 | 2.57 | 12.85 |
| 4 | 5 | 750 | 20 | 2.88 | 14.4 |
| 5 | 3 | 500 | 10 | 0.89 | 8.9 |
| 6 | 5 | 500 | 10 | 1.27 | 12.7 |
| 7 | 3 | 500 | 30 | 3.41 | 11.36 |
| 8 | 5 | 500 | 30 | 3.87 | 12.9 |
| 9 | 4 | 250 | 10 | 0.56 | 5.6 |
| 10 | 4 | 750 | 10 | 0.98 | 9.8 |
| 11 | 4 | 250 | 30 | 3.34 | 11.13 |
| 12 | 4 | 750 | 30 | 4.56 | 15.2 |
| 13 | 4 | 500 | 20 | 2.79 | 13.95 |
| 14 | 4 | 500 | 20 | 2.48 | 12.4 |
| 15 | 4 | 500 | 20 | 2.23 | 11.15 |
3.1.1.1 Analysis of variance (ANOVA) of oil recovery. The analysis of variance was used to test the significance of second order model through applying the F-test measurement. F-value is a measurement of variance of data about the mean based on the ratio of mean square of group variance due to error. The main objective of calculating of F-value is to reject the null hypothesis. To reject the null hypothesis, the value of F-calculated must be greater than the value of F-tabulated. Table 3 is the ANOVA table. The value of F-tabulated was determined from the match between the degree of freedom of regression (P − 1) which is 9 and the degree of freedom of error (N − P) which is 5 with 95% confidence level. The value of F-tabulated was 4.772. On the other hand, the value of F-calculated was determined by dividing the mean square of regression due to mean square of error as shown in Table 4. The value of F-calculated was 25.547 based on the data obtained from the experiments. That means the value of F-calculated is greater than the value of F-tabulated (Fcal. > Ftab.). Therefore, the model is significant and the rejection of null hypothesis is being accepted. Furthermore, the estimated model that fits the data can be measured by the value of 0.978 based on NOVA table. This implies that 97.8% of the total variance is justified by the model, indicating a good correlation and agreement between the experimental and the predicted values.
R square is 97.8%, which is >80%, which indicated a very good agreement between the experimental and the predicted values.
| Factor | ANOVA; var.: oil yield (g); R-sqr = 0.97872; Adj: 3 3-level factors, 1 blocks, 15 runs; MS residual. DV: oil yield (g) | ||||
|---|---|---|---|---|---|
| SS | df | MS | F | P | |
| (1)Extraction time (hour) L + Q | 0.5537 | 2 | 0.127687 | 1.6400 | 0.283375 |
| (2) Volume of methanol (mL) L + Q | 0.96937 | 2 | 0.484687 | 6.2251 | 0.043946 |
| (3) Weight of sample (g) L + Q | 16.51848 | 2 | 8.259238 | 106.0781 | 0.000080 |
| 1 × 2 | 0.00040 | 1 | 0.000400 | 0.0051 | 0.945639 |
| 1 × 3 | 0.00160 | 1 | 0.001600 | 0.0205 | 0.891611 |
| 2 × 3 | 0.16000 | 1 | 0.160000 | 2.0550 | 0.211159 |
| Error | 0.38930 | 5 | 0.077860 | ||
| Total SS | 18.29109 | 14 | |||
| Sources | Sum of squares | Degree of freedom | Mean squares | Fcalculated |
|---|---|---|---|---|
| Regression SSR | 17.90179 | 9 (P − 1) | SSR/dfR = 1.98908 | MS(R)/MS(E) = 1.98908/0.07786 = 25.547 |
| Error SSE | 0.38930 | 5 (N − P) | SSE/dfE = 0.07786 | |
| Total SST | 18.29109 | 14 (N − 1) |
3.1.1.2 Response surface and contour plot of produced oil. Fig. 2 shows the effect of extraction time and volume of solvent (methanol) on the produced oil. It can be observed that the extracted oil increased when the extraction time increased and vice versa. This was attributed to the short extraction time which is not effective enough for the diffusion process of the solute in the solvent. The extraction process reaches the equilibrium state when all the solutes are completely extracted and at that time. Any additional time have positive effect on the rate of extraction. This is because the extraction process is already completed.8 Other researchers have also confirmed that increasing the extraction time enhances the extraction of most components and results in higher outcome.9 On the other hand, it can be seen from Fig. 2 that the oil recovery increased when the volume of the solvent increased, while it decreased when the volume of the solvent decreased. Also, larger quantities of solvent enhanced and improved the establishment of equilibrium between the oil and the solvent with the resultant effect of increasing the oil recovery. The large volume of solvent also promotes an increase in the concentration gradient between the solvent and the solid sample. As a consequence, a large mass transfer occurred between the solid sample and solvent leading to high oil recovery.10
 | ||
| Fig. 2 Response surface plot for the effect of extraction time and volume of methanol on the oil recovery (3 3-level factors, 1 blocks, 15 runs; MS residual = 0.07786). | ||
Fig. 3 shows the effect of extraction time and weight of sample on the oil recovery. It can be observed that the weight of the sample is the most dominant factor in the extraction process of the oil. The Pareto chart showed that the weight of the sample had a significant effect on the oil recovery. The reason is large amount of sample produces high oil recovery since there are many molecules of the sample that can dissolve in the solvent resulting in high oil extraction. Also, the sample was dried and ground to powder in other to release the sample from the moisture content. High moisture content could generate unwanted phenomenon and toxic compounds which can result in lesser recovery and lower quality of the oil. It has been confirmed that increasing the sample weight enhances the oil recovery.11 A constant weight of sample has also been used in another study.12–16 It was observed that extraction time influenced the oil recovery but when extended, it becomes less efficient than the weight of the sample. However, less extraction time had insignificant effect on extraction efficiency for a given dynamic extraction. In contrast, increasing the extraction time improved dramatically the extraction efficiency.17
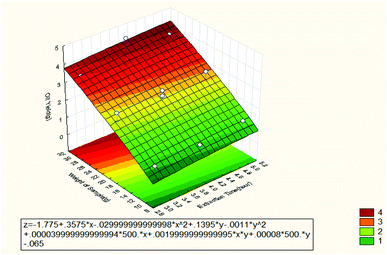 | ||
| Fig. 3 Response surface plot for the effect of extraction time and weight of sample on the oil recovery (3 3-level factors, 1 blocks, 15 runs; MS residual = 0.07786). | ||
Fig. 4 shows the effect of volume of methanol and weight of sample on the oil recovery. It can be seen that the oil recovery increased when the weight of sample and volume of methanol were increased. The optimum value for the extracted oil was 15.2% (4.56 g) at 30 g of sample weight and 750 mL volume of methanol. That means there is good interaction between the two independent variables. From the Pareto chart, the most dominant factor was the weight of the sample followed by the volume of methanol.
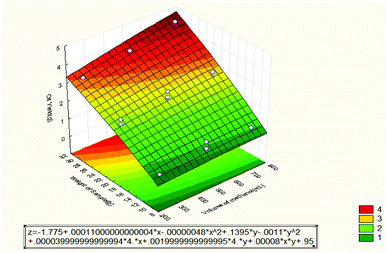 | ||
| Fig. 4 Response surface plot for the effect of volume of methanol and weight of sample on the oil recovery (3 3-level factors, 1 blocks, 15 runs; MS residual = 0.07786). | ||
The effect of extraction time on the oil recovery had less impact based on the results from the Pareto chart in Fig. 8. However, shorter extraction time was not efficient for the solute to dissolve in the solvent since not all solute can be extracted. It is important to maximize the contact of sample with the solvent to enhance the efficiency of the Soxhlet extraction. The result also showed that oil recovery was enhanced between 4–5 hours prior to dynamic extraction and also improved the oil recovery in the Soxhlet extractor. At 4 hours' extraction time, the highest oil recovery of 4.56 was obtained. The volume of methanol had the second impact on the extracted oil as shown in Fig. 8. The polarity of methanol also matched the polarity of the compounds of interest since they are both polar.
The weight of the sample in linear form had the most dominant and significant effect on the oil recovery as shown in Fig. 5. The maximum extracted oil was achieved at a higher weight of sample which is 30 g according to the experimental data.
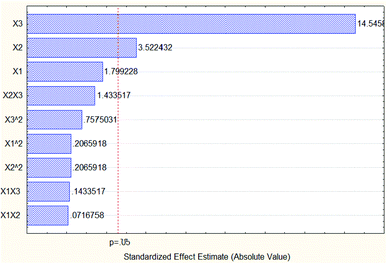 | ||
| Fig. 5 Pareto chart of standardized effects of oil recovery (3 3-level factors, 1 blocks, 15 runs; MS residual = 0.07786). | ||
From Fig. 2–4, the mathematical model for the extraction process was obtained as shown below:
| Z1 = −1.775 + 0.3575X1 − 0.0299X12 + 0.00011X2 − 0.0000048X22 + 0.000399X1X2 | (1) |
| Z2 = −1.775 + 0.3575X1 − 0.0299X12 + 0.1395X3 − 0.011X32 + 0.00199X1X3 | (2) |
| Z3 = −1.775 + 0.00011X2 − 0.0000048X22 + 0.1395X3 − 0.011X32 + 0.0008X2X3 | (3) |
Thus, the final mathematical model is shown in eqn (4):
| Z = −1.775 + 0.3575X1 − 0.0299X12 + 0.00011X2 − 0.0000048X22 + 0.1395X3 − 0.011X32 + 0.000399X1X2 + 0.00199X1X3 + 0.0008X2X3 | (4) |
Eqn (4) was obtained from the summary of eqn (1)–(3). The interpretation of eqn (4) is based on the magnitude and sign of the regression coefficient. Coefficient of independent variables with higher value shows greater influence on the response. The sign indicates the direction of the proportionality coefficient in relation to the response. A positive sign implies that the relation between the independent variable and the response is directly proportional, while a negative sign implies the relation between independent variables and the response is inversely proportional.
3.2 GC-MS analysis of essential oil concentration
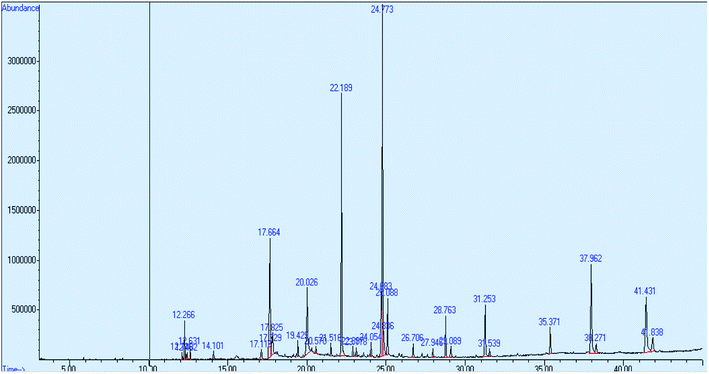
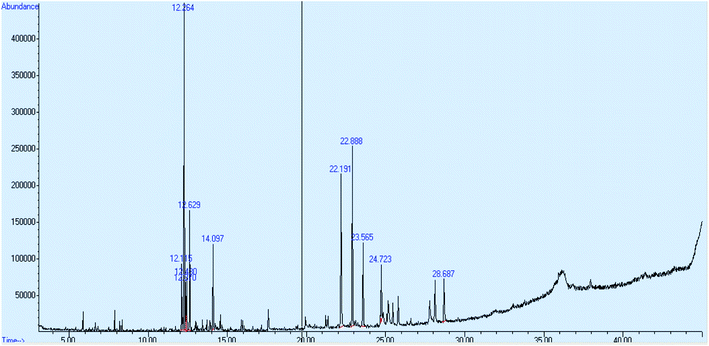
For run number 1, the peak of essential oil was identified at a retention time of 12.631 minutes and the value of concentration in % area was 0.41. From NIST Library, the name of the selected essential oil compound is 1, 6, and 10-dodecatriene. Fig. 6 shows the chromatogram of the essential oil for run number 1.Fig. 7 shows the chromatogram of the essential oil for run number 2. The peak of essential oil was identified at a retention time of 12.631 minutes and the value of concentration in % area is 7.41.
The concentration of oil in % area for all runs is shown in Table 5. All the essential oils were eluted at almost the same retention time of 12.6 minutes. The percentage concentration of essential oil could not be identified at runs 10, 11, 13, 14 and 15.
| Run | Retention time | Peak number | Conc. of oil in % area |
|---|---|---|---|
| 1 | 12.631 | 4 | 0.41 |
| 2 | 12.631 | 5 | 7.41 |
| 3 | 12.625 | 2 | 15.03 |
| 4 | 12.625 | 5 | 10.13 |
| 5 | 12.625 | 2 | 18.81 |
| 6 | 12.625 | 3 | 12.69 |
| 7 | 12.625 | 3 | 14.92 |
| 8 | 12.620 | 2 | 22.64 |
| 9 | 12.625 | 2 | 1.75 |
| 10 | 0 | 0 | 0 |
| 11 | 0 | 0 | 0 |
| 12 | 12.620 | 2 | 17.95 |
| 13 | 0 | 0 | 0 |
| 14 | 0 | 0 | 0 |
| 15 | 0 | 0 | 0 |
3.2.1.1 Analysis of variance (ANOVA) of oil concentration. The analysis of variance was used for the concentration in % area of essential oil. Table 6 shows ANOVA table of the oil concentration in % area. The value of F-tabulated was obtained from the match between the degree of freedom of regression (P − 1) which is 9 and the degree of freedom of error (N − P) which is 5 at 95% confidence level. So, the value of F-tabulated was 4.772. On the other hand, the value of F-calculated was determined by dividing the mean square of regression due to the mean square of error as shown in Table 7. The value of F-calculated was 40.787 based on the data obtained from the experiments. That means the value of F-calculated is greater than the value of F-tabulated (Fcal. > Ftab.). Therefore, the model is significant and the rejection of the null hypothesis is accepted. The estimated model that fits the data can be measured by the value of R2, which is 0.9865 based on the ANOVA table. This implies that 98.65% of the total variance is justified by the model, indicating a good correlation and agreement between the GC-MS data and the predicted values.
R square is 98.65%, which is >80%, it means very good agreement between GC-MS data and predicted values.
| Factor | ANOVA; var.: con. % area; R-sqr = 0.98656; Adj: 3 3-level factors, 1 blocks, 15 runs; MS residual. DV: con. % area | ||||
|---|---|---|---|---|---|
| SS | df | MS | F | P | |
| (1) Extraction time (hour) L + Q | 392.8579 | 2 | 196.4290 | 75.28235 | 0.000185 |
| (2) Volume of methanol (mL) L + Q | 156.0956 | 2 | 78.0478 | 29.91219 | 0.001652 |
| (3) Weight of sample (g) L + Q | 241.4428 | 2 | 120.7214 | 46.26706 | 0.000595 |
| 1 × 2 | 35.4025 | 1 | 35.4035 | 13.56818 | 0.014242 |
| 1 × 3 | 47.8864 | 1 | 47.8864 | 18.35269 | 0.007834 |
| 2 × 3 | 97.0225 | 1 | 97.0225 | 37.18434 | 0.001717 |
| Error | 13.0462 | 5 | 2.6092 | ||
| Total SS | 970.8454 | 14 | |||
| Sources | Sum of squares | Degree of freedom | Mean squares | Fcalculated |
|---|---|---|---|---|
| Regression SSR | 957.7992 | 9 (P − 1) | SSR/dfR = 106.422 | MS(R)/MS(E) = 106.422/2.6092 = 40.787 |
| Error SSE | 13.0462 | 5 (N − P) | SSE/dfE = 2.6092 | |
| Total SST | 970.8454 | 14 (N − 1) |
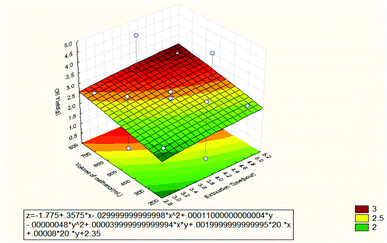
3.2.1.2 Response surface and contour plot of oil concentration. Fig. 8 shows the effect of extraction time and volume of solvent (methanol) on the essential oil concentration in % area. It was observed that the oil concentration in % area increased when the extraction time increased to 5 hours. From the Pareto chat, it can be seen that the quadratic extraction time is the most dominant factor on the oil concentration % area. However, the oil concentration % area was high at 3 hours of extraction time and then dropped at 4 hours. The oil concentration % area reached its maximum value at 5 hours. The reason is most likely due to the different selectivity of the oil components and different selectivity of the independent variables. Besides, the increase in essential oils concentrations with extraction time is probably due to their higher molecular weights, higher volatilities and lower solubility in solvent than the other constituents. More time is required for the oil concentration to reach the maximum levels in the oil recovery as also observed by other workers.18 The decrease in the concentration during the later stages of extraction may be due to enhanced leaching of substances that are more difficult to be extracted. As a consequence of the relationship between the extraction conditions and qualitative composition of the oil extract, the latter can be manipulated by changing the conditions of the extraction such as static extraction time.19 The volume of methanol was observed to be the lowest factor that influenced the oil concentration % area. The maximum concentration of oil was obtained at 500 mL. However, it can be seen that the oil concentration % area increased with increasing solvent volume from 250 to 500 mL and then decreased. The decrease after 500 mL can be attributed to insufficient equilibration time.20 Also, it has been reported that a major concentration gradient is derived from the utilization of higher solvent quantities. As a result, an expectable intensification of mass transfer from the solid matrix to solvent is produced.21
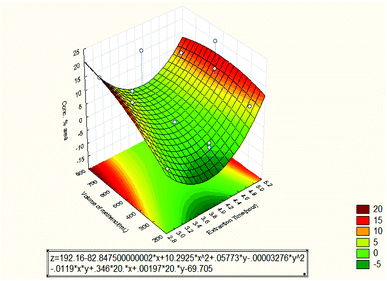 | ||
| Fig. 8 Response surface plot for the effect of extraction time and volume of methanol on the oil concentration % area (3 3-level factors, 1 blocks, 15 runs; MS residual = 2.60923). | ||
Fig. 9 shows the effect of extraction time and weight of sample on the oil concentration % area. In this case, it can be seen that the effect of the weight of sample was varied from 10 to 30 g and the maximum concentration % area was obtained at weight equal to 30 g and 5 hours. That means, there was good interaction between the two independent variables until the concentration % area reached the maximum value of 22.64. The Pareto chart showed that the quadratic weight of the sample had the second effect on the oil concentration % area while the quadratic extraction time had the dominant effect on the oil concentration. The oil concentration % area was high at 10 g and dropped gradually until at 30 g that it raised again. The reason might be due to the different selectivity of essential oil compositions. Other researchers have summited that the percent concentrations of oil increase continuously with increasing sample weight and then decrease with further increase of the sample weight.20,22 This is an indication that increasing the sample weight has no further effect on the mass transfer into the extracting solvent. The observed extraction behavior might also be related to solubility of the volatile compounds in the solvent. However, the effect of the extraction time still remained to be the same as the previous case.
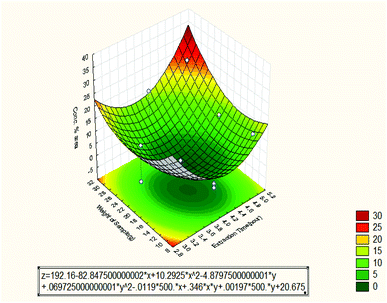 | ||
| Fig. 9 Response surface plot for the effect of extraction time and weight of sample on the oil concentration % area (3 3-level factors, 1 blocks, 15 runs; MS residual = 2.60923). | ||
Fig. 10 shows the effect of volume of methanol and weight of sample on the oil concentration % area. It can be seen that the oil concentration % area was high at 10 g weight and dropped at 20 g weight but raised again to the maximum value at 30 g weight. This is due to different selectivity of the run conditions. On the other hand, the effect of methanol volume was maximum at 500 mL since the optimum value of the oil concentration % area was obtained at 500 mL. Other researchers have also agreed that choosing the most suitable extraction solvent is very critical especially in the analysis of volatile components of essential oil. This is due to the great differences in the volatility and polarity of the compounds.23 From the Pareto chart, the quadratic weight of the sample had the second effect while the linear volume of methanol had the lowest effect on the oil concentration % area.
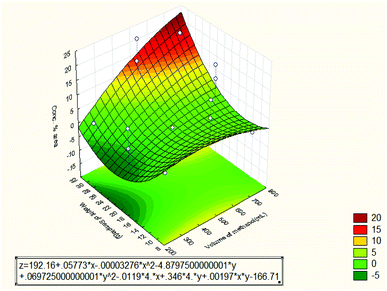 | ||
| Fig. 10 Response surface plot for the effect of volume of methanol and weight of sample on the oil concentration % area (3 3-level factors, 1 blocks, 15 runs; MS residual = 2.60923). | ||
Based on the data of Pareto chart of standardized effects of the oil % area in Fig. 11, the quadratic extraction time with value −12.2437 had the most dominant effect on the oil concentration percentage area without taking into consideration the negative sign.
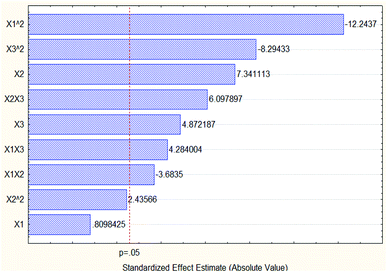 | ||
| Fig. 11 Pareto chart of standardized effects of the oil concentration % area (3 3-level factors, 1 blocks, 15 runs; MS residual = 2.60923). | ||
From Fig. 8–10, the mathematical model for the extraction process was obtained as shown below:
| Z1 = 192.16 − 82.8475X1 + 10.2925X12 + 0.05773X2 − 0.00003276X22 − 0.0119X1X2 | (5) |
| Z2 = 192.16 − 82.8475X1 + 10.2925X12 − 4.8797X3 + 0.06972X32 + 0.346X1X3 | (6) |
| Z2 = 192.16 + 0.05773X2 − 0.00003276X22 − 4.8797X3 + 0.06972X32 + 0.00197X2X3 | (7) |
Thus, the final mathematical model is shown in eqn (8):
| Z = 192.16 − 82.8475X1 + 10.2925X12 + 0.05773X2 − 0.00003276X22 − 4.8797X3 + 0.06972X32 + 0.346X1X3 − 0.0119X1X2 + 0.00197X2X3 | (8) |
Eqn (8) was obtained from the summary of eqn (5)–(7). The interpretation of eqn (8) is based on the magnitude and sign of the regression coefficient. Coefficient of independent variables with higher value shows greater influence on the response. The sign indicates the direction of the proportionality coefficient in relation to the response. A positive sign implies that the relation between the independent variable and the response is directly proportional. Meanwhile, a negative sign implies the relationship between independent variables and the response is inversely proportional.
4. Conclusion
The essential oil of ginger rhizome was successfully extracted and analyzed using Soxhlet extraction and GC-MS respectively. The highest oil recovery was 15.2% while the highest oil concentration % area was 22.64. The best operation conditions for the oil recovery were 4 hours of extraction time, 750 mL of volume of methanol and 30 g of weight of sample. The best operation conditions for the oil concentration % area were 5 hours of extraction time, 500 mL of volume of methanol and 30 g of weight of sample. The results obtained from statistical analysis showed that the second-order models and Box–Behnken design were sufficient to describe, explain and predict the response variable of the oil recovery and oil concentration % area to change in the process parameters for the Soxhlet extraction of essential oil within the experimental ranges. The linear weight of the sample had a significant effect on the extracted oil while the quadratic extraction time had the significant effect on the oil concentration % area.Conflicts of interest
There are no conflicts to declare.References
- P. V. Nielsen and R. Rios, Inhibition of fungal growth on bread by volatile components from spices and herbs, and the possible application in active packaging, with special emphasis on mustard essential oil, Int. J. Food Microbiol., 2000, 60(2), 219–229 CrossRef CAS PubMed.
- S. Shobana and K. Akhilender Naidu, Antioxidant activity of selected Indian spices, Prostaglandins, Leukotrienes Essent. Fatty Acids, 2000, 62(2), 107–110 CrossRef CAS PubMed.
- F. Salie, P. F. K. Eagles and H. M. J. Leng, Preliminary antimicrobial screening of four South African Asteraceae species, J. Ethnopharmacol., 1996, 52(1), 27–33 CrossRef CAS PubMed.
- M. J. Wargovich, et al., Herbals, cancer prevention and health, J. Nutr., 2001, 131(11), 3034S–3036S CrossRef CAS PubMed.
- J. Knowlton and S. Pearce, Handbook of cosmetic science and technology, 1993, available from: http://site.ebrary.com/id/10959847 Search PubMed.
- P. E. Shaw, Review of quantitative analyses of citrus essential oils, J. Agric. Food Chem., 1979, 27(2), 246–257 CrossRef CAS.
- E. Langner, S. Greifenberg and J. Gruenwald, Ginger: history and use, Adv. Ther., 1998, 15 1, 25–44 Search PubMed.
- C. Geankoplis, Transport processes and separation process principles (includes unit operations) fourth edition, Prentice Hall Press, 2003 Search PubMed.
- Y. Zhannan, et al., GC-MS Analysis of the Essential Oil of Coral Ginger (Zingiber corallinum Hance) Rrhizome Obtained by Supercritical Fluid Extraction and Steam Distillation Extraction, Chromatographia, 2009, 69(7), 785 CrossRef.
- S. Abdullah, et al., Ultrasonic extraction of oil from Monopterus albus: effects of different ultrasonic power, solvent volume and sonication time, J. Appl. Sci., 2010, 10(21), 2713–2716 CrossRef CAS.
- E. Psillakis and N. Kalogerakis, Solid-phase microextraction versus single-drop microextraction for the analysis of nitroaromatic explosives in water samples, J. Chromatogr. A, 2001, 938(1–2), 113–120 CrossRef CAS PubMed.
- L. Wanga, et al., Chemical composition of the essential oil of Elephantopus scaber from Southern China, Z. Naturforsch., C: J. Biosci., 2004, 59(5–6), 327–329 CrossRef PubMed.
- A. Ahmad, et al., Optimization of Soxhlet extraction of Herba Leonuri using factorial design of experiment, Int. J. Chem., 2010, 2(1), 198 CAS.
- D. Biscaia and S. R. S. Ferreira, Propolis extracts obtained by low pressure methods and supercritical fluid extraction, J. Supercrit. Fluids, 2009, 51(1), 17–23 CrossRef CAS.
- M. J. Alfaro, et al., Influence of solvent, matrix dielectric properties, and applied power on the liquid-phase microwave-assisted processes (MAP™)11MAP is a Trademark of Her Majesty the Queen in Right of Canada as represented by the Minister of the Environment. extraction of ginger (Zingiber officinale), Food Res. Int., 2003, 36(5), 499–504 CrossRef.
- M. N. I. Bhuiyan, J. U. Chowdhury and J. Begum, Chemical investigation of the leaf and rhizome essential oils of Zingiber zerumbet (L.) Smith from Bangladesh, Bangladesh J. Pharmacol., 2009, 4(1), 9–12 Search PubMed.
- L. Spack, et al., Comparison of supercritical fluid extraction (SFE), Soxhlet and shaking methods for pendimethalin extraction from soils: effect of soil properties and water content, J. Contam. Hydrol., 1998, 33(1), 171–185 CrossRef CAS.
- B. Bayramoglu, S. Sahin and G. Sumnu, Solvent-free microwave extraction of essential oil from oregano, J. Food Eng., 2008, 88(4), 535–540 CrossRef CAS.
- L. Gámiz-Gracia and M. D. Luque de Castro, Continuous subcritical water extraction of medicinal plant essential oil: comparison with conventional techniques, Talanta, 2000, 51(6), 1179–1185 CrossRef.
- A. R. Fakhari, et al., Hydrodistillation-headspace solvent microextraction, a new method for analysis of the essential oil components of Lavandula angustifolia Mill, J. Chromatogr. A, 2005, 9, 1–2 Search PubMed.
- D. Franco, et al., Processing of Rosa rubiginosa: extraction of oil and antioxidant substances, Bioresour. Technol., 2007, 98(18), 3506–3512 CrossRef CAS PubMed.
- M. Jalali Heravi and H. Sereshti, Determination of essential oil components of Artemisia haussknechtii Boiss. using simultaneous hydrodistillation-static headspace liquid phase microextraction-gas chromatography mass spectrometry, J. Chromatogr. A, 2007, 10, 1–2 Search PubMed.
- L. Fang, et al., Headspace solvent microextraction-gas chromatography–mass spectrometry for the analysis of volatile compounds from Foeniculum vulgare Mill, J. Pharm. Biomed. Anal., 2006, 41(3), 791–797 CrossRef CAS PubMed.
| This journal is © The Royal Society of Chemistry 2022 |

