 Open Access Article
Synthesis, structural and electrical characterization of a new organic inorganic bromide: [(C3H7)4N]2CoBr4†
M. Khalfa *a,
A. Oueslati
 b,
K. Khirounia,
M. Gargourib,
A. Rousseauc,
J. Lhoste
 c,
J.-F. Bardeauc and
G. Corbel
 c
c
aLaboratoire de Physique des Matériaux et des Nanomatériaux appliquée à l’Environnement, Faculté des Sciences de Gabès cité Erriadh, 6079 Gabès, Tunisia. E-mail: maryemkhalfa28@gmail.com
bLaboratory for Spectroscopic Characterization and Optics of Materials, Faculty of Sciences, University of Sfax, B. P. 1171, 3000 Sfax, Tunisia
cInstitut des Molécules et Matériaux du Mans (IMMM), UMR-6283 CNRS, Le Mans Université, Avenue Olivier Messiaen, 72085 Le Mans Cedex 9, France
First published on 20th January 2022
Abstract
A new organic inorganic hybrid [TPA]2CoBr4, where TPA = [(C3H7)4N]+ (i.e., tetra-propyl-ammonium) compound has been synthesized by slow evaporation method at room temperature. Single crystal X-ray diffraction (SC-XRD), X-ray powder diffraction (XRPD), thermal analyses, vibrational and complex impedance spectroscopy have been used to characterize both structural, thermal, electrical properties. [TPA]2CoBr4 crystallizes in the monoclinic system (C2/c space group) with the following cell parameters: a = 33.145 (5) Å, b = 14.234 (3) Å, c = 15.081 (2) Å and β = 110.207 (5)°. In the crystal structure, the organic TPA cations which form layers stacked along the a-axis, are separated from each other by inorganic tetrahedral [CoBr4]2− anions. The XRPD pattern confirms both the high purity of the sample and the crystalline nature of the powder. The differential scanning calorimetry (DSC) analysis shows an endothermic peak at 394 K upon heating which is ascribed to a structural phase transition since no decomposition of the titled compound is evidenced by thermogravimetric analysis. The ac conductivity and the dielectric properties confirm the presence of the phase transition. At the structural phase transition around 394 K, a change from a quantum mechanical tunneling to a correlated barrier hopping conduction models is determined from the temperature dependence of the exponent s of the Jonscher's power law. The analysis of complex impedance spectra shows that the electrical properties of the material are heavily dependent on frequency and temperature, indicating a relaxation phenomenon and semiconductor-type behavior. One single semicircle is detectable in the Nyquist plots of the complex impedance spectra which can be satisfactorily fitted with a combination R//CPE elements assigned to the bulk response. This behavior suggests that the sample is electrically homogeneous. Capacitance analysis proves the high effective permittivity at radio frequencies in the sample.
1. Introduction
In recent years, research on organic–inorganic hybrid materials has had a great expansion due to the fascinating opportunities for the preparation of a large variety of materials and the diversity of physicochemical properties which leads to a broad range of applications for treating wastewater, optical devices, information storage, solar cell, photocatalyst, thin film transistor, etc.1–3 Physical properties of stimuli-responsive materials are highly sensitive to external stimuli such as temperature, light, pressure, electric and magnetic fields, etc.4–7 In particular, the switching of bulk properties between at least two distinct states through multiple physical paths has potential applications as sensors, signal processing and memory devices.8,9 Among them, switchable dielectric compounds, whose dielectric constants can be converted between low and high states, have taken an emerging position in the field of stimuli responsive materials. Temperature behaves as the most frequently used and easily controlled trigger. In this context, thermal induced phase transition compounds have afforded great potentials as promising switchable dielectrics, and their physical responses display abrupt changes in the vicinity of phase transition. In particular, the hybrid compounds with general formula R2MX4 (R: tetra-alkylammonium cations = ((CnH2n+1)4N where n = 1, 2, 3); M: metal = Fe, Co, Cu, Mn, Cd… and X: halogen = Cl, Br, I) show many structural transitions of the order–disorder type, due to reorientation/displacements of tetra-alkylammonium cations.10–13 Several compounds incorporating tetra-propyl-ammonium (TPA) cations have already been reported in literature such as [TPA]2CuI4,14 [TPA]2CoCl4.15 They have special interest because of their specific properties (nonlinear optical activity, semiconductor behavior, ferroelectric and ferroelastic properties…).16,17Special attention is paid to compounds where tetrahedral coordination of divalent cobalt by anions leads to interesting electrical properties. Indeed, the tetrahedral crystal field splits the five d-orbitals of the divalent cobalt ion into two sets. The doubly degenerate e-orbitals are stabilized while the triply degenerate t2 orbitals are destabilized relative to their energies in a spherical field. For the d7 electronic configuration of Co2+ ion, the e-orbitals are fully occupied, whereas equal occupancies of the three t2 orbitals are noted (i.e.(e)4(t2)3 with three unpaired electrons).18 Surprisingly, the bromine analogue of [TPA]2CoCl4 has never been synthesized or characterized. This study aims to fill this gap.
The new [TPA]2CoBr4 compound has therefore been prepared with the aim of studying its thermal, vibrational and electrical properties by using thermogravimetric and differential thermal analyses (TGA-DTA), differential scanning calorimetry (DSC), Raman spectroscopy and complex impedance spectroscopy, respectively. Its crystal structure was determined from X-ray diffraction data collected on a single crystal obtained by the slow evaporation method.
2. Experimental details
The synthesis of the [TPA]2CoBr4 compound was carried out using the reported preparation procedure19,20 used for other hybrid compounds. [(C3H7)4N Br] (purity 98%, FLUKA) and CoBr2 (purity 98%, FLUKA) were dissolved in distilled water. The corresponding chemical reaction is:The solution is kept at room temperature and after slow evaporation for 7 days, micrometric blue crystals begin to appear.
The phase purity was first checked on crushed crystals by recording X-ray powder diffraction (XRPD) pattern at room temperature on a Panalytical θ/2θ Bragg–Brentano Empyrean diffractometer (using Cu Kα1+2 radiations) equipped with the PIXcel1D detector. XRPD pattern was collected in the [5–100°] scattering angle range, with a 0.0131° step size, for a total acquisition time of 10 h.
Prior to any crystal structure determination, micrographs were collected on several crystals with a JEOL JSM-6510LV scanning electron microscope (SEM). To obtain high quality micrographs, a thin gold film was sputtered with a JEOL JFC 1200 fine coater on few crystals randomly spread on a carbon tape. These SEM images displayed in Fig. 1 show that the average size of crystals is ranging from ≈700 to 1500 nm. Sometimes, two crystals simultaneously grow in two directions from one twin boundary, thus forming V-shape twinned crystals as observed in Fig. 1. An OXFORD Energy Dispersive X-ray Spectrometer (EDS) coupled to the microscope was also employed to verify the presence of Co, Br, C and N elements and their spatial distributions within the crystals. The distribution of these four elements is homogeneous as shown in EDS elemental maps displayed in Fig. 1. The crystals correspond to an organic cobalt bromide whose structure was then determined from X-ray diffraction data collected on a single crystal.
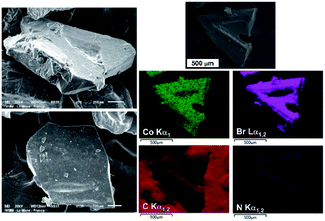 | ||
| Fig. 1 SEM images of large [(C3H7)4N]2CoBr4 crystals grown by slow evaporation method at room temperature and EDS elemental Co, Br, C and N maps collected on two V-shape twinned crystals. | ||
Crystals were selected under polarizing optical microscope and mounted on MicroMount needles (MiTiGen) for single-crystal X-ray diffraction experiments. X-ray intensity data were collected on a Bruker APEX II Quazar diffractometer (4 circle Kappa goniometer, CCD detector) using Iμs microfocus source (Mo-Kα radiation with λ = 0.71073 Å) at 296 K. The structure solutions were obtained by direct methods, developed by successive difference Fourier syntheses, and refined by full-matrix least-squares on all F2 data using SHELX program suite in Bruker APEX2 interface. A summary of the measurements, isotropic and anisotropic displacement parameters is represented in Tables 1–3, respectively.
| Compound | CoBr4N2C24H56 |
|---|---|
| CCDC number | 2087968 |
| M (g mol−1) | 751.3 |
| Crystal system | Monoclinic |
| ρcalc (g cm−3) | 1.492 |
| Space group | C2/c |
a![[thin space (1/6-em)]](https://www.rsc.org/images/entities/char_2009.gif) (Å) (Å) |
33.179(7) |
b![[thin space (1/6-em)]](https://www.rsc.org/images/entities/char_2009.gif) (Å) (Å) |
14.251(3) |
c![[thin space (1/6-em)]](https://www.rsc.org/images/entities/char_2009.gif) (Å) (Å) |
15.092(3) |
β![[thin space (1/6-em)]](https://www.rsc.org/images/entities/char_2009.gif) (°) (°) |
110.281(5) |
V![[thin space (1/6-em)]](https://www.rsc.org/images/entities/char_2009.gif) (Å3) (Å3) |
6693(2) |
| Z | 8 |
| Wavelength (Å) | MoKα |
| 2θ range (°) | 4.0–55.0 |
| Limiting indices | −43 ≤ h ≤ 42 |
| −18 ≤ k ≤ 18 | |
| −15 ≤ l ≤ 19 | |
| μ(Mo, Kα) (mm−1) | 5.30 |
| F(000) | 2936 |
| No. of unique reflns | 7670 |
| No. of obsd reflns [I > 2σ(I)] | 4072 |
| Parameters | 283 |
| GOF | 0.997 |
| Final R indices [I > 2σ(I)] | R1 = 0.0473, wR2 = 0.1059 |
| R indices (all data) | R1 = 0.1181, wR2 = 0.1330 |
| Largest diff. peak and hole (e Å−3) | −0.602, 0.652 |
| Atom | x | y | z | Ueq (Å2) |
|---|---|---|---|---|
| Co(1) | 0.87181(2) | 0.74661(5) | 0.40124(5) | 0.0547(2) |
| Br(1) | 0.92105(2) | 0.66100(4) | 0.34313(4) | 0.07237(19 |
| Br(2) | 0.80904(2) | 0.80317(5) | 0.27453(4) | 0.0822(2) |
| Br(3) | 0.90868(2) | 0.87700(4) | 0.49744(5) | 0.0834(2) |
| Br(4) | 0.84604(2) | 0.64364(5) | 0.49597(5) | 0.0847(2) |
| N(1) | 1/2 | 0.4088(4) | 0.250000 | 0.0501(13) |
| C(1) | 0.49200(16) | 0.3460(3) | 0.1647(3) | 0.0544(12) |
| H(1)A | 0.516023 | 0.303014 | 0.177629 | 0.065 |
| H(1)B | 0.466567 | 0.308716 | 0.157147 | 0.065 |
| C(2) | 0.4860(2) | 0.3945(4) | 0.0724(3) | 0.0710(15) |
| H(2)A | 0.511963 | 0.428499 | 0.077015 | 0.085 |
| H(2)B | 0.462669 | 0.439344 | 0.059143 | 0.085 |
| C(3) | 0.4759(2) | 0.3238(5) | −0.0075(4) | 0.0842(18) |
| H(3)A | 0.498706 | 0.278429 | 0.006447 | 0.126 |
| H(3)B | 0.473361 | 0.355640 | −0.065240 | 0.126 |
| H(3)C | 0.449423 | 0.292485 | −0.014224 | 0.126 |
| C(4) | 0.53847(15) | 0.4719(3) | 0.2626(4) | 0.0580(13) |
| H(4)A | 0.531758 | 0.512540 | 0.207823 | 0.070 |
| H(4)B | 0.542451 | 0.511563 | 0.317159 | 0.070 |
| C(5) | 0.58072(17) | 0.4229(4) | 0.2754(4) | 0.0767(16) |
| H(5)A | 0.590006 | 0.388214 | 0.334338 | 0.092 |
| H(5)B | 0.576865 | 0.378639 | 0.224217 | 0.092 |
| C(6) | 0.61424(19) | 0.4936(5) | 0.2762(5) | 0.099(2) |
| H(6)A | 0.605057 | 0.527463 | 0.217550 | 0.148 |
| H(6)B | 0.640811 | 0.462004 | 0.283955 | 0.148 |
| H(6)C | 0.618340 | 0.536607 | 0.327497 | 0.148 |
| N(2) | 0.75370(12) | 0.4869(3) | 0.5945(2) | 0.0472(9) |
| C(7) | 0.77817(18) | 0.5552(3) | 0.6702(3) | 0.0626(13) |
| H(7)A | 0.803217 | 0.576172 | 0.656553 | 0.075 |
| H(7)B | 0.760125 | 0.609653 | 0.666575 | 0.075 |
| C(8) | 0.7929(2) | 0.5186(5) | 0.7699(4) | 0.0889(19) |
| H(8)A | 0.810133 | 0.462633 | 0.774345 | 0.107 |
| H(8)B | 0.768098 | 0.501693 | 0.786483 | 0.107 |
| C(9) | 0.8190(3) | 0.5916(6) | 0.8380(5) | 0.144(4) |
| H(9)A | 0.841842 | 0.613057 | 0.817688 | 0.216 |
| H(9)B | 0.830964 | 0.564580 | 0.899904 | 0.216 |
| H(9)C | 0.800902 | 0.643531 | 0.839726 | 0.216 |
| C(10) | 0.78013(18) | 0.3982(3) | 0.5980(4) | 0.0659(14) |
| H(10)A | 0.779413 | 0.360336 | 0.650821 | 0.079 |
| H(10)B | 0.766144 | 0.362461 | 0.540865 | 0.079 |
| C(11) | 0.82613(18) | 0.4121(4) | 0.6073(4) | 0.0729(15) |
| H(11)A | 0.842272 | 0.433815 | 0.670639 | 0.088 |
| H(11)B | 0.827906 | 0.460018 | 0.563130 | 0.088 |
| C(12) | 0.8457(2) | 0.3228(4) | 0.5882(4) | 0.0824(18) |
| H(12)A | 0.841967 | 0.274012 | 0.628618 | 0.124 |
| H(12)B | 0.875760 | 0.332251 | 0.600428 | 0.124 |
| H(12)C | 0.831762 | 0.304927 | 0.523400 | 0.124 |
| C(13) | 0.74434(15) | 0.5315(3) | 0.4984(3) | 0.0536(12) |
| H(13)A | 0.771580 | 0.545987 | 0.491053 | 0.064 |
| H(13)B | 0.730011 | 0.485244 | 0.450808 | 0.064 |
| C(14) | 0.71757(18) | 0.6190(4) | 0.4779(4) | 0.0695(15) |
| H(14)A | 0.731212 | 0.666481 | 0.524699 | 0.083 |
| H(14)B | 0.689512 | 0.605540 | 0.481468 | 0.083 |
| C(15) | 0.71252(19) | 0.6552(4) | 0.3803(4) | 0.0793(17) |
| H(15)A | 0.740374 | 0.664896 | 0.375836 | 0.119 |
| H(15)B | 0.697080 | 0.713507 | 0.369538 | 0.119 |
| H(15)C | 0.696894 | 0.610162 | 0.333798 | 0.119 |
| C(16) | 0.71279(18) | 0.4598(4) | 0.6103(4) | 0.0695(15) |
| H(16)A | 0.720558 | 0.430011 | 0.671785 | 0.083 |
| H(16)B | 0.697368 | 0.516932 | 0.613063 | 0.083 |
| C(17) | 0.6830(2) | 0.3970(5) | 0.5405(5) | 0.102(2) |
| H(17)A | 0.698228 | 0.340842 | 0.533687 | 0.122 |
| H(17)B | 0.672327 | 0.428167 | 0.479694 | 0.122 |
| C(18) | 0.6451(2) | 0.3697(4) | 0.5715(5) | 0.098(2) |
| H(18)A | 0.655734 | 0.339008 | 0.631848 | 0.147 |
| H(18)B | 0.626350 | 0.327840 | 0.525749 | 0.147 |
| H(18)C | 0.629533 | 0.425077 | 0.576307 | 0.147 |
| N(3) | 0.000000 | 0.5822(4) | 0.750000 | 0.0551(14) |
| C(19) | 0.9882(3) | 0.5424(8) | 0.6505(8) | 0.063(3) |
| C(20) | 0.9512(4) | 0.4687(8) | 0.6257(9) | 0.074(3) |
| C(21) | 0.9425(2) | 0.4372(5) | 0.5235(5) | 0.107(2) |
| C(22) | 0.9632(4) | 0.6203(9) | 0.7770(9) | 0.079(3) |
| C(23) | 0.9405(6) | 0.7047(14) | 0.7204(13) | 0.129(6) |
| C(24) | 0.9004(2) | 0.7293(6) | 0.7458(6) | 0.121(3) |
| C(19)B | 0.9790(4) | 0.5001(9) | 0.6814(9) | 0.078(3) |
| C(20)B | 0.9572(4) | 0.5258(11) | 0.5795(10) | 0.096(4) |
| C(22)B | 0.9660(4) | 0.6619(9) | 0.7360(9) | 0.071(3) |
| C(23)B | 0.9252(5) | 0.6383(10) | 0.7505(10) | 0.096(4) |
| Atom | U11 | U22 | U33 | U23 | U13 | U12 |
|---|---|---|---|---|---|---|
| Co(1) | 0.0535(4) | 0.0522(4) | 0.0647(4) | −0.0134(3) | 0.0285(3) | −0.0097(3) |
| Br(1) | 0.0651(4) | 0.0728(4) | 0.0889(4) | −0.0121(3) | 0.0389(3) | 0.0046(3) |
| Br(2) | 0.0747(4) | 0.0890(5) | 0.0784(4) | −0.0241(3) | 0.0206(3) | 0.0179(3) |
| Br(3) | 0.0897(4) | 0.0758(4) | 0.0925(5) | −0.0351(3) | 0.0415(4) | −0.0330(3) |
| Br(4) | 0.0821(4) | 0.0795(4) | 0.1058(5) | 0.0051(3) | 0.0494(4) | −0.0219(3) |
| N(1) | 0.052(3) | 0.045(3) | 0.055(3) | 0.000 | 0.021(3) | 0.000 |
| C(1) | 0.050(3) | 0.053(3) | 0.060(3) | −0.009(2) | 0.018(2) | −0.003(2) |
| C(2) | 0.087(4) | 0.069(4) | 0.054(3) | −0.001(3) | 0.022(3) | 0.007(3) |
| C(3) | 0.081(4) | 0.108(5) | 0.059(3) | −0.018(3) | 0.019(3) | 0.004(4) |
| C(4) | 0.066(3) | 0.055(3) | 0.058(3) | −0.005(2) | 0.028(3) | −0.013(3) |
| C(5) | 0.061(3) | 0.081(4) | 0.093(4) | −0.016(3) | 0.033(3) | −0.015(3) |
| C(6) | 0.079(4) | 0.118(6) | 0.116(5) | −0.029(4) | 0.055(4) | −0.041(4) |
| N(2) | 0.054(2) | 0.044(2) | 0.049(2) | 0.0000(18) | 0.0250(19) | −0.0033(18) |
| C(7) | 0.079(4) | 0.053(3) | 0.058(3) | −0.006(3) | 0.027(3) | 0.000(3) |
| C(8) | 0.116(5) | 0.092(5) | 0.060(4) | 0.003(3) | 0.033(4) | 0.001(4) |
| C(9) | 0.203(9) | 0.140(7) | 0.056(4) | −0.012(4) | 0.003(5) | −0.059(7) |
| C(10) | 0.083(4) | 0.049(3) | 0.073(4) | 0.004(3) | 0.035(3) | 0.007(3) |
| C(11) | 0.078(4) | 0.060(3) | 0.085(4) | 0.007(3) | 0.034(3) | 0.005(3) |
| C(12) | 0.096(5) | 0.073(4) | 0.095(4) | 0.011(3) | 0.054(4) | 0.023(3) |
| C(13) | 0.054(3) | 0.051(3) | 0.059(3) | 0.005(2) | 0.024(2) | −0.006(2) |
| C(14) | 0.067(4) | 0.068(4) | 0.073(4) | 0.009(3) | 0.024(3) | 0.005(3) |
| C(15) | 0.070(4) | 0.082(4) | 0.076(4) | 0.021(3) | 0.012(3) | 0.004(3) |
| C(16) | 0.082(4) | 0.061(3) | 0.078(4) | 0.001(3) | 0.043(3) | −0.017(3) |
| C(17) | 0.101(5) | 0.098(5) | 0.125(6) | −0.029(4) | 0.064(5) | −0.033(4) |
| C(18) | 0.079(4) | 0.085(5) | 0.150(6) | −0.007(4) | 0.065(5) | −0.023(4) |
| N(3) | 0.055(3) | 0.055(3) | 0.064(4) | 0.000 | 0.033(3) | 0.000 |
| C(21) | 0.119(6) | 0.119(6) | 0.081(5) | −0.038(4) | 0.034(4) | −0.027(5) |
| C(24) | 0.088(5) | 0.149(7) | 0.121(6) | −0.026(5) | 0.030(4) | 0.058(5) |
Atomic coordinates anisotropic, displacement parameters, tables for all bond distances, and angles have been deposited.
The thermogravimetric and differential thermal analyses were simultaneously performed on 20 mg of crushed blue crystals with a TGA/DTA Q600 SDT TA Instruments apparatus (Pt crucibles, α-Al2O3 as a reference) under N2 flow (100 ml min−1) from the room temperature (RT) to 423 K range (heating/cooling rate of 5 K min−1). The differential scanning calorimetry (DSC) curve was recorded from 163 K to 423 K on a Sirius NETZSCH DSC 3500 analyser equipped with a liquid N2 cooling system by heating at 10 K min−1, using about 7 mg of crushed blue crystals in a closed aluminium crucible.
The Raman spectrum was recorded at room temperature, in the wavenumber range 10–3600 cm−1, with a WITec Alpha 300R confocal Raman spectrometer (WITec GmbH, Ulm Germany). Raman scattered signal was collected under a microscope equipped with a Zeiss EC Epiplan-Neofluar® 50× objective (numerical aperture of 0.5) focusing the 532 nm line of a Solid-State Sapphire laser (Coherent INC., Santa Clara, USA) on the samples. The laser power was fixed to 5 mW on the sample and the integration time was 30 s.
The infrared spectrum was examined at room temperature using a PerkinElmer FT-IR 1000 spectrometer with the sample pressed in spectroscopically pure KBr pellets, over the wavenumber range (400–3500 cm−1). The spectral resolution was typically 4 cm−1.
In order to carry out electrical measurements, the powder, resulting from the grinding of the crystals, was shaped as a pellet (≈8 mm in diameter and 1.3 mm in thickness) in a uniaxial hydraulic press at a pressure of 3 tons per cm2. The pellet was prepared with a relative density of 94% (with respect to the theoretical absolute value calculated from X-ray diffraction data). Then, thin gold films, (with a thickness of a few nanometers), were manually deposited on both flat faces of the pellet.
The coated pellet was then placed between two platinum electrodes for electrical measurements. The complex impedance spectra were measured, in the frequency range 100 Hz–1 MHz, by using a TEGAM 3550 ALF automatic bridge monitored by a microcomputer upon heating from 343 to 418 K.
3. Results and discussion
3.1. Structure description
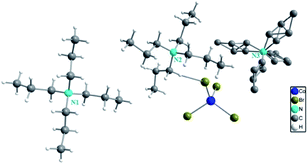
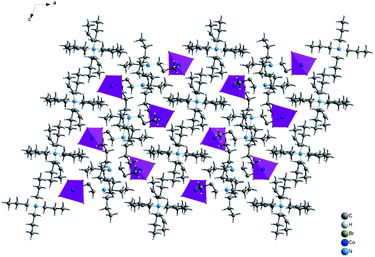
The single crystal X-ray diffraction shows that [TPA]2CoBr4 compound crystallized in the monoclinic system (C2/c space group) with the following unit cell dimensions: a = 33.179(7) Å, b = 14.251(3) Å, c = 15.092(3) Å, β = 110.281(5)° and Z = 8. Fig. 2 and 3 show that the structure of [TPA]2CoBr4 is built up from tetrapropylammonium cations ([(C3H7)4N]+) and cobalt tetrabromide anions ([CoBr4]−).The structural arrangement indicates that the organic cations form layers stacked along the a-axis and separated by inorganic tetrahedral [CoBr4]2− anions. The 3D network cohesion is ensured by hydrogen bonds between bromine atoms and hydrogen atoms of CH3 groups. The distances and angles for anionic and cationic parts are summarized in Table 4. The Co–Br bond lengths vary from 2.403(1) to 2.433(1) Å with a mean value of 2.418 Å. The Br–Co–Br angle values are in the range of 106.66(4)–112.51(3)° with the mean value of 109.585°. These values are close to those observed in the anionic part of [C4H12N2]CoBr4.21
| Atom1–atom2 | d, Å | Atom1–atom2 | d, Å |
|---|---|---|---|
| Co(1)–Br4 | 2.4034(9) | C(11)–C(12) | 1.501(7) |
| Co(1)–Br3 | 2.4137(9) | C(13)–C(14) | 1.499(7) |
| Co(1)–Br2 | 2.4255(10) | C(14)–C(15) | 1.514(7) |
| Co(1)–Br1 | 2.4330(9) | C(16)–C(17) | 1.471(8) |
| N(1)–C(1) | 1.514(5) | C(17)–C(18) | 1.537(8) |
| N(1)–C(4) | 1.518(5) | N(3)–C(22) | 1.517(13) |
| C(1)–C(2) | 1.504(7) | N(3)–C(19) | 1.523(11) |
| C(2)–C(3) | 1.517(7) | N(3)–C(19)B | 1.558(14) |
| C(4)–C(5) | 1.517(7) | N(3)–C(22)B | 1.564(14) |
| C(5)–C(6) | 1.498(7) | C(19)–C(20) | 1.559(17) |
| N(2)–C(7) | 1.506(6) | C(20)–C(21) | 1.535(13) |
| N(2)–C(16) | 1.508(6) | C(21)–C(20)B | 1.505(16) |
| N(2)–C(13) | 1.513(6) | C(22)–C(23) | 1.51(2) |
| N(2)–C(10) | 1.529(6) | C(23)–C(24) | 1.55(2) |
| C(7)–C(8) | 1.505(7) | C(24)–C(23)B | 1.526(16) |
| C(8)–C(9) | 1.507(9) | C(19)B–C(20)B | 1.500(19) |
| C(10)–C(11) | 1.496(7) | C(22)B–C(23)B | 1.48(2) |
| Atom1–atom2–atom3 | Angle (°) | Atom1–atom2–atom3 | Angle (°) |
|---|---|---|---|
| Br(4)–Co(1)–Br(3) | 108.83(4) | C(22)B–N(3)–C(22)B | 86.8(10) |
| Br(4)–Co(1)–Br(2) | 106.66(4) | C(19)B–C(19)–C(20)B | 89.4(15 |
| Br(3)–Co(1)–Br(2) | 109.64(4) | C(19)B–C(19)–N(3) | 75.6(12) |
| Br(4)–Co(1)–Br(1) | 109.27(4) | C(20)B–C(19)–N(3) | 141.7(11) |
| Br(3)–Co(1)–Br(1) | 109.83(3) | C(20)B–C(19)–C(20) | 46.1(8) |
| Br(2)–Co(1)–Br(1) | 112.51(3) | N(3)–C(19)–C(20) | 113.6(9) |
| C(1)–N(1)–C(1) | 107.5(5) | C(19)B–C(19)–C(22) | 117.8(14) |
| C(1)–N(1)–C(4) | 110.4(3) | C(20)B–C(19)–C(22) | 151.8(12) |
| C(1)–N(1)–C(4) | 110.6(3) | N(3)–C(19)–C(22) | 49.9(5) |
| C(1)–N(1)–C(4) | 110.6(3) | C(20)–C(19)–C(22) | 161.3(10) |
| C(1)–N(1)–C(4) | 110.4(3) | C(19)B–C(20)–C(20)B | 84.3(13) |
| C(4)–N(1)–C(4) | 107.4(5) | C(19)B–C(20)–C(21) | 134.5(13 |
| C(2)–C(1)–N(1) | 116.3(4) | C(20)B–C(20)–C(21) | 66.7(10) |
| C(1)–C(2)–C(3) | 110.7(5) | C(20)B–C(20)–C(19) | 51.2(9) |
| C(5)–C(4)–N(1) | 116.3(4) | C(21)–C(20)–C(19) | 107.3(9) |
| C(6)–C(5)–C(4) | 110.0(5) | C(22)B–C(22)–C(23)B | 88.7(16 |
| C(7)–N(2)–C(16) | 108.9(4) | C(23)B–C(22)–C(23) | 52.4(10) |
| C(7)–N(2)–C(13) | 109.5(3) | C(22)B–C(22)–N(3) | 76.2(14) |
| C(16 N(2)–C(13) | 111.3(4) | C(23)B–C(22)–N(3) | 146.2(13) |
| C(7)–N(2)–C(10) | 110.8(4) | C(23)–C(22)–N(3) | 114.9(13) |
| C(16)–N(2)–C(10) | 108.6(4) | C(22)B–C(22)–C(19) | 120.4(16) |
| C(13)–N(2)–C(10) | 107.8(3) | C(23)B–C(22)–C(19) | 150.4(14) |
| C(8)–C(7)–N(2) | 115.9(4) | C(23)–C(22)–C(19) | 156.9(13) |
| C(7)–C(8)–C(9) | 110.7(5) | N(3)–C(22)–C(19) | 50.2(5) |
| C(11)–C(10)–N(2) | 116.6(4) | C(22)B–C(23)–C(23)B | 82.4(18) |
| C(10)–C(11)–C(12) | 111.3(5) | C(23)B–C(23)–C(22) | 51.0(11) |
| C(13)–C(14)–C(15) | 110.0(5) | C(22)B–C(23)–C(24) | 144(2) |
| C(17)–C(16)–N(2) | 117.4(4) | C(23)B–C(23)–C(24) | 65.4(12) |
| C(16)–C(17)–C(18) | 110.7(5) | C(22)–C(23)–C(24) | 109.9(14) |
| C(22)–N(3)–C(22) | 138.0(11) | C(23)B–C(24)–C(23) | 47.3(8) |
| C(22)–N(3)–C(19) | 79.9(7) | C(19)–C(19)B–C(20) | 103.1(16) |
| C(22)–N(3)–C(19) | 116.3(6) | C(19)–C(19)B–C(20)B | 54.7(12) |
| C(22)–N(3)–C(19) | 116.3(6) | C(20)–C(19)B–C(20)B | 48.7(9) |
| C(22)–N(3)–C(19) | 79.9(7) | C(19)–C(19)B–N(3) | 71.3(12) |
| C(19)–N(3)–C(19) | 136.3(10) | C(20)–C(19)B–N(3) | 150.9(13) |
| C(22)–N(3)–C(19)B | 107.9(7) | C(20)B–C(19)B–N(3) | 116.3(11) |
| C(22)–N(3)–C(19)B | 103.4(7) | C(20)–C(20)B–C(19) | 82.7(13) |
| C(19)–N(3)–C(19)B | 106.2(8) | C(20)–C(20)B–C(19)B | 47.1(9) |
| C(22)–N(3)–C(19)B | 103.4(7) | C(20)–C(20)B–C(21) | 69.5(11) |
| C(22)–N(3)–C(19)B | 107.9(7) | C(19)–C(20)B–C(21) | 131.6(13) |
| C(19)–N(3)–C(19)B | 106.2(8) | C(19)B–C(20)B–C(21) | 108.5(1) |
| C(19)B–N(3)–C(19)B | 82.6(10) | C(22)–C(22)B–C(23) | 107(2) |
| C(22)–N(3)–C(22)B | 108.3(8) | C(22)–C(22)B–C(23)B | 54.6(12) |
| C(19)–N(3)–C(22)B | 102.1(6) | C(23)–C(22)B–C(23)B | 55.6(13) |
| C(19)–N(3)–C(22)B | 109.3(6) | C(22)–C(22)B–N(3) | 70.4(13) |
| C(19)B–N(3)–C(22)B | 108.7(6) | C(23)–C(22)B–N(3) | 170.0(17) |
| C(19)B–N(3)–C(22)B | 140.5(7) | C(23)B–C(22)B–N(3) | 117.9(11) |
| C(22)–N(3)–C(22)B | 108.3(8) | C(22)–C(23)B–C(23) | 76.6(14) |
| C(19)–N(3)–C(22)B | 109.3(6) | C(22)–C(23)B–C(24) | 132.8(14) |
| C(19)–N(3)–C(22)B | 102.1(6) | C(23)–C(23)B–C(24) | 67.4(13) |
| C(19)B–N(3)–C(22)B | 140.5(7) | C(22)B–C(23)B–C(24) | 107.8(11) |
| C(19)B–N(3)–C(22)B | 108.7(6) |
The organic cations can adopt various geometries. The [(C3H7)4N(1)]+ cation has a cross-shaped conformation. The N–C and C–C bond lengths vary from 1.514(5) to 1.518(5) Å and from 1.498(7) to 1.517(7) Å, respectively. The C–N–C, C–C–N and C–C–C angles are in the range of 110.4(3)–110.6(3)°, 116.3(4)° and 110.0(5)–110.7(5)°, respectively. The [(C3H7)4 N(2)]+ cation presents a broken cross-shaped conformation. For the second geometry, the N–C bond lengths vary from 1.506(6) to 1.529(6) Å. The C–C bond lengths vary from 1.471(8) to 1.537(8) Å. The C–N–C, N–C–C and C–C–C angles are in the range of 107.8(3)–111.3(4)°, 115.9(4)–117.4(4)° and 110.0(5)–111.3(5)°, respectively. For the third geometry, [(C3H7)4N(3)]+, the N–C and C–C bond lengths vary from 1.517(13) to 1.564(14) Å and from 1.48(2) to 1.559(17) Å, respectively. The C–N–C, N–C–C and C–C–C angles are in the range of 79.9(7)–140.5(7)°, 49.9(5)–170.0(17)° and 47.1(9)–156.9(13)°, respectively. These interatomic distances and angles are in good agreement with those observed previously in the cationic part of [(C3H7)4N]2CoCl4,15 [(C3H7)4N]2Cu2Br6 (ref. 22) and [(C3H7)4N]2MnCl4.23
3.2. X-ray powder diffraction analysis
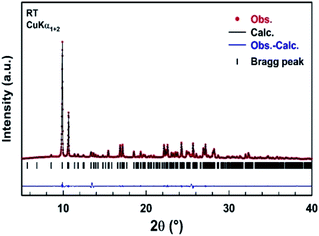
A part of the blue crystals thus formed has been crushed in order to check the sample homogeneity by recording X-ray powder diffraction pattern at room temperature. A refinement of the XRPD pattern collected at room temperature was carried out by the Le Bail method using the monoclinic cell parameters and the C2/c (n° 15) space group. Fig. 4 shows the observed, calculated, and difference diffraction patterns for [TPA]2CoBr4. All Bragg peaks were successfully indexed and satisfactorily modeled, thus confirming the high purity of the sample. The conventional reliability factors of the refinement are Rp = 8.04%, Rωp = 9.55%, Rexp = 2.43%. The monoclinic cell parameters, a = 33.163(2) Å, b = 14.2356(9) Å, c = 15.0890(9) Å and β = 110.314(3)°, are in good agreement with those determined from XRD data collected on a single crystal of [TPA]2CoBr4.3.3. Differential scanning calorimetric studies
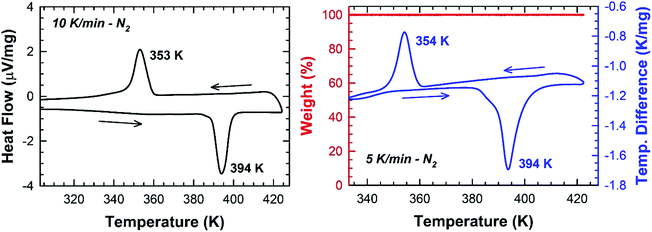
In Fig. 5, one endothermic and one exothermic peak are observed in the DSC curve at 394 and 354 K on heating up and cooling down the sample at 10 K min−1, respectively. A thermogravimetric analysis was carried out to probe the thermal stability of the sample. As shown in Fig. 5, no weight loss is measured in the temperature range 300–423 K. Since no thermal decomposition of the sample occurs up to 423 K, the [TPA]2CoBr4 compound therefore exhibits a reversible structural phase transition.The enthalpy and the entropy variations of the transition are 2.41 kJ mol−1 and 6.11 J mol−1 K−1 respectively. The type of phase transition can be deduced by the Boltzmann function:
ΔS = kB![[thin space (1/6-em)]](https://www.rsc.org/images/entities/char_2009.gif) ln(Ω) ln(Ω)
| (1) |
 . The obtained value of Ω is greater than 2 indicating that the phase transition can be classified as an order–disorder type.24
3.4. Vibrational spectroscopy
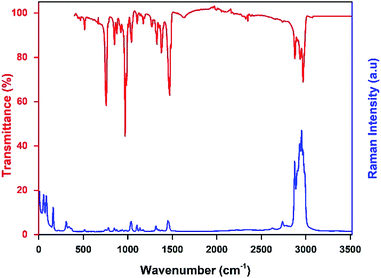
The infrared and the Raman spectra of the [TPA]2CoBr4 were recorded at room temperature and shown in Fig. 6. The assignment of the internal vibrations modes is based on a comparison with other spectra of homologous compounds.23,25The main intensity bands observed in the low wavenumbers region are attributed to the four fundamental vibrational modes of [CoBr4]2−anion. The bands at 55 cm−1 and 85 cm−1 are thus respectively assigned to the symmetric (ν2) and asymmetric (ν4) Br–Co–Br bending modes. The symmetric (ν1) and asymmetric (ν3) Co–Br stretching modes are observed at 161 and 308 cm−1, respectively.
The bands corresponding to the vibrational modes of the cationic groups are observed at higher wavenumbers. The bands observed between 2800 and 3100 cm−1 are commonly assigned to the symmetric and asymmetric vibration of CH2 and CH3 groups.26 The symmetric and asymmetric CH3 stretching modes are attributed to the IR bands observed at 2903 and 2970 cm−1 (2969 cm−1 in Raman spectrum) respectively and the symmetric and asymmetric CH2 stretching modes are attributed to the IR bands located at 2878 cm−1 (2875 cm−1 in Raman spectrum) and 2936 cm−1 (2932 cm−1 in Raman spectrum), respectively.
The intense IR bands located in the 1420–1500 cm−1 region are likely assigned to CH2 scissoring modes, and the IR band at 1379 cm−1 to the CH3 bending mode. The stretching (C–C–C) mode appears between 1015 and 1050 cm−1 in both Raman and IR spectra and the IR bands located in the 950–100 cm−1 region are attributed to the deformation δ(C–N–C) and δ(C–C–C) modes. Finally, the intense infrared bands centered at 758 cm−1 are mainly attributed to ν1(NC4) modes of the [(C3H7)4N]+cation (Fig. 7).
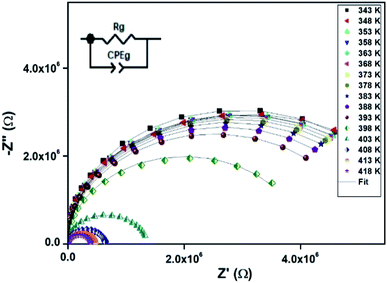 | ||
| Fig. 7 Nyquist representation of observed complex impedance spectra (dots) collected on a dense pellet of the [TPA]2CoBr4 compound. | ||
3.5. Impedance analysis
The electrical properties were studied by the non-destructive complex impedance method. Fig. 6 shows the Nyquist diagrams (−Z′′ versus Z′) of the [TPA]2CoBr4 compound at different temperatures (343–418 K).All impedance spectra show some dispersion instead of a semicircle centered on the real axis, indicating a non-Debye (Cole–Cole) type relaxation.27,28 As the temperature increases, the radius of the semicircle and the associated grain resistance value progressively decrease, confirming the negative temperature coefficient of resistance (NTCR) and a signature of the semiconductor character.29 The best fit using Zview software (black solid line in Fig. 6) was obtained using an equivalent circuit formed by a parallel combination of bulk resistance Rg and fractal capacity CPEg.
Fits are performed by using Z-view2 software30 (black solid line in Fig. 6). The impedance of the constant phase element (ZCPE) is determined from the formula:31
 | (2) |
The real Z′ and imaginary Z′′ parts of impedance of the equivalent circuit were fitted using the following formula:31
 | (3) |
 | (4) |
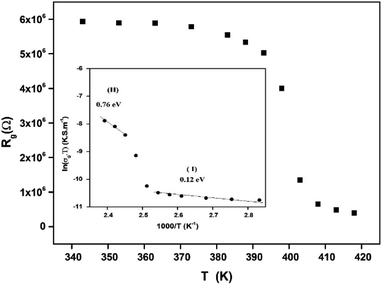
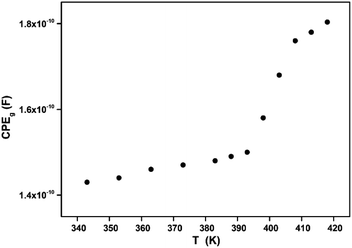
The extracted parameters of the equivalent circuit elements (R, Q and n) are summarized in Table 5. According to the calculated capacitance value the semicircle can be therefore assigned to the response of grains. Fig. 8 and 9 show the variation of the obtained values of Rg and CPEg with temperature respectively. The grain resistance (Rg) slightly decreases upon heating until T = 394 K before it drops sharply at the transition temperature. This decrease in the resistive property with increasing the temperature indicating the existence of activated conduction mechanism. The obtained values of bulk resistance (Rg), corresponding to the grain, are used to determine the electrical conductivity σg as follows:31
 | (5) |
 | (6) |
| T (K) | Rg (106 Ω) | CPEg (10−10 F) | Exponent n |
|---|---|---|---|
| 343 | 6.14 | 1.41 | 0.99 |
| 348 | 5.96 | 1.42 | 0.99 |
| 353 | 5.91 | 1.43 | 0.99 |
| 358 | 5.90 | 1.43 | 0.98 |
| 363 | 5.88 | 1.46 | 0.97 |
| 368 | 5.83 | 1.46 | 0.997 |
| 373 | 5.77 | 1.47 | 0.96 |
| 378 | 5.68 | 1.47 | 0.94 |
| 383 | 5.54 | 1.48 | 0.96 |
| 388 | 5.33 | 1.49 | 0.97 |
| 393 | 5.02 | 1.50 | 0.95 |
| 398 | 4.01 | 1.58 | 0.99 |
| 403 | 1.34 | 1.68 | 0.99 |
| 408 | 0.64 | 1.76 | 0.98 |
| 413 | 0.48 | 1.78 | 0.98 |
| 418 | 0.39 | 1.80 | 0.97 |
In Fig. 9, one can note that the capacitance CPEg suddenly increases at the structural phase transition (T = 394 K). Moreover, such variation can be related to an ionization process beyond transition temperature which decreases the resistance (by increasing the density and the mobility of free charge carriers) and increases the capacitance (by increasing the space charge).
Fig. 10 displays the variation of the real part (Z′) of the impedance with frequency at different temperatures. At low frequencies, Z′ is independent of temperature until 394 K. Then it is observed that beyond 394 K, the value of Z′ decreases on increasing temperature, which can be explained by the reduction of trapped charge density and a thermal activation of their mobility.33 As frequency increases, the real impedance Z′ increases until a specific frequency for each temperature. Besides, the values of Z′ merge at high frequencies (>104 Hz). This can be understood by the fact that charge carriers acquired sufficient energy to overcome the potential barrier.34,35
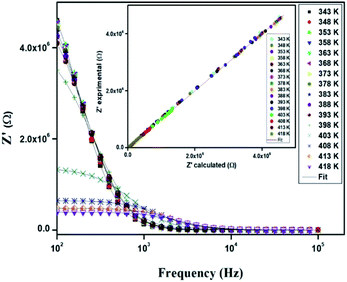 | ||
| Fig. 10 Variation of the real part (Z′) of impedance as a function of the frequency for different temperatures. | ||
The variation of the imaginary part (Z′′) as the function of frequency for different temperatures is shown in Fig. 11. Let us note that the plot below 394 K is slightly increased with increasing temperature. However, the frequency (fmax), at which the imaginary value Z′′ has the highest value (Z′′max), shifts to high frequencies as the temperature increases above 394 K, thus confirming the occurrence of non-Debye relaxation type.36 Further, we notice a peak broadening with decreasing of the value of Z′′max which suggests an increasing loss in the resistive properties of the sample.37 The relaxation peak shifts to high frequency regions indicating the accumulation of space charge in the material.38
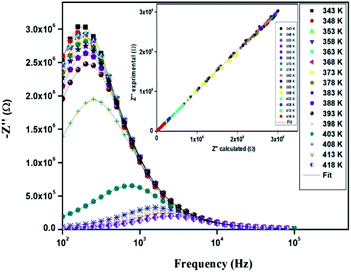 | ||
| Fig. 11 Variation of the imaginary part (Z′′) of impedance as a function of the frequency for different temperatures. | ||
In order to compare the experimental and theoretical results (using an equivalent circuit), the experimental data of Z′ and Z′′ versus the simulated ones were also plotted in Fig. 10 and 11. The straight lines, with a slope equal to the unity, prove the very good agreement between the experimental and theoretical data. This behavior confirms moreover that the modeled equivalent circuit describes well the electric properties of our compound.39
3.6. Electric modulus analysis
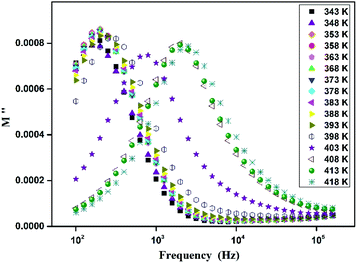
The analyses of the electrical modulus provide an insight about the electrode polarization and relaxation times of the conductivity.40 The complex electric modulus M* is represented by:
 | (7) |
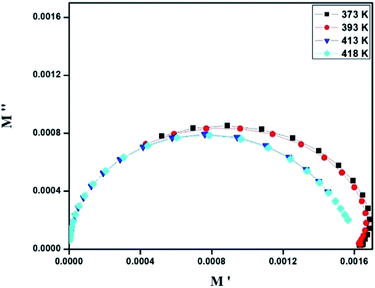
Fig. 14 shows the variation of the imaginary part of electric modulus M′′ and the imaginary part of impedance Z′′ as the frequency F increases at 403 K. In this figure, both curves exhibit a maximum at the same frequency value. This superimposition is characteristic of a long range electronic conductivity within grains45 which is responsible for the high-temperature dielectric relaxation observed.46,47
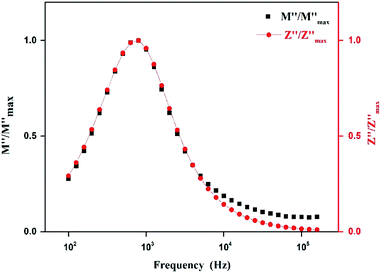 | ||
| Fig. 14 Logarithmic plot of normalized parameters (M′′, Z′′) of [TPA]2CoBr4 measured at selected temperature. | ||
3.7. Ac conductivity
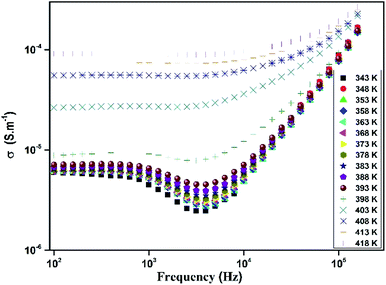
The variation of total conductivity σ for [TPA]2CoBr4 versus frequencies at different temperatures is shown in Fig. 15. At low frequencies, the spectrum exhibits a plateau region (independent of frequency) which is related to the direct current conductivity σdc. On further increase of temperature (above 394 K), an increase of conductivity is established in the graph indicating that electrical conductivity is thermally activated. This behavior suggests the semiconductor nature of this compound. Below the phase transition temperature 394 K, charge carriers are emitted in grains and are blocked at grain boundaries. The conductivity decreases with frequency and reaches a minimum until a frequency fhop at which charge carriers can hop over grain boundary barrier. Above 394 K charge carriers have enough thermal energy to avoid accumulation at grain boundaries. It is also observed a decay of this phenomenon with an increase of temperature (above 394 K). Beyond fhop, the conductivity increases with an increase of frequency, which is related to the alternative current conductivity σac. Then at low frequency, the conductivity merges with direct current one σdc and at high frequency, it follows the Jonscher's law expressed by:48| σ = A1ωs | (8) |
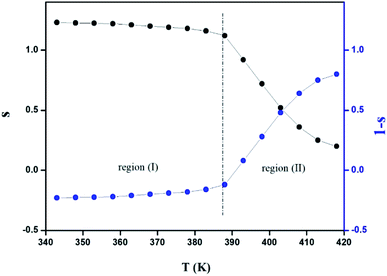
The variation of the high frequency exponent ‘s’ (Fig. 16) allows to determine the conduction mechanism subjected to an alternating voltage.49 The plot of the exponent ‘s’ shows two distinct regions; below 394 K, a plateau region (independent of temperature) is observed indicating the quantum mechanical tunneling (QMT) model (region I).50 Then the exponent ‘s’ decreases with an increase of temperature. This behavior is a signature of the correlated barrier hopping model (CBH) of the electrical transport51 (region II). The value of the potential barrier WM is deduced from the linear fit of the curve (1 − s) versus temperature (Fig. 17) using the following equation:
 | (9) |
 | (10) |
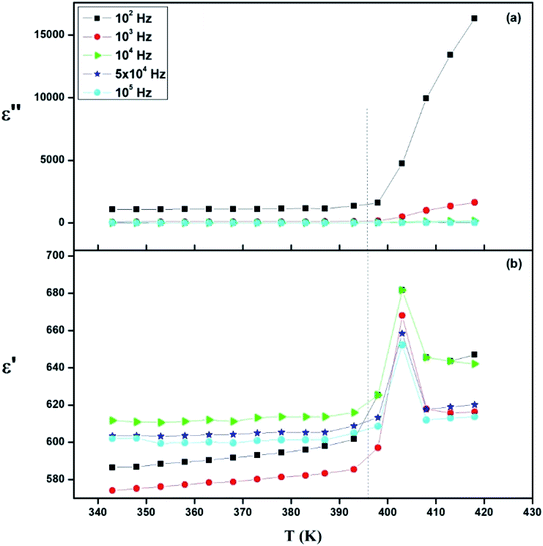 | ||
| Fig. 17 Thermal evolution of (a) relative permittivity (ε′) and (b) dielectric loss (ε′′) at different frequencies. | ||
The obtained value of WM is 0.25 eV.
3.8. Dielectric measurement
The dielectric measurement is a powerful characterization technique to obtain information about conduction behavior and to determine the origin of dielectric loss and dipolar relaxation time.53Fig. 17 presents the temperature dependence plots of the real ε′ and ε′′ imaginary part of the complex dielectric response ε* of the [TPA]2CoBr4 compound at selected frequencies. Such variation indicates that the compound undergoes a phase transition at the same temperature as that deduced from thermal and electrical analyses. It is clearly observed that the dielectric parameters (both of the ε′ and ε′′) below 394 K are independent of temperature. Beyond 394 K, ε′ and ε′′ increase as the temperature rises until T = 403 K. This behavior can be explained by orientational polarization where dipoles align themselves along the electric field direction and fully contribute to the total polarization.54–56 Also, the variation of ε′ shows a peak at a critical transition temperature Tc = 403 K. As the temperature increases, the dipoles follow the variation of the field which becomes too rapid so the real value of ε′ decreases.57,58 Furthermore, there is no displacement of the dielectric maximum with the increase in frequency, thus confirming that the dielectric constant has a classical thermal evolution.59,60
4. Conclusion
In this work, a new [TPA]2CoBr4 compound, with a monoclinic symmetry and C2/c space group, was prepared and its optical, thermal, electrical and dielectric properties are investigated as a function of temperature and frequency. One reversible structural phase transition at T = 394 K is detected from thermal and electrical analyses. The Nyquist plot reveals the presence of grain contributions and allowed determining an equivalent circuit formed by a single R//CPE. The variation of the extracted parameters values Rg and CPEg confirms the existence of a structural phase transition at T = 394 K. The analysis of electrical modulus confirms the presence of phase transition and shows the non-Debye relaxation process. The ac conductivity has been studied as a function of temperature at different temperature. It confirms the presence of the phase transition deduced by the DSC analysis. The variation of the frequency exponent s with temperature confirms that the correlated barrier hopping is the dominant transport mechanism at high temperature in this compound. Modulus and capacitance analyses prove the high effective permittivity at radio frequencies in the sample. The dielectric analysis shows a high maximum of ∼680 and also confirms that the compound undergoes a phase transition at the same temperature as that deduced from thermal and electrical analyses.Conflicts of interest
All authors have no conflicts of interest.References
- K. E. Lee, N. Morad, T. T. Teng and B. T. Poh, Chem. Eng. Sci., 2012, 203, 370–386 CrossRef CAS.
- F. Garnier, Chem. Phys., 1998, 227, 253–262 CrossRef CAS.
- A. Gagor, M. Wojtas, A. Pietraszko and R. Jakubas, Acta Crystallogr., Sect. B: Struct. Sci., 2008, 64, 558–566 CrossRef CAS PubMed.
- M. W. Urban, Handbook of Stimuli Responsive Materials 2011 Search PubMed.
- M. A. Stuart, W. T. Huck, J. Genzer, M. Müller, C. Ober, M. Stamm, G. B. Sukhorukov, I. Szleifer, V. V. Tsukruk, M. Urban and F. Winnik, Nat. Mater., 2010, 9, 101–113 CrossRef PubMed.
- S. Horike, S. Shimomura and S. Kitagawa, Nat. Chem., 2009, 9, 695–704 CrossRef PubMed.
- S. Horiuchi and Y. Tokura, Nat. Mater., 2008, 7, 357–366 CrossRef CAS PubMed.
- O. Sato, J. Tao and Y. Z. Zhang, Angew. Chem., Int. Ed., 2007, 46, 2152–2157 CrossRef CAS PubMed.
- Z. H. Sun, J. H. Luo, T. L. Chen, L. N. Li, R. G. Xiong, M. L. Tong and M. C. Hong, Adv. Funct. Mater., 2012, 22, 4855–4861 CrossRef CAS.
- G. Amirthaganesan, M. A. Kandaswamy and M. Dhandapani, Mater. Chem. Phys., 2008, 110, 328–331 CrossRef CAS.
- K. Karoui, A. Ben Rhaiem, F. Hlel, M. Arous and K. Guidara, Mater. Chem. Phys., 2012, 133, 1–7 CrossRef CAS.
- eslati, I. Chaabane and F. Hlel, Vib. Spectrosc., 2014, 73, 116–126 CrossRef.
- K. Ben Brahim, M. Ben gzaiel, A. Oueslati, F. Hlel and M. Gargouri, Mater. Res. Bull., 2019, 118, 110505 CrossRef CAS.
- M. Asplund and S. Jagner, Acta Chem. Scand., Ser. A, 1984, 38, 411–414 CrossRef.
- N. Moutia, A. Oueslati, M. Ben Gzaiel and K. Khirouni, Physica E, 2016, 83, 88–94 CrossRef CAS.
- R. Lim, AIP Adv., 2016, 6, 035307 CrossRef.
- I. Chaabane, F. Hlel, K. Guidara and M. Gargouri, J. Alloys Compd., 2008, 461, 495–500 CrossRef CAS.
- H. A. Jahn and E. Teller, Stat. Proc. Roy. Soc, 1937, 161, 220–235 CAS.
- R. Megha, S. Kotresh, Y. T. Ravikiran, C. V. Ramana, S. C. Vijaya Kumari and S. Thomas, Compos. Interfaces, 2017, 24, 55–68 CrossRef CAS.
- M. Naveed, M. Mumtaz, R. Khan, A. A. Khan and M. N. Khan, J. Alloys Compd., 2017, 712, 696–703 CrossRef CAS.
- H. Tllili, S. Walha, S. Elleuch, B. F. Ali and H. Naïli, J. Mol. Struct., 2018, 1152, 303–310 CrossRef CAS.
- A. Oueslati and M. Gargouri, J. Alloys Compd., 2017, 739, 1089–1096 CrossRef.
- M. B. Gzaiel, A. Oueslati, F. Hlel and M. Gargouri, Physica E, 2016, 83, 405–413 CrossRef.
- W. Trigui, A. Oueslati, I. Chaabane, G. Corbel and F. Hlel, Appl. Phys. A, 2015, 119, 673–680 CrossRef CAS.
- N. Moutia, M. Ben Gzaiel, A. Oueslati and K. Khirouni, J. Mol. Struct., 2017, 1134, 697–705 CrossRef CAS.
- J.-F. Bardeau, A. N. Parikh, J. D. Beers and B. I. Swanson, J. Phys. Chem. B, 2000, 104, 627–635 CrossRef CAS.
- K. S. Cole and R. H. Cole, J. Chem. Phys., 1941, 9, 341–351 CrossRef CAS.
- H. Ferjani, H. Boughzala and A. Driss, J. Crystallogr., 2013, 2013, 1–8 Search PubMed.
- L. H. Omari, R. Moubah, A. Boutahar, L. Hajji and R. El Ouatib, J. Electroceram., 2020, 44, 23–31 CrossRef CAS.
- D. Johnson, A High Measurement Channel Density Impedance Array Analyser: Instrumentation and Implementation Approaches, Scribner Associates Inc, 150 E. Connecticut Avenue, Southern Pines, NC, USA., 2010, vol. 25, pp. 35–48 Search PubMed.
- M. Hamdi, A. Oueslati, I. Chaabane and F. Hlel, Int. Scholarly Res. Not., 2012, 1–8 Search PubMed.
- F. Rehman, Li. Jing-Bo, J. S. Zhang, M. Rizwan, C. Niu and H. B. Jin, J. Appl. Phys., 2015, 118, 214101–214106 CrossRef.
- K. Omri, R. Lahouli and L. El Mir, Results Phys., 2019, 12, 2141–2145 CrossRef.
- M. J. Miah and A. K. M. Akther Hossain, Acta Mater., 2016, 29, 505–517 CAS.
- V. Purohit, R. Padhee and R. N. P. Choudhary, Ceram. Int., 2018, 44, 3993–3999 CrossRef CAS.
- M. Ram, Solid State Sci., 2010, 12, 350–354 CrossRef CAS.
- P. Ganguly, A. K. Jha and K. L. Deori, Solid State Commun., 2008, 146, 472–477 CrossRef CAS.
- B. Behera, P. Nayak and R. N. P. Choudhary, J. Alloys Compd., 2007, 436, 226–232 CrossRef CAS.
- H. Nefzi, F. Sediri, H. Hamzaoui and N. Gharbi, Mater. Res. Bull., 2013, 48, 1978–1983 CrossRef CAS.
- P. S. Anantha and K. Hariharan, Mater. Sci. Eng., B, 2005, 121, 12–19 CrossRef.
- K. Sundaramahalingam, D. Vanitha, N. Nallamuthu, A. Manikandan and M. Muthuvinayagam, Phys. Rev. B: Condens. Matter, 2019, 553, 120–126 CrossRef CAS.
- R. Gajula, L. R. Buddiga, K. C. Kumar and M. Dasari, Results Phys., 2020, 17, 103076 CrossRef.
- S. Mohanta, I. Naik, S. D. Kaushik, S. Mukherjee and P. Patra, J. Electron. Mater., 2019, 49, 842–847 CrossRef.
- Behera, N. K. Mohanty, B. Behera and P. Nayak, Adv. Tapis. Lett, 2013, 4, 141–145 CrossRef.
- D. C. Sinclair and A. R. West, J. Appl. Phys., 1989, 66, 3850–3856 CrossRef CAS.
- X. He, F. Han, M. Liu, Z. Yuan, X. Jiang, C. Hu, S. Ren, X. Lei and L. Liu, J. Electron. Mater., 2020, 49, 6643–6655 CrossRef CAS.
- S. I. R. Costa, M. Li, J. R. Frade and D. C. Sinclair, RSC Adv., 2013, 3, 7030–7036 RSC.
- A. K. Jonscher, Nature, 1974, 250, 191–193 CrossRef CAS.
- A. K. Jonscher, Nature, 1977, 267, 673–679 CrossRef CAS.
- Y. B. Taher, A. Oueslati, N. K. Maaloul, K. Khirouni and M. Gargouri, Appl. Phys. A, 2015, 120, 1537–1543 CrossRef.
- I. G. Austin and N. F. Mott, Adv. Phys., 1969, 18, 41–102 CrossRef CAS.
- S. R. Elliott, Philos. Mag. B, 1977, 36, 1291–1304 CrossRef CAS.
- S. Nasri, M. Megdiche and M. Gargouri, Phys. E, 2016, 16, 30191–30196 Search PubMed.
- R. Ayouchi, D. Leien, F. Martin, M. Gabas, E. Dalchiele and J. R. Ramos-Barrodo, Thin Solid Films, 2003, 426, 68–77 CrossRef CAS.
- V. Purohit, R. Padhee and R. N. P. Choudhary, Ceram. Int., 2018, 44, 3993–3999 CrossRef CAS.
- A. Ansari Sajid, N. Ambreen, F. Bushara, W. Khan, M. Chaman, A. Azam and A. H. Naqvi, Mater. Res. Bull., 2012, 47, 4161–4168 CrossRef.
- W. Trigui, A. Oueslati, I. Chaabane and F. Hlel, Ionics, 2014, 20, 231–241 CrossRef CAS.
- R. Lahouli, J. Massoudi, M. Smari, H. Rahmouni, K. Khirouni, E. Dhahrib and L. Bessaisd, RSC Adv., 2019, 9, 19949–19964 RSC.
- A. Salhi, S. E. Sayouri, B. Jaber and L. H. Omari, Appl. Phys. A, 2018, 124, 1–9 CrossRef CAS.
- L. H. Omari, L. Hajji, T. Lamhasni and C. Jama, Mater. Chem. Phys., 2018, 223, 60–67 CrossRef.
Footnote |
| † CCDC 2087968 and atomic coordinates anisotropic, displacement parameters, tables for all bond distances, and angles. For crystallographic data in CIF or other electronic format see DOI: 10.1039/d1ra07965d |
| This journal is © The Royal Society of Chemistry 2022 |


