 Open Access Article
The effect of particle size and mass ratio on the mechanical response of Al/PTFE/SiC composite with a 23 factorial design
Ruiqi Wang,
Junyi Huang,
Qiang Liu,
Shuangzhang Wu,
Jiaxiang Wu *,
Xinxin Ren
 and
Yuchun Li
 *
*
College of Field Engineering, Army Engineering University of PLA, Nanjing, 210007, China. E-mail: wujiaxiang1356@163.com; liyuchunmail@163.com
First published on 20th January 2022
Abstract
In order to study the effects of different SiC mass ratios, SiC particle sizes and Al particle sizes on the mechanical response of Al/PTFE/SiC, an experiment was conducted through the full 23 factorial design. The specimens were prepared by means of molding-vacuum sintering, while the mechanical response of the materials was measured through quasi-static compression. The regression models between failure stress, failure strain and various factors were established respectively and then verified through the analysis of variance (ANOVA) and residual analysis. Besides, the relationship between factors and response as well as that between factors were analyzed using response surface plots. According to the analytical results, the ultimate compressive strength of the material can be improved either by reducing the particle size of SiC and Al or increasing the mass ratio of SiC, while the ductility of the material can be enhanced by maintaining the interaction between SiC mass ratio and SiC particle size at high levels. The interaction effects are significant and can not be ignored, especially the interaction between SiC mass ratio and SiC particle size has an important impact on the mechanical responses, which shows that SiC has a greater influence than Al particles in the material system.
1 Introduction
Reactive materials, also known as impact-initiated energetic materials, are designed to release a large amount of energy under highly dynamic load.1,2 In various military settings, such materials are used to replace those components usually made out of inert materials, such as fragment warheads, shaped charge warheads, penetrating warheads and projectiles. In addition to kinetic energy attack and the physical damage caused to the target, reactive materials can also cause a comprehensive killing effect such as explosion shock, overpressure, and ignition.3 As for the development of reactive materials, it is in a shift to boosting the strength, density, and reaction energy while limiting the insensitivity of reactive materials.4As a representative reaction material, Al/PTFE has attracted widespread interest from researchers over the past decades, with some significant progress made in formulation, manufacturing and the characteristics of energy release.5–9 Due to the less desirable mechanical properties and lower density of Al/PTFE than traditional inert projectiles, however, there has now been much attention drawn to improving the mechanical properties of Al/PTFE through addition of different reinforcing particles. With the addition of W particles, as an inert component, PTFE/Al reactive material system can be applied to improve the strength and density of materials. In order to determine the effect of particle size on material density and ultimate compressive strength, Cai et al.10 carried out investigation into the quasi-static and high strain rate mechanical properties of composites consisting of Al, PTFE and W particles by testing the samples with different sizes of W particles. According to the investigative results, the porous composite containing fine W particles has a higher strength than the higher-density material containing coarse W particles. As suggested by Zhang et al.,11 with an increase in the mass ratio of W particles, the properties of Al/PTFE/W materials shifted from being elasto-plastic with significant hardening to being brittle with almost no hardening and the yield stress. In addition, Young's modulus was improved when the mass ratio of W reached a certain level. It was found out by Wang et al.12 that the increase of W mass ratio made no significant difference to the strength of Al/PTFE/W composites, despite the critical failure strain showing an obvious downward trend with the rise in W mass ratio. By comparing the Al/PTFE/W materials shaped by two different treatments, Xu et al.13 obtained the results indicating that under quasi-static compression, the sintered specimens with the same component ratios showed higher failure stress and greater fracture toughness than the pressed Al/PTFE/W reactive material specimens. In recent years, some studies have been conducted with other metals, metal oxides, or metal hydrides introduced into the Al/PTFE system. Integrating Ni (nickel) particles into Al/PTFE, Wu et al.14 explored the effect produced by different volume fraction of Ni on the mechanical properties of Al/PTFE/Ni. As suggested by the test results, the existence of Ni was conducive to increasing the strain-hardening modulus and compressive strength of the material. Zhou et al.15 carried out research on the mechanical property of Al/PTFE/CuO(copper oxide), which led to the finding that, the strength of the micro-sized PTFE/Al/CuO first increased and then decreased with an increase in the concentration of Al/CuO thermite. With ZrH2 introduced into Al/PTFE, Zhang et al.16 drew a conclusion that the gradation of particle size between Al and ZrH2 produced a more significant effect than particle size.
As a typical ceramic particle, SiC (silicon carbide) has been considered in metal matrix composites, especially in Al/SiC system.17–21 These achievements suggest the potential of SiC as reinforcing particles to develop the mechanical properties of materials. However, it is rare for prior studies to involve the modification made to Al/PTFE using ceramic particles. With Al/PTFE/SiC granular composites produced by mixing, cold isostatic pressing and vacuum sintering, Wu et al.22 conducted test on its mechanical properties to reach the conclusion that the addition of SiC can enhance the strength of Al/PTFE to a significant extent. Nonetheless, there remains a lack of understanding as to the effects of various factors on the mechanical response of Al/PTFE/SiC reactive materials, such as component ratio and particle size. In addition, the existing approaches to research on the mechanical properties of reactive materials are limited to single factor analysis, and it is difficult to ensure that their response is unaffected by the interaction effect for composites. Therefore, it is necessary to study the impact of various factors on mechanical response of Al/PTFE/SiC through experimentation. Currently, factorial design is widely adopted in experiments, involving several factors. As one of the promising methods used to build the empirical models relating response to factors, it is crucial to study the combined effect of the factors on the response.23–25
Based on what has been described above, the 23 factorial design was adopted in this study to figure out how the different factors (SiC mass ratios, SiC particle sizes and Al particle sizes) interact with each other and affect the mechanical response of Al/PTFE/SiC reactive materials, such as ultimate compressive strength and failure strain, with an mathematical model connecting factors and responses constructed. The results are expected to provide reference for the formulation optimization, mechanical property enhancement, and engineering applications of Al/PTFE/SiC reactive materials.
2 Experimental
2.1 Factorial design
The 23 (three-factor and two-level) factorial design was adopted to analyze the effects of SiC mass ratios and particle size on the mechanical properties of Al/PTFE/SiC under quasi-static compression. SiC mass ratios (A), SiC particle sizes (B), and Al particle sizes (C) were taken as the influencing factors, which varied at two different levels (low and high). Failure stress (S) and failure strain (P) were treated as responses. Given as few as two levels for each factor in a 23 factorial design, it was assumed that the responses are approximately linear over the range of the factor levels chosen.26 The linear hypothesis was satisfied as far as possible by a narrow range of factor levels chosen. Therefore, the mass ratio of SiC was set to 10 wt% (low) and 30 wt% (high) in this experiment, while that of Al and PTFE was fixed at the chemical equilibrium ratio (26%/74%). Additionally, the size of SiC particle was set to 7 μm (low) and 28 μm (high), while that of Al particle was set to 5 μm (low) and 20 μm (high). The factors and responses involved in the design are listed in Table 1.| Factors | Symbols | Unit | Type | Low level (−1) | High level (+1) |
|---|---|---|---|---|---|
| SiC mass ratio | A | wt% | Numeric | 10 | 30 |
| SiC particle size | B | μm | Numeric | 7 | 28 |
| Al particle size | C | μm | Numeric | 5 | 20 |
| Responses | Symbols | Unit | Analysis |
|---|---|---|---|
| Failure stress | S | MPa | Factorial |
| Failure strain | P | Factorial |
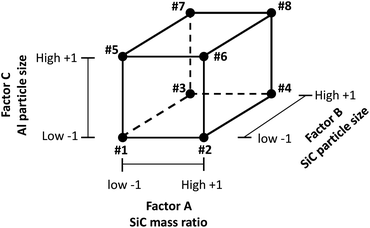
The model with 3 factors involves 8 different treatment combinations, which were denoted in the standard order as #1, #2, #3, #4, #5, #6, #7, and #8, as shown in Fig. 1. Notably, each corner of the cube corresponds to a set of factor levels, for which each corner corresponds to a treatment combination. For example, #1 represents the treatment combination where factors A, B, and C are all at the low level, while #8 represents the treatment combination where factors A, B, and C are all at the high level. There were five specimens prepared for each treatment combination, so as to reduce the error within treatments, with a total of forty specimens prepared.
The regression model for the full 23 factorial design is given as follows:
![[R with combining circumflex]](https://www.rsc.org/images/entities/i_char_0052_0302.gif) = β0 + β1x1 + β2x2 + β3x3 + β4x1x2 + β5x1x3 + β6x2x3 + β7x1x2x3 = β0 + β1x1 + β2x2 + β3x3 + β4x1x2 + β5x1x3 + β6x2x3 + β7x1x2x3
| (1) |
![[R with combining circumflex]](https://www.rsc.org/images/entities/i_char_0052_0302.gif) indicates the predicted response, β0 refers to the intercept, and βi denotes regression coefficients; x1, x2 and x3 refer to factor coded levels (i.e., +1 and −1); the cross-products x1x2, x1x3 and x2x3 represent the interaction between two factors while x1x2x3 indicates the interaction between all factors.
indicates the predicted response, β0 refers to the intercept, and βi denotes regression coefficients; x1, x2 and x3 refer to factor coded levels (i.e., +1 and −1); the cross-products x1x2, x1x3 and x2x3 represent the interaction between two factors while x1x2x3 indicates the interaction between all factors.
2.2 Material selection and sample preparation
2.3 Experimental procedures
Quasi-static compression tests of the eight types of specimens (40 in total) were conducted by a CMT5105 microcomputer-controlled electronic universal testing machine at 26 °C of the ambient temperature based on the standard GB/T 1041-2008. The load was applied at the speed of 6 mm min−1 corresponding to the nominal strain rate of 0.01 s−1. Before the tests, all contact surfaces of the specimens were lubricated with Vaseline to reduce the effect of friction.Engineering stress and engineering strain could be directly obtained during compression while the true stress and true strain needed to be calculated by the following formulas, which were based on the assumption of constant volume.
 | (2) |
3 Results and discussion
3.1 Quasi-static compression results
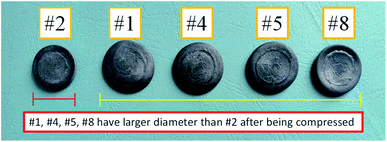
Fig. 3 shows the true stress–strain curves of 8 different treatment combinations for Al/PTFE/SiC specimens under quasi static pressure. For example, the curves 1–5 in (1) represent the five repeated experiments on treatment combination #1, while curves 6–10 in (2) represent the five repeated experiments on treatment #2, and so forth. It is worth noting that all specimens were made of elastic–plastic materials despite the treatment specimens showing different response curves. Under quasi-static compression, they first experienced a short linear elastic stage before reaching the yield point. Then, plastic deformation and strain hardening occurred. When the loading stress reached the material failure strength, the specimen was destroyed. Table 2 shows the response values for different treatments, with all measurement results expressed as mean ± standard deviation.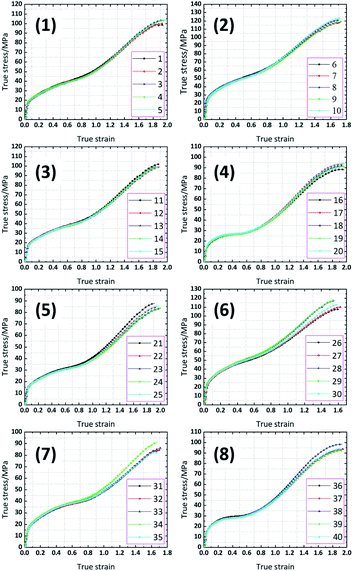 | ||
| Fig. 3 Stress–strain curves of 8 treatment combinations of Al/PTFE/SiC specimens under quasi static pressure. | ||
| Treatment | Factor A | Factor B | Factor C | Response S | Response P |
|---|---|---|---|---|---|
| SiC mass ratio (wt%) | SiC particle size (μm) | Al particle size (μm) | Failure stress (MPa) | Failure strain | |
| #1 | 10 (−1) | 7 (−1) | 5 (−1) | 101.971 ± 1.851 | 1.952 ± 0.0172 |
| #2 | 30 (+1) | 7 (−1) | 5 (−1) | 119.756 ± 2.033 | 1.710 ± 0.0126 |
| #3 | 10 (−1) | 28 (+1) | 5 (−1) | 99.683 ± 1.128 | 1.866 ± 0.0215 |
| #4 | 30 (+1) | 28 (+1) | 5 (−1) | 91.790 ± 1.914 | 1.956 ± 0.0174 |
| #5 | 10 (−1) | 7 (−1) | 20 (+1) | 84.966 ± 1.658 | 1.962 ± 0.0271 |
| #6 | 30 (+1) | 7 (−1) | 20 (+1) | 112.916 ± 3.816 | 1.590 ± 0.0303 |
| #7 | 10 (−1) | 28 (+1) | 20 (+1) | 85.805 ± 2.663 | 1.698 ± 0.0204 |
| #8 | 30 (+1) | 28 (+1) | 20 (+1) | 94.405 ± 2.076 | 1.936 ± 0.0102 |
3.2 Statistical analysis
| Ŝ = +98.91 + 5.81A − 5.99B − 4.39C − 5.63AB + 3.33AC + 1.57BC | (3) |
![[P with combining circumflex]](https://www.rsc.org/images/entities/i_char_0050_0302.gif) = +1.83 − 0.036A + 0.03B − 0.037C + 0.12AB + 0.035ABC = +1.83 − 0.036A + 0.03B − 0.037C + 0.12AB + 0.035ABC
| (4) |
![[P with combining circumflex]](https://www.rsc.org/images/entities/i_char_0050_0302.gif) are referred as predicted failure stress and predicted failure strain, respectively. A is SiC mass ratio; B is SiC particle size; C is Al particle size.
are referred as predicted failure stress and predicted failure strain, respectively. A is SiC mass ratio; B is SiC particle size; C is Al particle size.
| Source | Sum of squares | Mean square | F-Value | p-Value prob > F | |
|---|---|---|---|---|---|
| Model | 5364.23 | 894.04 | 127.66 | <0.0001 | Significant |
| A – SiC mass ratio | 1348.03 | 1348.03 | 192.49 | <0.0001 | |
| B – SiC particle size | 1435.53 | 1435.03 | 204.98 | <0.0001 | |
| C – Al particle size | 770.35 | 770.35 | 110.00 | <0.0001 | |
| AB | 1267.21 | 1267.21 | 180.95 | <0.0001 | |
| AC | 444.19 | 444.19 | 63.43 | <0.0001 | |
| BC | 98.93 | 98.93 | 14.13 | 0.0007 | |
| Residual | 231.1 | 7.00 | |||
| Cor total | 5595.34 | ||||
| R-Squared | 0.9587 | ||||
| Adj R-squared | 0.9512 | ||||
| Pred R-squared | 0.9393 |
| Source | Sum of squares | Mean square | F-Value | p-Value prob > F | |
|---|---|---|---|---|---|
| Model | 0.75 | 0.15 | 241.55 | <0.0001 | Significant |
| A – SiC mass ratio | 0.051 | 0.051 | 82.75 | <0.0001 | |
| B – SiC particle size | 0.037 | 0.037 | 59.25 | <0.0001 | |
| C – Al particle size | 0.056 | 0.056 | 89.84 | <0.0001 | |
| AB | 0.55 | 0.55 | 897.71 | <0.0001 | |
| ABC | 0.048 | 0.048 | 78.19 | <0.0001 | |
| Residual | 0.021 | 6.178 × 10⁻⁴ | |||
| Cor total | 0.77 | ||||
| R-Squared | 0.9726 | ||||
| Adj R-squared | 0.9686 | ||||
| Pred R-squared | 0.9621 |
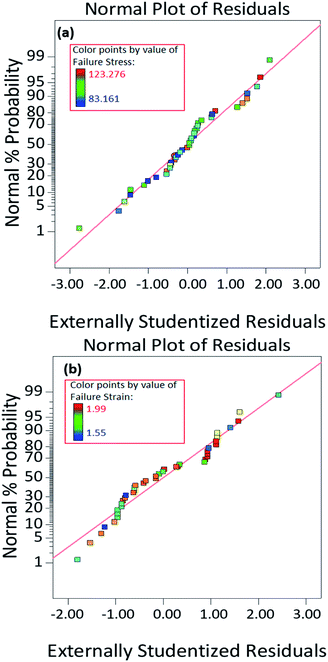
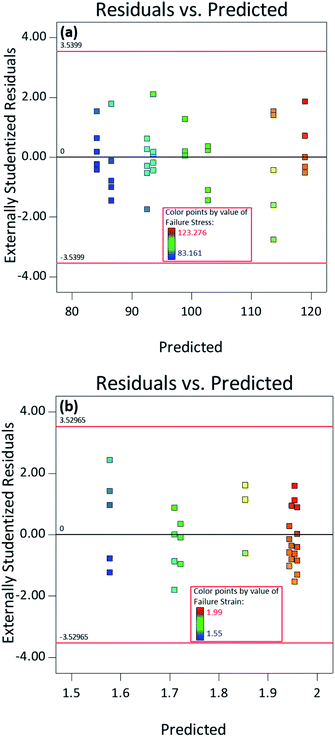
R-Squared, also known as the multiple correlation coefficient, is defined as the ratio between the variation caused by the regression and the total variation to express the proximity of the data to the fitted regression line. R-squared is 0.9587 in Table 3 and 0.9726 in Table 4, which means the selected effects can explain 95.87% of the variation in failure stress and 97.26% of the variation in failure strain respectively. Adj R-squared and pred R-squared are the variants of ordinary R-squared that can be used separately to explain the impact made by the number of effects on the model and the accuracy of model prediction response. To achieve “reasonable consistency”,26 adj R-squared and pred R-squared are supposed to be within about 0.20 of each other. In case of any inconsistence, it is possible for a problem to arise from the data or model. Adj R-squared = 0.9512, pred R-squared = 0.9393 in Table 3, adj R-squared = 0.9686, pred R-squared = 0.9621 in Table 4, and the difference between them is less than 0.2. That is to say, the experimental design model is capable of accurately describing the experimental data, suggesting the reliable relationship between effects and responses.
3.3 Main and interaction effects
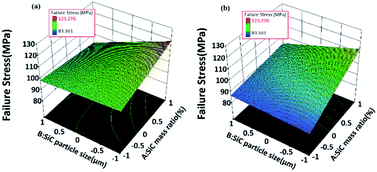
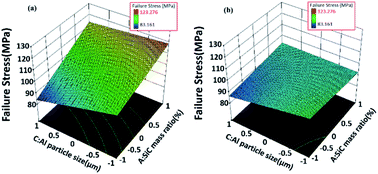
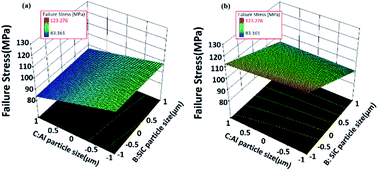
The interaction effect is the effect of one factor on the response as a function of other factors. The resulting model eqn (3) was applied to create three-dimensional plots to demonstrate the aforementioned interaction effects intuitively. Fig. 9–11 show various diagrams of different combinations of significant process parameters for failure stress. All of these graphs were created using color scales to show the changes in response with the modification of factors. The larger the response, the closer the color is to red. Conversely, the smaller the response, and the closer the color is to blue.
Fig. 9 shows the impact of SiC mass ratio (A) and SiC particle size (B) on failure stress (S) at a low or high level of Al particle size (C). Regardless of level C, the impact of A on failure stress is made more significant with the decrease of B, as is that of B with the increase of A. That is to say, the impact of SiC mass ratio on failure stress increases with the reduction in SiC particle size. The effect of SiC particle size shows an increasing trend with the rise of SiC mass ratio. When the SiC mass ratio increases to 30% (+1), the SiC particle size decreases to 7 μm (−1), while the failure stress reaches its maximum. Notably, as shown in (Fig. 9(a)), the failure stress increases with the rise of A when B stays low. When B is at high levels, the failure stress declines with the increase of A. According to (Fig. 9(b)), however, the failure stress shows an upward trend with the increase of A, which is irrelevant to the level of B. It means that the continued addition of strong particles will reduce the compressive strength of the material when the strong particles (SiC) have a large particle size and the gradation of particle size does not match. When the weak particles (Al) have a large size, the continued addition of strong particles will remain effective in improving the strength of the material even if the gradation of particle size does not match.
Fig. 10 shows how the SiC mass ratio (A) and Al particle size (C) impact on failure stress (S) at a low or high level of SiC particle size (B). When B is at a low level as shown in (Fig. 10(a)), the impact of C on failure stress increases with the decrease of A, while the effect of A is basically unaffected by C. In other words, the effect of Al particle size on failure stress is enhanced with the decrease of SiC mass ratio. The impact of SiC mass ratio on response is unaffected by the particle size of Al. When B is at a high level as shown in (Fig. 10(b)), there is barely any interaction occurring between A and C, suggesting that the effect of SiC mass fraction on failure stress is more significant than that of Al particle size. Especially when SiC has a small particle size, the greater the SiC mass fraction, the greater the failure stress.
Fig. 11 shows how the SiC particle size (B) and Al particle size (C) impact on failure stress (S) at a low or high level of SiC mass ratio (A). When A is at a low level as shown in (Fig. 11(a)), the impact of C on response is more significant than that of B. With the decline in C, the failure stress of the material rises. When A is at a high level, the impact of B is more significant than that of C. As B decreases, the level of material failure stress increases. It is suggested by the results that even strong particles have a less significant effect on compressive strength than weak particles at a lower mass ratio.
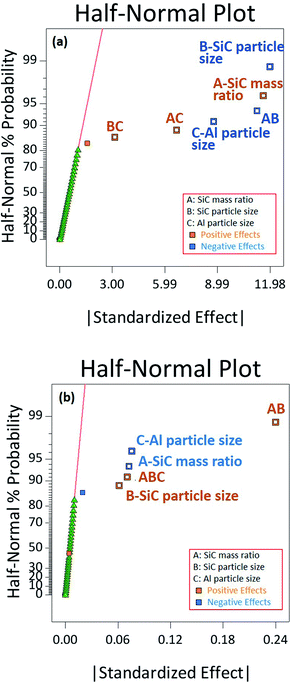
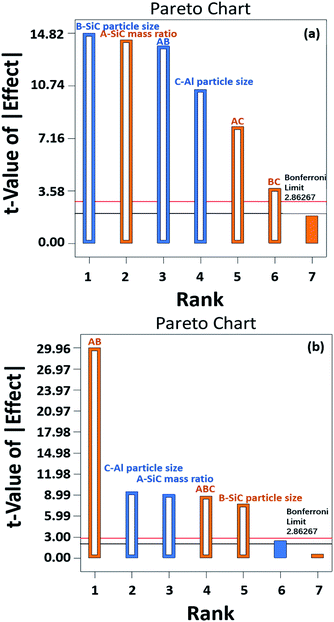
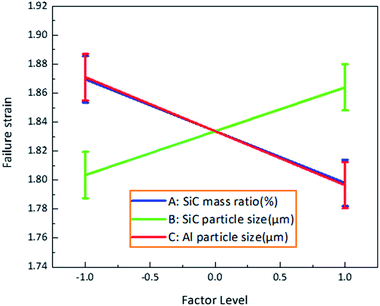
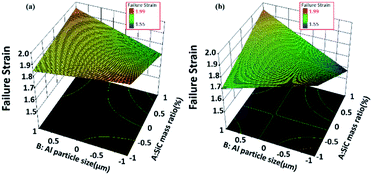
Although ABC interaction is also play a significant role in failure strain, usually, the third-order interaction is not insignificant in many cases. If it is of significance, this may be attributed to the strong interference from the second-order interaction, which is known as effect inheritance.26 For interaction ABC, the corresponding second-order interactions are AB, BC and AC, of which BC and AC are far less significant than the impact of ABC interaction, AB is far more significant than the impact of ABC interaction, while both ABC and AB exert positive effects. On this basis, it can be concluded that the significance of ABC is attributed to the significant impact of AB interaction. Similarly, the response surfaces plot of AB interaction effect was described using the model eqn (4), as shown in Fig. 14. It shows the impact of SiC mass ratio (A) and SiC particle size (B) on failure strain (P) at a low or high level of Al particle size (C). The response surface exhibits a large curvature, which suggests the significant interaction effect between A and B.
It is noteworthy that the relationship between A and P shows direct proportionality when the SiC particle size is at the higher level (B > 0), and that A is inversely proportional to P when B is at a lower level (B < 0). Therefore, the failure strain can reach its maximum only when A and B reach the maximum or minimum simultaneously.
Through comparison with (Fig. 14(a) and (b)), it can be discovered that there is no visible change in the areas with high AB interaction effect. That is to say, the materials with 10% SiC (7 μm) and 30% SiC (28 μm) are barely affected by Al particle size, while the materials with low AB interaction effect decrease significantly with the change in Al particle size. It is also suggested that the AB interaction effect is more significant than C although the main factors A (SiC mass ratio) and B (SiC particle size) have a less significant impact on the response P (failure strain) than C (Al particle size), which means SiC remains the particle with a strong influence on the response of failure strain.
4 Conclusions
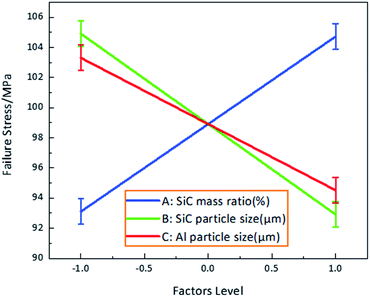
In this paper, an in-depth study was conducted on how the selected factors (SiC mass ratio; SiC particle size; Al particle size) would affect the mechanical response (failure stress and failure strain) of Al/PTFE/SiC. The regression equations between responses and factors under quasi-static pressure was obtained through a full 23 factorial design. The accuracy and applicability of the model were verified through the analysis of variance and residual analysis. Besides, the response surface plots were drawn to analyze the relationship between each factor and responses. The conclusions reached in this study are presented as follows:(1) As for the failure stress, the order of impact made by the main factors is: SiC particle size > SiC mass ratio > Al particle size. The ultimate compressive strength of the material can be improved either by reducing the particle size of SiC and Al or increasing the mass ratio of SiC.
(2) Regarding the failure strain, the impact of interaction between SiC mass ratio and SiC particle size exceeds the main effects. When the SiC mass ratio and SiC particle size reach the high level or low level simultaneously, the ductility of the material can be improved.
(3) The interaction between SiC mass ratio and SiC particle size plays a vitally important role in both mechanical responses. Therefore, SiC is the particle with a strong influence and Al is the particle a weak influence in the Al/PTFE/SiC material system.
Conflicts of interest
The authors declare that there is no conflict of interest regarding the publication of this paper.Acknowledgements
The financial support from the National Natural Science Foundation of China (General Program, Grant No. 51673213) is gratefully acknowledged.Notes and references
- F. Y. Xu, B. Q. Geng and X. P. Zhang, et al., Experimental study on behind-plate overpressure effect by reactive material projectile, Propellants, Explos., Pyrotech., 2016, 42, 192–197 CrossRef.
- H. F. Wang, H. Guo and B. Geng, et al., Application of PTFE/Al Reactive Materials for Double-Layered Liner Shaped Charge, Materials, 2019, 12, 2768 CrossRef CAS PubMed.
- M. Wei, Damage Effects of Energetic Fragment Warhead, Chin. J. Energ. Mater., 2011, 19(4), 450–453 Search PubMed.
- E. M. Hunt, et al., Impact ignition of nano and micron composite energetic materials, Int. J. Impact Eng., 2009, 36, 842–846 CrossRef.
- H. F. Wang and B. Q. Geng, et al., The effect of sintering and cooling process on geometry distortion and mechanical properties transition of PTFE/Al reactive materials, Def. Technol., 2020, 16, 720–730 CrossRef.
- F. Y. Xu and Y. F. Zheng, et al., Experimental study on penetration behavior of reactive material projectile impacting aluminum plate, Int. J. Impact Eng., 2016, 95, 125–132 CrossRef.
- X. Q. Xiang, W. H. Xiao and Q. Lei, Study on the Impacting Thermal Effects of PTFE/Al Energetic Materials, DEStech Transactions on Engineering and Technology Research, 2017, 1–6 Search PubMed.
- B. Feng, X. Fang and H. X. Wang, et al., The Effect of Crystallinity on Compressive Properties of Al-PTFE, Polymers, 2016, 8(10), 356 CrossRef PubMed.
- H. F. Wang, Y. F. Zheng and Q. Yu, et al., Impact-induced initiation and energy release behavior of reactive materials, J. Appl. Phys., 2011, 110(7), 239–245 Search PubMed.
- J. Cai, F. Jiang and K. S. Vecchio, Mechanical and microstructural properties of PTFE/Al/W system, AIP Conf. Proc., 2007, 955, 723 CAS.
- X. F. Zhang, J. Zhang and L. Qiao, et al., Experimental study of the compression properties of Al/W/PTFE granular composites under elevated strain rates, Mater. Sci. Eng., A, 2013, 581, 48–55 CrossRef CAS.
- L. Wang, J. Liu and S. Li, et al., Investigation on reaction energy, mechanical behavior and impact insensitivity of W-PTFE-Al composites with different W percentage, Mater. Des., 2016, 92, 397–404 CrossRef CAS.
- F. Y. Xu, S. B. Liu and Y. F. Zheng, et al., Quasi-Static Compression Properties and Failure of PTFE/Al/W Reactive Materials: Quasi-Static Compression Properties, Adv. Eng. Mater., 2016, 19(1), 1600350 CrossRef.
- J. X. Wu, H. X. Wang and X. Fang, et al., Investigation on the Thermal Behavior, Mechanical Properties and Reaction Characteristics of Al-PTFE Composites Enhanced by Ni Particle, Materials, 2018, 11(9), 1741 CrossRef PubMed.
- J. Zhou, L. Ding and W. Tang, et al., Experimental Study of Mechanical Properties and Impact-Induced Reaction Characteristics of PTFE/Al/CuO Reactive Materials, Materials, 2020, 13(1), 66 CrossRef CAS PubMed.
- J. Zhang, Y. C. Li and J. Y. Huang, et al., The effect of al particle size on thermal decomposition, mechanical strength and sensitivity of Al/ZrH2/PTFE composite, Def. Technol., 2021, 17, 829–835 CrossRef.
- M. Shaikh, T. Aziz and S. Arif, et al., Effect of sintering techniques on microstructural, mechanical and tribological properties of Al-SiC composites, Surf. Interfaces, 2020, 20, 100598 CrossRef CAS.
- A. F. Meselhy and M. M. Reda, Investigation of mechanical properties of nanostructured Al-SiC composite manufactured by accumulative roll bonding, J. Compos. Mater., 2019, 53, 3951–3961 CrossRef CAS.
- S. Huo, L. Xie and J. Xiang, et al., Atomic-level study on mechanical properties and strengthening mechanisms of Al/SiC nano-composites, Appl. Phys. A: Solids Surf., 2018, 124, 1–12 CrossRef.
- S. Sulaiman, Z. Marjom and M. Ismail, et al., Effect of Modifier on Mechanical Properties of Aluminium Silicon Carbide (Al-SiC) Composites, Procedia Eng., 2017, 184, 773–777 CrossRef CAS.
- P. R. Matli, U. Fareeha and R. A. Shakoor, et al., Fabrication and Mechanical Properties of Extruded Al-SiC Nanocomposites, Nano Hybrids and Composites, 2017, 16, 12–19 Search PubMed.
- J. X. Wu, J. Y. Huang and Q. Liu, et al., Influence of ceramic particles as additive on the mechanical response and reactive properties of Al/PTFE reactive composites, RSC Adv., 2020, 10, 1447–1455 RSC.
- C. Cai, H. Zhang and X. Zhong, et al., Ultrasound enhanced heterogeneous activation of peroxymonosulfate by a bimetallic Fe–Co/SBA-15 catalyst for the degradation of Orange II in water, J. Hazard. Mater., 2015, 283, 70–79 CrossRef CAS PubMed.
- M. Edrissi and R. Norouzbeigi, Synthesis of deer horn-like and spherical ZnO nanoparticles by microwave decomposition of bis(2-pyridinethiol N -oxide)zinc using factorial and Taguchi experimental designs, J. Mater. Sci.: Mater. Electron., 2011, 22(4), 328–334 CrossRef CAS.
- V. N. Gaitonde, S. R. Karnik and J. C. Rubio, et al., Analysis of parametric influence on delamination in high-speed drilling of carbon fiber reinforced plastic composites, J. Mater. Process. Technol., 2008, 203(1–3), 431–438 CrossRef CAS.
- D. C. Montgomery Design and Analysis of Experiments, 8th edn, 2012 Search PubMed.
- G. Lund, D. Nielson and R. Tanner, High strength reactive materials, US Pat., 20030096897, 2003 Search PubMed.
- N. Balakrishnan, T. Colton, B. Everitt, et al., Wiley StatsRef: Statistics Reference Online ‖ Half-Normal Plots, 2014 Search PubMed.
- P. Kiesow, The Pareto chart--a tool for continuous improvement, Ceram. Ind., 1995, 144, 20 Search PubMed.
- M. G. Larson, Analysis of variance, Circulation, 2008, 117(1), 115–121 CrossRef PubMed.
- J. S. Nobre and J. M. Singer, Residual Analysis for Linear Mixed Models, Biom. J., 2010, 49, 5 Search PubMed.
- E. B. Herbold, V. F. Nesterenko and D. J. Benson, et al., Particle size effect on strength, failure and shock behavior in Polytetrafluoroethylene-Al-W granular composites, J. Appl. Phys., 2008, 104, 1007 CrossRef.
| This journal is © The Royal Society of Chemistry 2022 |

