 Open Access Article
Synthesis of meso-porous α-Ga2O3 from liquid Ga metal having significantly high photocatalytic activity for CO2 reduction with water
Tomomi Aoki *a,
Kyoshiro Ichikawaa,
Kenta Sonodaa,
Muneaki Yamamoto
 b,
Tetsuo Tanabe
 b and
Tomoko Yoshida
 *b
*b
aApplied Chemistry and Bioengineering, Graduate School of Engineering, Osaka City University, Osaka 558-8585, Japan. E-mail: m20tc001@uv.osaka-cu.ac.jp; Tel: +81-666053619
bResearch Center for Artificial Photosynthesis, Osaka City University, Osaka 558-8585, Japan. E-mail: tyoshida@osaka-cu.ac.jp
First published on 2nd March 2022
Abstract
We have succeeded in synthesizing meso-porous α-Ga2O3 which shows significantly high photocatalytic activity for CO2 reduction with water. The sample was synthesized by hydroxidation of liquid Ga metal in water to obtain GaOOH and Ga(OH)3, followed by the calcination of the mixed hydroxides at 773 K for 1 hour which converted them to meso-porous α-Ga2O3. The nano-pores remained as the trace of the evaporation of water produced by the oxidation of the hydroxides during the calcination. The photocatalytic activity of the synthesized meso-porous α-Ga2O3 for CO2 reduction with water was as high as or higher than previous studies using various types of Ga2O3 with and without cocatalysts.
Introduction
Gallium sesquioxide (Ga2O3) is well known as one of the promising photocatalysts for CO2 reduction with water and has been extensively studied.1 Nevertheless, its photocatalytic activity is not high enough and significant improvement is required for practical use. Nanoparticulation of photocatalysts is often employed for their improvement.2,3 In addition, because Ga2O3 shows polymorphism having six different crystalline phases, α, β, γ, δ, ε and κ, the effects of artificial control of phases and morphology for improvement have been investigated.4–7 Li et al.8 and Das et al.9 have claimed that meso-porous α-Ga2O3 having a large specific surface area was formed easily by the calcination of α-GaOOH and showed high photocatalytic activity for the degradation of dyes. Although, Rodriguez et al.10 also have reported that α-Ga2O3 formed by the calcination of GaOOH made from liquid Ga metal oxidation degraded MG dye well, little investigation on the photocatalytic activity of α-Ga2O3 for CO2 reduction with water has been done.In a previous work, Sonoda et al.11 have reported first time that α-Ga2O3 formed by the calcination of GaOOH made of liquid metal Ga hydroxidation with water showed high photocatalytic activity for the CO2 reduction with water. Following the previous work, in this work, we have succeeded to synthesize meso-porous α-Ga2O3 which shows significantly high photocatalytic activity for CO2 reduction with water under UV light illumination, using liquid Ga metal as a starting material, through the hydroxidation to GaOOH and Ga(OH)3 followed by the calcination of these hydroxides.
Although it is well known that utilization of silver (Ag) as a cocatalyst enhances the CO production in the photocatalytic reduction of CO2, we are focusing the photocatalytic activity of Ga2O3 and the mechanism of photocatalytic reduction of CO2 with water without the Ag cocatalyst.
Experimental
Sample preparation
1 g of liquid Ga metal (Kojundo Chemical Laboratory Co. Ltd purity 99.99%) and 100 mL of distilled water were placed in a Teflon beaker and agitated for 6 days until Ga was mostly dispersed in distilled water as hydroxides, GaOOH and Ga(OH)3, which were the reaction products with water. The temperature was kept constant at around 323 K and the loss of the water by evaporation was compensated with water injection. After the hydroxidation, the product was filtered and dried in air, and then calcined in air at 773 K for 1 hour to convert to α-Ga2O3 which is referred as a synthesized sample hereafter.Characterization
The characterization of the hydroxidized and synthesized sample was performed by X-ray diffraction (XRD), scanning electron microscopy (SEM), transmission electron microscope (TEM), specific surface area (SSA) measurements and UV-Vis diffuse reflectance spectroscopy. The XRD analysis was done with MiniFlex600 (Rigaku) in which Cu Kα was used as a radiation source under operating voltage of 40 kV and current of 15 mA. The angle scanning rate of an X-ray detector was 10° min−1. SEM images were observed by a field emission scanning electron microscope (FE-SEM, JSM-6500F, JEOL Ltd) under an acceleration voltage of 15 kV. TEM images were obtained by a transmission electron microscope (JEM-2100F, JEOL Ltd) under an acceleration voltage of 200 kV. Specific surface areas (SSA) of the samples were determined by the Brunauer–Emmett–Teller (BET) method with using MonosorbTM (QUANTACHROME). Before the BET measurement, each sample was heated in N2 gas at 423 K for 3 h, which did not give significant changes in morphology and crystalline phases. UV-Vis spectra were obtained with an UV-visible near-infrared absorbance photometer (V-670, JASCO) with the diffuse reflection method using the BaSO4 as a reference.Photocatalytic reduction of CO2 with water
The photocatalytic CO2 reduction tests were conducted with using synthesized samples as the catalysts. A sample of 0.05 g was placed in a quartz reaction cell together with aqueous solution of 0.5 M NaHCO3. The UV light illumination was done by a Xe lamp through the UV cold mirror. The light intensity was 30 mW cm−2 at 254 ± 10 nm. CO2 gas was flowed in the cell with the flow rate of 3 mL min−1. The reaction products (H2, O2 and CO) were analysed quantitatively by a gas chromatograph equipped with a thermal conductivity detector every one hour up to 24 hours including 1 hour for a background measurement performed without the UV light illumination.Results and discussion
Sample characterization
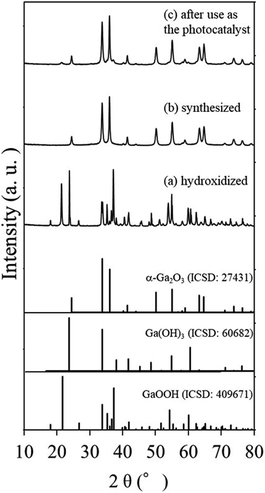
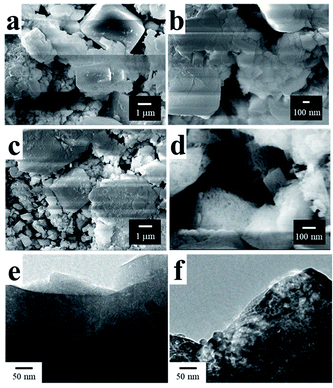
Fig. 1 shows the XRD patterns of the samples (a) hydroxidized, (b) synthesized and (c) after use as the photocatalyst and Fig. 2(a)–(d) are SEM images of the hydroxidized and synthesized samples respectively. Fig. 1(a) clearly shows the hydroxidation of liquid Ga metal to be orthorhombic GaOOH and cubic Ga(OH)3 with no trace of the metallic phase of Ga. The morphologies of the samples corresponded well to their XRD pattern, i.e., GaOOH exhibits smaller columnar particles, while Ga(OH)3 larger rectangular particles. | ||
| Fig. 1 XRD patterns of the samples (a) hydroxidized (b) synthesized and (c) after use as the photocatalyst. Those for α-Ga2O3, Ga(OH)3 and GaOOH are also given as references. | ||
 | ||
| Fig. 2 SEM images of the samples (a, b) hydroxidized and (c, d) synthesized and TEM images of the samples (e) hydroxidized and (f) synthesized. | ||
As seen in the XRD pattern (Fig. 1(b)), the synthesized sample was fully converted to α-Ga2O3. Although the morphology of the synthesized samples did not change appreciably from that of the hydroxidized ones (compare Fig. 2(c) and (a)), the enlarged image of the former (Fig. 2(d)) shows nanopores which was introduced by the calcination. In TEM images given in Fig. 2(e) and (f), a few nm sized pores were homogeneously distributed in α-Ga2O3. Unfortunately, it is difficult to distinguish closed or open pores in the TEM image. In addition, particle sizes of α-Ga2O3 were widely distributed so that it was hard to correlate the SSA with the pore size distribution.
The XRD pattern and morphology of the sample after use as a photocatalyst for CO2 reduction with water stayed nearly the same as that before use, except the appearance of small XRD peaks assigned to be GaOOH as shown in Fig. 1(c).
Specific surface areas determined by BET analysis of the samples hydroxidized and synthesized were 2.52 and 19.2 m2 g−1, respectively. Considering the morphology changes appeared in SEM images, the significant increase of specific surface area is most probably caused by the formation of nano-porous by the calcination as seen in Fig. 2(d) and (f). The pores should be formed by the evaporation of H2O released by the oxidation of the hydroxides during the calcination as,
| 2 GaOOH → Ga2O3 + H2O↑ | (1) |
| 2Ga(OH)3 → Ga2O3 + 3H2O↑ | (2) |
Photocatalytic reduction of CO2 with water
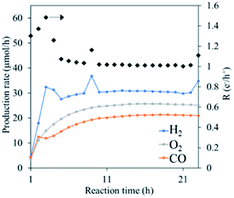
With using the synthesized meso-porous α-Ga2O3 as a photocatalyst, CO2 reduction with water under UV light illumination was conducted. Fig. 3 shows the observed time sequences of production rates for H2, CO and O2 up to 24 hours. In the figure, the stoichiometry rate of the products, i.e. ([H2]+[CO])/2[O2] = 1, with [H2], [CO] and [O2] being respective production rates, is also shown. Although all production rates initially increased with the time, they were saturated after 5 hours and afterwards stayed constant keeping the stoichiometry, indicating that the CO2 reduction proceeded photocatalytically. The high CO production rates continued over 24 hours. | ||
| Fig. 3 Time sequences of production rates of H2, CO and O2, and the electron and hole ratio consumed for the gaseous product formation, R (e−/h+) under CO2 reduction tests for sample. | ||
It should be noted that the selectivity of CO production is nearly 40% which is quite high for the photocatalytic CO2 reduction without the Ag cocatalyst. Furthermore, the CO production rate is much higher than those observed in the previous study11 in which α-Ga2O3 was synthesized under higher temperature and longer calcination time was employed and hence the nano-pores might have been disappeared. Considering the small mass of the sample used as the photocatalyst (0.05 g) and non-use of a co-catalyst, it can be concluded that the synthesized meso-porous α-Ga2O3 showed quite high activity for photocatalytic reduction of CO2. Although, the direct comparison of photocatalytic activities obtained with different reaction cells appeared in the literature, the present CO production rate (20 μmol h−1 0.05 g−1) is much higher than the previously observed highest production rate of CO in photocatalytic CO2 reduction with water using the mixed phase of β- and γ-Ga2O3 without cocatalyst (10 μmol h−1 0.1 g−1).12 The present CO production rate is even comparable to previous studies using cocatalysts like rare-earth, Ag, Pt, transition metal doping and utilization of support.13–17
It should be noted that in the early stage of the photocatalytic reduction, the stoichiometry among the product was not kept with higher H2 production rate (see Fig. 3). Most probably some Ga remained in the sample, which were not appreciable in XRD, was oxidized with water, producing H2 as,
| 2Ga + 4H2O → 2GaOOH + 3H2 | (3) |
| 2Ga + 3H2O → Ga2O3 + 3H2 | (4) |
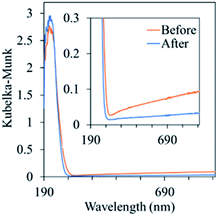
This is confirmed by the change of the UV-Vis spectra of the sample before and after use as the photocatalyst as shown in Fig. 4. The sample before use showed the absorption in visible wavelength region indicating the existence of Ga with metallic state, while that after use showed no absorption.
In the XRD of the sample after use, the peak attributed to GaOOH was clearly observed. Kawaguchi et al. have indicated that the formation of GaOOH during the photocatalytic reaction with water on the mixed phase of β-Ga2O3/γ-Ga2O3 enhanced the CO2 reduction.18 Therefore, some GaOOH formation on Ga2O3 surface could have important contribution in the reduction process. As for the reaction mechanism, we have proposed the following redox like chemical reaction.19 Initially the surface of α-Ga2O3 is hydroxidized with water to be GaOOH. Then UV light illumination dissociated the GaOOH as
| 2GaOOH → α-Ga2O3 + H2 + 1/2O2 | (5) |
During this reduction process, some H2 involved in the reduction of CO2. Without the UV illumination, Ga2O3 on the surface retuned to GaOOH by reacting with water.
| α-Ga2O3 + H2O → 2GaOOH | (6) |
Because in water near room temperature, GaOOH is thermodynamically more stable than α-Ga2O3, the surface of α-Ga2O3 would be converted to GaOOH, i.e. the surface of both phases in water are in thermodynamical equilibrium.
| α-Ga2O3 + H2O = 2GaOOH − ΔG | (7) |
At present the details of CO2 reduction mechanism is not clear. Probably nanopores in α-Ga2O3 would enhance CO2 adsorption, however the further study is needed to confirm this and to know the effect of GaOOH.
Conclusions
We have succeeded to synthesize meso-porous α-Ga2O3 which shows significantly high photocatalytic activity of CO2 reduction with water under UV light illumination. The activity is one of the highest among those reported including Ag co-catalyst assisted or other metal doped ones. The synthesis was done in the following way. At first, liquid Ga metal was hydroxidized in water at 323 K resulting in mixed hydroxides of GaOOH and Ga(OH)3. Then the mixed hydroxides were calcined at 773 K for 1 hour, which fully oxidized them into α-Ga2O3. Thus synthesized α-Ga2O3 included meso-pores caused by the vaporization of water during the calcination as evidenced by high specific surface area. The meso-porous structure is most likely the main cause for the significantly high photocatalytic activity. Since the present method is rather easy to control the conditions of α-Ga2O3 synthesis, further improvement of the activity would be possible with optimization of morphology and meso-porous structures.Conflicts of interest
There are no conflicts to declare.Acknowledgements
This work was supported by JSPS KAKENHI Grant Number 21K18856.Notes and references
- Z. Huang, K. Teramura, H. Asakura, S. Hosokawa and T. Tanaka, Curr. Opin. Chem. Eng., 2018, 20, 114–121 CrossRef.
- L. C. Tien, W. T. Chen and C. H. Ho, J. Am. Ceram. Soc., 2011, 94, 3117–3122 CrossRef CAS.
- K. Girija, S. Thirumalairajan, G. S. Avadhani, D. Mangalaraj, N. Ponpandian and C. Viswanathan, Mater. Res. Bull., 2013, 48, 2296–2303 CrossRef CAS.
- S. Bai, C. Gao, J. Low and Y. Xiong, Nano Res., 2019, 12, 2031–2054 CrossRef CAS.
- S. I. Stepanov, V. I. Nikolaev, V. E. Bougrov and A. E. Romanov, Rev. Adv. Mater. Sci., 2016, 44, 63–86 CAS.
- J. Liu and G. Zhang, Mater. Res. Bull., 2015, 68, 254–259 CrossRef CAS.
- V. Ghodsi, S. Jin, J. C. Byers, Y. Pan and P. V. Radovanovic, J. Phys. Chem. C, 2017, 121, 9433–9441 CrossRef CAS.
- D. Li, X. Duan, Q. qin, H. Fan and W. Zheng, J. Mater. Chem. A, 2013, 1, 12417–12421 RSC.
- B. Das, B. Das, N. S. Das, S. Sarkar and K. K. Chattopadhyay, Microporous Mesoporous Mater., 2019, 288, 109600 CrossRef CAS.
- C. I. M. Rodríguez, M. Á. L. Álvarez, J. J. F. Rivera, G. G. C. Arízaga and C. R. Michel, ECS J. Solid State Sci. Technol., 2019, 8, 3180–3186 CrossRef.
- K. Sonoda, M. Yamamoto, T. Tanabe and T. Yoshida, ACS Omega, 2021, 6, 18876–18880 CrossRef CAS PubMed.
- M. Akatsuka, Y. Kawaguchi, R. Itoh, A. Ozawa, M. Yamamoto, T. Tanabe and T. Yoshida, Appl. Catal., B, 2020, 262, 118247 CrossRef CAS.
- H. Tatsumi, K. Teramura, Z. Huang, Z. Wang, H. Asakura, S. Hosokawa and T. Tanaka, Langmuir, 2017, 33, 13929–13935 CrossRef CAS PubMed.
- Z. Wang, K. Teramura, S. Hosokawa and T. Tanaka, J. Mater. Chem. A, 2015, 3, 11313–11319 RSC.
- M. Takemoto, Y. Tokudome, S. Kikkawa, K. Teramura, T. Tanaka, K. Okada, H. Murata, A. Nakahira and M. Takahashi, RSC Adv., 2020, 10, 8066–8073 RSC.
- R. Pang, K. Teramura, M. Morishita, H. Asakura, S. Hosokawa and T. Tanaka, Commun. Chem., 2020, 3, 137 CrossRef CAS.
- Y. X. Pan, Z. Q. Sun, H. P. Cong, Y. L. Men, S. Xin, J. Song and S. H. Yu, Nano Res., 2016, 9, 1689–1700 CrossRef CAS.
- Y. Kawaguchi, M. Yamamoto, A. Ozawa, Y. Kato and T. Yoshida, Surf. Interface Anal., 2019, 51, 79–84 CrossRef CAS.
- T. Aoki, M. Yamamoto, T. Tanabe and T. Yoshida, New J. Chem., 2022, 46, 3207–3213 RSC.
| This journal is © The Royal Society of Chemistry 2022 |

