 Open Access Article
Concanavalin A-conjugated gold nanoparticle/silica quantum dot (AuNPs/SiQDs-Con A)-based platform as a fluorescent nanoprobe for the bioimaging of glycan-positive cancer cells†
Somayeh Jafarzadehab,
Nasrin Bargahic,
Hassan Bagherpour Shamlood and
Jafar Soleymani *b
*b
aDrug Applied Research Center, Tabriz University of Medical Sciences, Tabriz, Iran
bPharmaceutical Analysis Research Center, Tabriz University of Medical Sciences, Tabriz, Iran. E-mail: jsoleymanii@gmail.com; soleymanij@tbzmed.ac.ir; Tel: +98 41 3337 5365
cBiotechnology Research Center, Tabriz University of Medical Sciences, Tabriz, Iran
dLiver and Gastrointestinal Diseases Research Center, Tabriz University of Medical Sciences, Tabriz, Iran
eFood and Drug Safety Research Center, Tabriz University of Medical Sciences, Tabriz, Iran
First published on 17th March 2022
Abstract
The glycan receptor is a glycosylphosphatidylinositol glycoprotein that is overexpressed on the surface of various cancer cells and has been utilized for wide applications. In the present work, the surface of citrate-capped gold nanoparticles (cit-AuNPs) was modified with mercaptopropionic acid (MPA) molecules to provide carboxylic groups for secondary functionalization with amine anchored-silica quantum dots (Si-NH2 QDs) to produce cit-AuNPs-MPA/Si-NH2 QDs fluorescent nanoparticles. Concanavalin A (Con A) molecules were attached through thiol–AuNP bonds to produce the final cit-AuNPs/MPA/Si-NH2 QDs/Con A smart nanoparticles. The synthesized novel cit-AuNPs/MPA/Si-NH2 QDs/Con A nanoparticles were utilized for the bioimaging of glycan-overexpressed breast cancer cells. Fluorescence microscopy and flow cytometry results revealed that the cit-AuNPs/MPA/Si-NH2 QDs/Con A NPs can be efficiently taken up by cancer cells, with differentiating ability between overexpressed cancer cells and low-expressed normal cells. The cellular viability of the cit-AuNPs/MPA/Si-NH2 QDs/Con A NPs was tested by the MTT test, proving their biocompatible nature at the 200 μg mL−1 level. In conclusion, the fabricated cit-AuNPs/MPA/Si-NH2 QDs/Con A NPs could be utilized for the bioimaging of MCF-7 cancer cells even in the clinical setting after proper in vivo validation.
1. Introduction
Cancer is a global public health problem that is characterized by the unlimited growth and proliferation of abnormal cells.1,2 Effective and safe treatment of cancer has been a challenge for the medical community. Normal treatment approaches (none-targeted) can result in the development of different tumor types, while targeted treatments of cancers with specific molecules reduce the development of different tumor types by regulating the killing of cancerous cells while saving healthy and normal cells. Prohibiting certain cancer pathways by targeted therapy may negatively influence signaling pathways in healthy cells, leading to complex adverse effects that are often preferable to those of cytotoxic chemotherapy. Therefore, the science of cancer, oncology, is continuously searching for molecular and cellular pathways to diagnose carcinomas in early stages.In addition to the effectiveness of treatment approaches, early-stage diagnosis of cancer is one of the most efficient ways to decrease the burden of cancer. Currently, different assays are employed for the diagnosis of cancers, which mainly rely on cancer-specific biomarker detection.3–7 Surgery and removal of solid tumors are some of the best methods of therapy for cancers. The success of surgery is mainly limited by the precise localization of the solid tumor. In this regard, bioimaging techniques help to determine the exact location of tumoral tissue. Bioimaging is a superb tool for the diagnosis, staging, tracing therapy response, and prognosis of cancer.8–12 Currently used bioimaging techniques include magnetic resonance imaging (MRI), computed tomography (CT), and positron emission tomography (PET). However, these techniques can only recognize cancer at the middle and advanced stages.5,13,14 Moreover, each of these bioimaging methods has its own limitations and advantages, including spatial brightness, temporal resolution, imaging price, sensitivity, and amount of penetration into the tissue. CT, MRI, and fluorescence-based bioimaging techniques are frequently utilized due to their high ability to target cells. However, the fluorescence-based bioimaging technique shows a few important features that may provide an opportunity for highly sensitive and accurate bioimaging of tumoral tissue. Despite the limited application of fluorescence-based bioimaging techniques in clinics, these methods are used as supplements in collaboration with other bioimaging methods, such as MRI. Usually, a smart combination of bioimaging techniques provides more information related to the size and shape of the solid tumor, allowing for a more successful surgical process.
Recently, targeted bioimaging and recognition of cancer tumoral cells has aroused great interest. Surface membrane receptors provide a favorable opportunity to be employed for several biomedical aims, such as sensing, imaging, and drug delivery.15–22 Folate receptor, glycan receptor, and vascular endothelial growth factor receptor are some membrane receptors which are mainly expressed on the surface of cancer cells and have limited expression on normal cells.23–25
Glycan receptor is a glycosylphosphatidylinositol glycoprotein that is largely expressed on the membrane of breast cancer cells. This receptor is attached to concanavalin A (Con A), a lectin (carbohydrate-binding protein) with high specificity.26 Based on this ability, it is hypothesized that highly fluorescent materials could be functionalized with Con A to use as bioimaging agents for cancer tumoral tissues. For bioimaging applications, it is essential that the produced materials have a high quantum yield (QY) and high stability in complex environments. As a role, materials with high biocompatibility, stability, and QY and low excitation and emission wavelengths are useful in fluorescence-based bioimaging. Despite the favorable formation constant of the interaction between folate and folate receptor (1010 M), this receptor may not be able to differentiate between the molecules folate and methotrexate (a folate-like molecule). However, the application of Con A-functionalized materials may result in enhanced resolution of the captured images.
Many kinds of fluorescent probes, such as quantum dots, gold nanoparticles, up-conversion nanoparticles, silica nanoparticles, and highly fluorescent metal-based nanoclusters, have been employed for cancer cell bioimaging purposes. These fluorescent nanomaterials eliminate some limitations of organic dyes, such as low stability toward long-term bioimaging applications. Size-tunability, bright fluorescence emission, and long-time photostability of quantum dots (QDs) (especially semiconductor-based QDs) make them favorable substitutes for organic dyes. The main disadvantages of employing fluorescent materials are leaching and degradation to their toxic secondary particles/molecules. Bioimaging of solid tumors by nanomaterials requires two major conditions of high quantum yield (QY) and low background noise. Fluorescence-based bioimaging methods have aroused attention to be utilized for routine monitoring of biomarkers and localization of solid tumors. These methods provide beneficial features of noninvasiveness (or low invasiveness), deep-penetration bioimaging capacity, and real-time bioimaging of cells or other intracellular molecules.
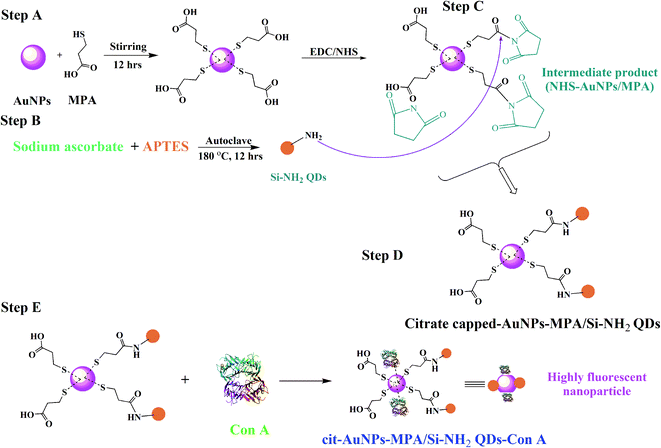
Herein, novel citrate-capped AuNPs functionalized with Si-NH2 QDs were fabricated for bioimaging of MCF-7 cancer cells. Firstly, cit-AuNPs/MPA NPs and Si-NH2 QDs were produced and then combined under an EDC/NHS protocol. Finally, Con A molecules were added to the cit-AuNPs/MPA/Si-NH2 QDs NPs to produce a biocompatible and highly fluorescent cit-AuNPs/MPA/Si-NH2 QDs/Con A smart nanocomposite, proposed for direct usage as a bioimaging agent of glycan receptor-overexpressed MCF-7 cells. Combining all these beneficial features, including ease of synthesis, biocompatible nature, high stability and high fluorescence QY, these cit-AuNPs/MPA/Si-NH2 QDs/Con A luminescent nanoparticles hold great potential for clinical bioimaging applications.
2. Experimental section
2.1. Materials
Mercaptopropionic acid (MPA), gold(III) chloride trihydrate (HAuCl4·3H2O), (3-aminopropyl)triethoxysilane (APTES, 98.0%), N-hydroxysuccinimide (NHS, 98.0%), dimethylsulfoxide (DMSO), 1-ethyl-3-(3-dimethylaminopropyl)carbodiimide (EDC, 98%), phosphate buffer solution (PBS, 98.0%) and 3-(4,5-dimethylthiazol-2-yl)-2,5-diphenyltetrazolium bromide (MTT, 99.0%) were purchased from Sigma-Aldrich Co. (Darmstadt, Germany). Fetal bovine serum (FBS), trypsin–EDTA (25%), streptomycin/penicillin solution, and Roswell Park Memorial Institute 1640 growth medium (RPMI) powder were obtained from Gibco BRL Life Technologies (USA). Concanavalin A (Canavalia ensiformis) was also obtained from Sigma-Aldrich Co. (Darmstadt, Germany). All cells were provided by the National Cell Bank of Iran (NCBI) in Tehran (Iran).2.2. Apparatus
Fourier transform infrared (FTIR) spectra were captured by a Shimadzu Prestige 21 model FTIR spectrophotometer (Tokyo, Japan). Fluorescence spectra were recorded using a JASCO FP 750 spectrofluorometer (Tokyo, Japan). Fluorescence bioimages were captured by a Model Bh2-RFCA Olympus fluorescence microscope (Tokyo, Japan). Field emission scanning electron microscopy (FESEM) images and energy dispersive X-ray (EDX) spectra were recorded on an FEG-SEM (MIRA3 TESCAN, Brno, Czech Republic). Dynamic light scattering and zeta potential studies were implemented using a Malvern particle size analyzer (Malvern, UK) for the measurement of the size distribution and surface charge condition of cit-AuNPs-MPA/Si-NH2 QDs/Con A. Quantitative uptake of cit-AuNPs-MPA/Si-NH2 QDs/Con A was determined by a FACSCalibur flow cytometer (Becton Dickinson Immunocytometry Systems, California, USA) and MACS Quant 10 (Miltenyi Biotech GmbH, Gladbach, Germany). The MTT assay was performed at 570 nm using a microplate reader (Awareness Technology, Florida, USA).2.3 Synthesis
Synthesis of the cit-AuNPs, cit-AuNP/MPA, Si-NH2 QDs, cit-AuNPs-MPA/Si-NH2 QDs and cit-AuNPs-MPA/Si-NH2 QDs/Con A was implemented as described in the following section. It is noteworthy that all synthesis processes were performed at least three times.To check the reproducibility of each synthesis process, different steps were performed. As the first step, the spectral properties of the nanoparticles were checked by a spectrophotometer and spectrofluorometer to obtain the same absorption, excitation, and emission spectra. As the second step, the FTIR spectra were plotted to evaluate the functional groups. As the final step, imaging techniques such as SEM and DLS were used to confirm the size distributions and morphologies of the produced nanoparticles.
2.4. Biological tests
The toxic effects of cit-AuNPs-MPA/Si-NH2 QDs/Con A NPs on MCF-7 cells were investigated via MTT assay. 1.0 × 10⁴ MCF-7 cancer cells were poured into a 96-six-well microplate and incubated for about 24 h. Next, different concentrations of cit-AuNPs-MPA/Si-NH2 QDs/Con A NPs were added to each well and incubated for 3, 6, 18, and 24 h. Then, the MTT reagent was prepared with a concentration of 3.0 mg mL−1 and added to each well. After 4 h of incubation, the media was replaced by DMSO (200 μL) and then incubated for another 0.5 h. Finally, the absorbances were measured at 570 nm.
3. Results and discussion
3.1. Characterization of the cit-AuNPs-MPA/Si-NH2 QDs/Con A NPs nanocomposite
The FESEM analysis showed that the produced cit-AuNPs-MPA/Si-NH2 QDs/Con A NPs nanocomposite showed a semi-spherical shape in which Si-NH2 QDs were attached on the surface of AuNPs (Fig. 1). The final size of the nanomaterials was around 60 nm (±5 nm). Also, the EDX spectrum confirmed that MPA, Si-NH2 QDs, and Con A were attached to the surface of the AuNPs (Fig. S8†). Table S1† lists the percentages of the elements on the final nanoparticles, with C, N, O, Si, S and Au contents of 28.96%, 11.53%, 21.53%, 4.80%, and 17.87%, respectively.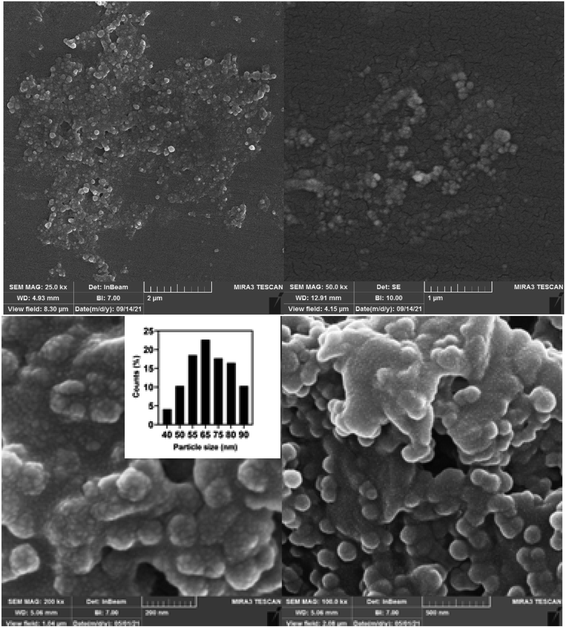 | ||
| Fig. 1 FESEM images of the cit-AuNPs/MPA/Si-NH2 QDs/Con A NPs (inset: size distribution was determined using 2430 dots). | ||
The wet size of the cit-AuNPs-MPA/Si-NH2 QDs/Con A NPs was determined by the DLS technique to show their hydrated size (Fig. S9†). The results showed that their average wet size was about 75 nm, which is in agreement with the FESEM results (Fig. 1). It seems that the presence of Con A macromolecules on the surface of the cit-AuNPs-MPA/Si-NH2 QDs/Con A NPs caused the surface charge to be at a more positive value (around −10 mV). However, the surface charges of the AuNPs, Si NH2 QDs, and Con A are −39.5 mV, −12.6 mV, and −14.2 mV, respectively; thus, the change of the surface charge of the cit-AuNPs-MPA/Si-NH2 QDs/Con A NPs to a positive value proves their efficient functionalization with Con A.29–31 These results demonstrated the proper attachment of Con A on the surface of the AuNPs.
The spectrum of Con A contains three major bands at 1624, 1636 and 1694 cm−1, among which the 1625 cm−1 band can be related to strong hydrogen bonding. Meanwhile, the 1636 cm−1 band is clearly associated with the main antiparallel r-sheet structure; however, the 1625 cm−1 band could correspond to peptide segments.32 Si–Hx bonds are presented at around 2100 and 1000 cm−1 and in the range of 600–650 cm−1. The bands obtained at around 3500 and 1630 cm−1 are related to the vibration of hydroxyl groups. The band at 900 cm−1 was assigned to the Si–OH stretching vibration. The absorption spectral band at 1040 cm−1 was assigned to the Si–O–Si asymmetric stretching vibration. A peak observed at 2400 cm−1 corresponded to the carbonyl group, which is evidence of the effective attachment of the Si-NH2 QDs to the AuNPs.33,34 Fig. S10† demonstrates the FTIR spectrum of the cit-AuNPs-MPA/Si-NH2 QDs/Con A NPs.
3.2. Photophysical properties of the cit-AuNPs-MPA/Si-NH2 QDs/Con A nanocomposite
The spectral properties of the cit-AuNPs-MPA/Si-NH2 QDs/Con A NPs were studied to show their possible absorption and fluorescence mechanisms and confirm the synthesis process. The absorption spectrum is presented in Fig. 2(a); it contains two peaks at 270 and 355 nm, relating to the characteristic peaks of the Si-NH2 QDs. These peaks are ascribed to the π–π* and n–π* transitions, respectively. The primary amine functional groups of the Si-NH2 QDs are attached to the MPA-functionalized AuNPs through carboxyl groups by the EDC/NHS reaction protocol. After the addition of the Con A molecules to the cit-AuNPs-MPA/Si-NH2 QDs NPs, covalent bonds are formed between the AuNPs and the thiol groups of Con A. This phenomenon was observed by a very minor red-shift (about 5 nm) in the absorption spectrum of the cit-AuNPs-MPA/Si-NH2 QDs NPs, proving the effective anchoring of the Con A molecules onto the surface of the cit-AuNPs-MPA/Si-NH2 QDs. As explained, zeta-potential analysis, EDX analysis, FESEM, and FTIR images confirmed the proper anchoring of the Con A molecules on the surface of the produced nanomaterial.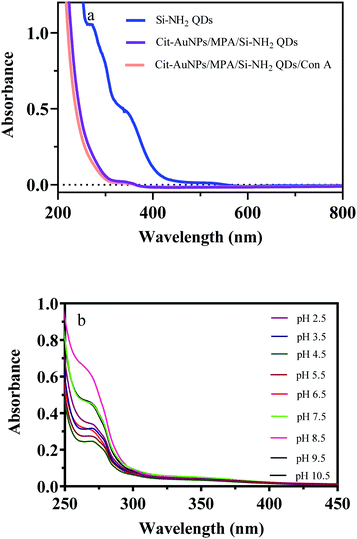 | ||
| Fig. 2 Absorption spectra of the Si-NH2 QDs, cit-AuNPs/MPA/Si-NH2 QDs, and cit-AuNPs/MPA/Si-NH2 QDs/Con A NPs (a) and effect of pH on the absorbance of the cit-AuNPs/MPA/Si-NH2 QDs/Con A NPs (b). | ||
The n–π* absorption is responsible for the high quantum yield fluorescence emission of the Si-NH2 QDs (emission wavelength 445 nm), which is mainly caused by the direct bandgap transition of the Si-NH2 QDs. However, the excitation and emission wavelengths of cit-AuNPs-MPA/Si-NH2 QDs/Con A are 350 nm and 430 nm, respectively. It is obvious that after insertion of the amine-functionalized Si QDs into the cit-AuNPs-MPA/Si-NH2 QDs/Con A nanocomposite, the excitation and emission wavelengths changed, confirming the attachment of the amine-functionalized Si QDs to the surface of the AuNPs (Fig. 2(b), S11 and S12†)). Although the emission wavelength was largely affected by the structure of the cit-AuNPs-MPA/Si-NH2 QDs/Con A NPs, the excitation peak changed by only 5 nm, which is another reason for the n–π* transition.31,35
The influence of the excitation wavelength of cit-AuNPs-MPA/Si-NH2 QDs/Con A was another factor affecting the emission of the NPs, which is demonstrated in Fig. S13.† The obtained results showed that the fluorescence emission of cit-AuNPs-MPA/Si-NH2 QDs/Con A was about constant upon altering the excitation wavelength from 300 nm to 400 nm, obeying Kash's rules. In some cases, the fluorescence peak wavelength can change to longer emission wavelengths with an increase in the excitation wavelength (red-edge effect), which is mainly initiated by available multiple electron states or several conformers of the molecule.36 The excitation in the UV domain (especially under 300 nm) provides restrictions in biological media and may cause noisy spectral peaks. In addition, the penetration depth of these wavelengths is limited.37
3.3. Effects of some factors on the absorbance and fluorescence of the nanocomposite
The pH dependence of the absorbance of cit-AuNPs-MPA/Si-NH2 QDs/Con A was also investigated and is presented in Fig. 2(b). As can be seen, a zigzag trend was obtained in the absorbance of the cit-AuNPs-MPA/Si-NH2 QDs/Con A NPs at various pH values. The absorbance values firstly decreased from pH 2.5 to 4.5 and were then enhanced up to 8.5, while the absorbances were diminished after pH 8.5. The excitation wavelength was not largely affected by the environmental pH. It seems that in highly acidic and basic media, the n–π* absorption of the cit-AuNPs-MPA/Si-NH2 QDs/Con A NPs is blocked.The pH value has a substantial effect on the fluorescence of the Si-NH2 QDs, cit-AuNPs-MPA/Si-NH2 QDs, and cit-AuNPs-MPA/Si-NH2 QDs/Con A NPs, which is presented in Fig. 3. The fluorescence spectra of the Si-NH2 QDs and cit-AuNPs-MPA/Si-NH2 QDs are enhanced up to 6.5 pH due to the free amine-functional groups, which are protonated at acidic pH values. However, in cit-AuNPs-MPA/Si-NH2 QDs/Con A, the amine groups are overlapped by the Con A macromolecules, and the Con A functional groups have the main effect on the final emission of cit-AuNPs-MPA/Si-NH2 QDs/Con A. The fluorescence emission of cit-AuNPs-MPA/Si-NH2 QDs/Con A increased from pH 2.5 to 7.5 and then decreased up to pH 10.5. The maximum fluorescence emission of cit-AuNPs-MPA/Si-NH2 QDs/Con A was obtained at pH 7.5. The obtained pH is an advantageous feature of the cit-AuNPs/MPA/AuNPs-Con A NPs because of the fact that it is close to the physiological pH value. Also, it is clear that the emission peak wavelength was not influenced by the pH; this is another advantageous feature of cit-AuNPs-MPA/Si-NH2 QDs/Con A, proposing it as a favorable probe for bioimaging of glycan-overexpressed cancer cells. As a limitation, the maximum emission is obtained at the neutral pH of 7.5, which may be affected by the acidic environment of cancerous cells. However, the fluorescence emission of the cit-AuNPs-MPA/Si-NH2 QDs/Con A NPs is sufficiently high to be highly bright at acidic pH values.
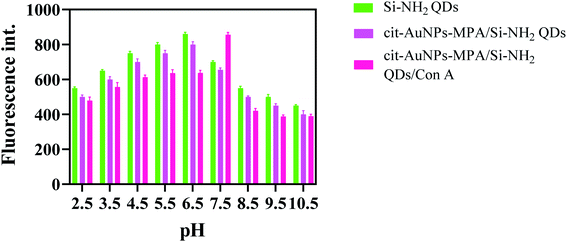 | ||
| Fig. 3 Effect of pH on the emission spectra of the Si-NH2 QDs, cit-AuNPs/MPA/Si-NH2 QDs, and cit-AuNPs/MPA/Si-NH2 QDs/Con A. | ||
3.4. Stability of the nanocomposite
The influence of the ionic strength of the environment on the fluorescence emission of cit-AuNPs-MPA/Si-NH2 QDs/Con A was also investigated and is presented in Fig. S14(a).† Upon addition of NaCl, the fluorescence intensities decreased up to 50 μL of saturated NaCl, reached the maximum level at around 500 μL and finally decreased up to 1500 μL. The addition of NaCl can result in a decrease in the solubility of cit-AuNPs-MPA/Si-NH2 QDs/Con A, or the nanocomposite may be decomposed at higher salt concentrations.Also, the obtained results showed that the cit-AuNPs-MPA/Si-NH2 QDs/Con A nanocomposite is sensitive toward UV light, and the photobleaching process may happen during UV exposure (Fig. S14(b)†). In addition, the results showed that cit-AuNPs-MPA/Si-NH2 QDs/Con A is stable for at least 10 min without meaningful change in its fluorescence intensity (Fig. S14(c)†). Fig. S14(d)† demonstrates the room temperature and refrigerator storing stabilities, proving the high shelf-time stability of cit-AuNPs-MPA/Si-NH2 QDs/Con A at two temperatures of interest. Fig. S14(e)† presents the effect of temperatures from 0 °C to 40 °C on the fluorescence emission of cit-AuNPs-MPA/Si-NH2 QDs/Con A. As expected, a decreasing trend was obtained; this is caused by the fact that at higher temperatures, intermolecular interactions are increased, which can result in non-radiation relaxations.
3.5. Calculation of quantum yield (QY)
The fluorescence QY value was also calculated for cit-AuNPs-MPA/Si-NH2 QDs/Con A at the optimum pH of 7.5. The QY calculation procedure was adopted from the literature.38 In this work, L-tyrosine, with a QY of 14% in water, was selected as a reference fluorescent material because of the closeness of its absorbance to that of cit-AuNPs-MPA/Si-NH2 QDs/Con A. The absorbances of the cit-AuNPs-MPA/Si-NH2 QDs/Con A and L-tyrosine solutions were adjusted below 0.6 to distinguish the concentrations for the fluorescence tests. Then, the fluorescence intensities of L-tyrosine and cit-AuNPs-MPA/Si-NH2 QDs/Con A were measured at the excitation wavelength of the nanoparticles (350 nm). Finally, the QY value of cit-AuNPs-MPA/Si-NH2 QDs/Con A was calculated using the following equation:where “S” and “R” denote cit-AuNPs-MPA/Si-NH2 QDs/Con A and L-tyrosine, respectively. QS and QR are the photoluminescence QY values; A is the absorbance; and η is the refractive index of water, which is equal to 1 for any dispersion or solution in water. The QY of cit-AuNPs-MPA/Si-NH2 QDs/Con A was calculated to be around 13.8%, which is far from that of the Si QDs, proving the quenching effect of the AuNPs.39 The values of QY for the Si-NH2 QDs (pH 6.5) and cit-AuNPs-MPA/Si-NH2 QDs (pH 6.5) were calculated as 65.9% and 39.6%, respectively. The fluorescence quenching of the AuNPs decreased the QY of the Si-NH2 QDs by about 25%, and this value was further decreased by covering the surface of the Si-NH2 QDs with Con A molecules.
3.6. Evaluation of cit-AuNPs-MPA/Si-NH2 QDs/Con A for targeting glycan-positive cancer cells
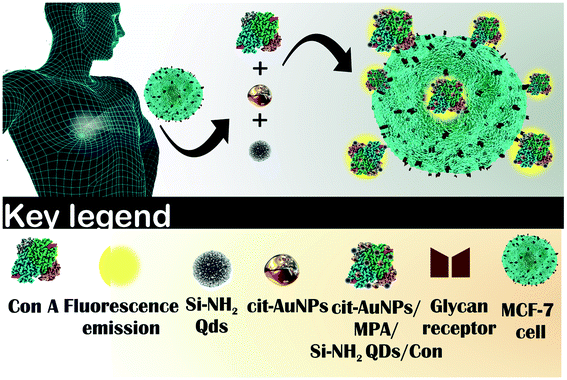 | ||
| Scheme 2 Attachment of Con A-functionalized cit-AuNPs/MPA/Si-NH2 QDs NPs to glycan-positive MCF-7 cancer cells. | ||
A bright green fluorescence signal is emitted by the cit-AuNPs-MPA/Si-NH2 QDs/Con A NPs anchored on the membrane of MCF-7 cancer cells after about 2 h of incubation. The obtained results clearly indicate the successful uptake and fluorescence emissions of cit-AuNPs-MPA/Si-NH2 QDs/Con A, which are proportionately related to the presence and absence of glycan receptors on the membranes of the cells. Cit-AuNPs-MPA/Si-NH2 QDs/Con A not only can attach to the membrane of MCF-7 cells but can undergo endocytosis and then uptake by the nucleus of the cells.
The stability of the produced material was doubly confirmed in the uptake images, where with increasing uptake time, the spectral properties were preserved, proving the material to be a good candidate for bioimaging of cancer cells.
Generally, there are some factors that can influence the brightness of fluorescence images, including the time of incubation and the levels of the nanoparticles which have been utilized for bioimaging of the cells. There are important required actions in the synthesis process to enhance the quality of the produced nanocomposite, including removing free constituent molecules, adjusting the conditions for accurate synthesis, and proper storing conditions.
As mentioned, the concentration of cit-AuNPs-MPA/Si-NH2 QDs/Con A and time of incubation are the two main parameters that affect the amount of cit-AuNPs-MPA/Si-NH2 QDs/Con A attached on the surface of MCF-7 cancer cells. As can be seen in Fig. 4(a), upon an increase in the cit-AuNPs-MPA/Si-NH2 QDs/Con A level, the amount of the accessible Con A molecules is enhanced; this subsequently produces more colorant images, inferring that an enhanced number of cells are attached to the cit-AuNPs-MPA/Si-NH2 QDs/Con A NPs. However, the fouling effect of the cit-AuNPs-MPA/Si-NH2 QDs/Con A NPs may be observed at its higher concentrations, resulting in a decrease in the final amount of uptake.
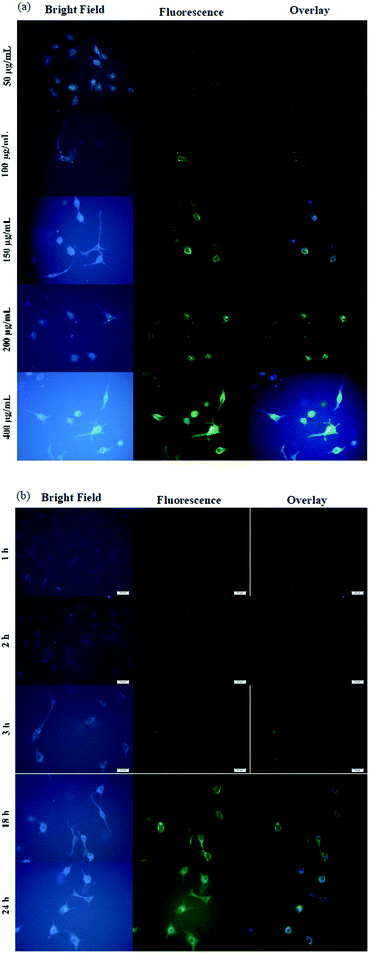 | ||
| Fig. 4 Fluorescence microscopy images of the uptake of the cit-AuNPs/MPA/Si-NH2 QDs/Con A nanomaterial at various concentrations (a) and times of incubation (b) (scale bar: 20 μm). | ||
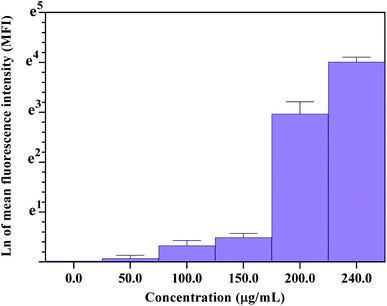
Fig. 4(b) represents the influence of the time of incubation on the amount of the cit-AuNPs-MPA/Si-NH2 QDs/Con A NPs that are attached to the surface of glycan-positive MCF-7 cancer cells. To investigate the influence of time of incubation on the cit-AuNPs-MPA/Si-NH2 QDs/Con A uptake, about 200 μg mL−1 of the nanoparticles was added to the cultured MCF-7 cells and incubated for 1, 2, 3, 18, and 24 h. At the first 1 h of incubation, the fluorescence signal of cit-AuNPs-MPA/Si-NH2 QDs/Con A was observed primarily near the MCF-7 cellular membrane (Fig. 4(b)). As the time of incubation was increased, the cit-AuNPs-MPA/Si-NH2 QDs/Con A fluorescence emission became stronger inside of the cells. However, there was no significant difference in the fluorescence emissions beyond 3 h of incubation. Fig. 5 provides quantitative flow cytometry analysis of the uptake of cit-AuNPs-MPA/Si-NH2 QDs/Con A by the glycan-positive MCF-7 cancer cells, where the flow cytometry results confirmed the bioimaging results obtained by fluorescence microscopy.
The high affinity of Con A macromolecules to the glycan receptors of the cell membrane of MCF-7 cells enhances the specificity of the cit-AuNPs-MPA/Si-NH2 QDs/Con A NPs to the glycan receptor-rich cells, while binding to the low-expressed cells is effectively restricted. As expected, the MCF-7 cancer cells were attached to the cit-AuNPs-MPA/Si-NH2 QDs/Con A NPs nanocomposite with brighter fluorescence than that observed for the HEK 293 glycan receptor-negative cells.
4. Conclusion
A novel fluorescent platform was fabricated for selective bioimaging of glycan receptor-overexpressed MCF-7 cancer cells. Si-NH2 QDs were added to cit-AuNPs-MPA to provide a fluorescent probe, and Con A molecules were used for specific attachment of the fluorescence probe to the MCF-7 cells. Cit-AuNPs-MPA NPs were utilized to enhance possible sites for the addition of the Si-NH2 QDs and subsequently further enhance the number of cit-AuNPs-MPA/Si-NH2 QDs/Con A NPs captured by glycan receptor-overexpressed cancer cells. The fabricated platform can bind to the glycan receptor-overexpressed MCF-7 cells with high specificity. Fluorescence microscopy images clearly display the capturing of the cit-AuNPs-MPA/Si-NH2 QDs/Con A NPs by MCF-7 cancer cells. These nanomaterials can differentiate glycan receptor-positive cells from negative cells. Also, the cit-AuNPs-MPA/Si-NH2 QDs/Con A NPs have a biocompatible nature, with high cellular targeting capability to glycan receptor-positive cells; this further validates them as a helpful bioimaging material for targeting MCF-7 cancer cells in the clinic, alone or combined with other techniques, such as MRI.Conflicts of interest
There are no conflicts to declare.Acknowledgements
This work was supported by Pharmaceutical Analysis Research Center of Tabriz University of Medical Sciences (Tabriz, Iran) with grant no of 67153.References
- WHO, accessed 31 October 2021, http://www.who.int/mediacentre/factsheets/fs297/en/.
- GLOBOCAN, accessed 28 August 2018, http://globocan.iarc.fr/Pages/fact_sheets_cancer.aspx, http://globocan.iarc.fr/Pages/fact_sheets_cancer.aspx.
- C. Magi-Galluzzi, Mod. Pathol., 2018, 31, S12 CrossRef PubMed.
- H. Brunnström, A. Johansson, S. Westbom-Fremer, M. Backman, D. Djureinovic, A. Patthey, M. Isaksson-Mettävainio, M. Gulyas and P. Micke, Mod. Pathol., 2017, 30, 1411 CrossRef PubMed.
- F. Bénard and É. Turcotte, Breast Cancer Res., 2005, 7, 153–162 CrossRef PubMed.
- D. B. Husarik and H. C. Steinert, in Seminars in nuclear medicine, Elsevier, 2007, vol. 37, pp. 29–33 Search PubMed.
- J. Soleymani, D. Perez-Guaita, M. Hasanzadeh, N. Shadjou and A. Jouyban, TrAC, Trends Anal. Chem., 2017, 86, 122–142 CrossRef CAS.
- J. Soleymani, S. Azizi, S. Abbaspour-Ravasjani, M. Hasanzadeh, M. H. Somi and A. Jouyban, Microchem. J., 2021, 170, 106732 CrossRef CAS.
- Y. Choi, S. Kim, M.-H. Choi, S.-R. Ryoo, J. Park, D.-H. Min and B.-S. Kim, Adv. Funct. Mater., 2014, 24, 5781–5789 CrossRef CAS.
- Q. Yuan, Y. Wu, J. Wang, D. Lu, Z. Zhao, T. Liu, X. Zhang and W. Tan, Angew. Chem., Int. Ed., 2013, 52, 13965–13969 CrossRef CAS.
- T. Yoon, K. N. Yu, E. Kim, J. S. Kim, B. G. Kim, S. Yun, B. Sohn, M. Cho, J. Lee and S. B. Park, Small, 2006, 2, 209–215 CrossRef CAS PubMed.
- H. Zhang, Y. Ma, Y. Xie, Y. An, Y. Huang, Z. Zhu and C. J. Yang, Sci. Rep., 2015, 5, 1–8 Search PubMed.
- P. Beard, Interface Focus, 2011, 1, 602–631 CrossRef PubMed.
- U. Bashir, A. Mallia, J. Stirling, J. Joemon, J. MacKewn, G. Charles-Edwards, V. Goh and G. Cook, Diagnostics, 2015, 5, 333–357 CrossRef CAS PubMed.
- J. Soleymani, M. Hasanzadeh, M. H. Somi, N. Shadjou and A. Jouyban, Biosens. Bioelectron., 2018, 115, 61–69 CrossRef CAS PubMed.
- D. J. O’shannessy, L. Grasso, S. Wan, Q. Chao and E. B. Somers, 2012.
- H. S. Yoo and T. G. Park, J. Controlled Release, 2004, 100, 247–256 CrossRef CAS PubMed.
- Y. Zhou, H. Wang, C. Wang, Y. Li, W. Lu, S. Chen, J. Luo, Y. Jiang and J. Chen, Mol. Pharm., 2012, 9, 1067–1076 CrossRef CAS PubMed.
- J. Soleymani, M. Hasanzadeh, M. H. Somi, S. A. Ozkan and A. Jouyban, Int. J. Biol. Macromol., 2018, 118, 1021–1034 CrossRef CAS PubMed.
- H. Kholafazad Kordasht, M.-H. M.-H. Moosavy, M. Hasanzadeh, J. Soleymani and A. Mokhtarzadeh, Anal. Methods, 2019, 11, 3910–3919 RSC.
- J. Soleymani, M. Hasanzadeh, N. Shadjou, M. H. Somi and A. Jouyban, TrAC, Trends Anal. Chem., 2020, 125, 115834 CrossRef CAS.
- B. Khalilzadeh, M. Rashidi, A. Soleimanian, H. Tajalli, G. S. Kanberoglu, B. Baradaran and M.-R. Rashidi, Int. J. Biol. Macromol., 2019, 134, 695–703 CrossRef CAS PubMed.
- A. C. Antony, Annu. Rev. Nutr., 1996, 16, 501–521 CrossRef CAS PubMed.
- J. Soleymani, M. Hasanzadeh, M. H. Somi and A. Jouyban, Mater. Sci. Eng., C, 2020, 107, 110320 CrossRef CAS.
- J. Soleymani, M. Hasanzadeh, M. H. Somi, N. Shadjou and A. Jouyban, Biosens. Bioelectron., 2019, 132, 122–131 CrossRef CAS PubMed.
- H.-Y. Lei and C.-P. Chang, J. Biomed. Sci., 2009, 16, 10 CrossRef PubMed.
- P. C. Lee and D. Meisel, J. Phys. Chem., 1982, 86, 3391–3395 CrossRef CAS.
- M. M. Maye, L. Han, N. N. Kariuki, N. K. Ly, W.-B. Chan, J. Luo and C.-J. Zhong, Anal. Chim. Acta, 2003, 496, 17–27 CrossRef CAS.
- J. Manson, D. Kumar, B. J. Meenan and D. Dixon, Gold Bull., 2011, 44, 99–105 CrossRef CAS.
- A. Makky, J. P. Michel, P. Maillard and V. Rosilio, Biochim. Biophys. Acta, Biomembr., 2011, 1808, 656–666 CrossRef CAS PubMed.
- Z. Golsanamlou, J. Soleymani, S. Abbaspour, M. Siahi-Shadbad, E. Rahimpour and A. Jouyban, Spectrochim. Acta, Part A, 2021, 256, 119747 CrossRef CAS PubMed.
- J. L. R. Arrondo, N. M. Young and H. H. Mantsch, Biochim. Biophys. Acta, Protein Struct. Mol. Enzymol., 1988, 952, 261–268 CrossRef CAS.
- V. Thamilselvi and K. V. Radha, Korean J. Chem. Eng., 2017, 34, 1801–1812 CrossRef.
- S. Askari, M. Macias-Montero, T. Velusamy, P. Maguire, V. Svrcek and D. Mariotti, J. Phys. D: Appl. Phys., 2015, 48, 4002 CrossRef.
- X. Wang, Y. Yang, D. Huo, Z. Ji, Y. Ma, M. Yang, H. Luo, X. Luo, C. Hou and J. Lv, Microchim. Acta, 2020, 187, 341 CrossRef CAS PubMed.
- M. Józefowicz and J. R. Heldt, J. Fluoresc., 2011, 21, 239–245 CrossRef PubMed.
- J. Lifante, Y. Shen, E. Ximendes, E. Martin Rodriguez and D. H. Ortgies, J. Appl. Phys., 2020, 128, 171101 CrossRef CAS.
- X. Tang, H. Yu, B. Bui, L. Wang, C. Xing, S. Wang, M. Chen, Z. Hu and W. Chen, Bioact. Mater., 2021, 6, 1541–1554 CrossRef CAS PubMed.
- S. Morozova, M. Alikina, A. Vinogradov and M. Pagliaro, Front. Chem., 2020, 8, 191 CrossRef CAS PubMed.
- K. Pal, A. Heinsch, A. Berkessel and A. L. Koner, Chem.–Eur. J., 2017, 23, 15008–15011 CrossRef CAS PubMed.
Footnote |
| † Electronic supplementary information (ESI) available. See DOI: 10.1039/d2ra00035k |
| This journal is © The Royal Society of Chemistry 2022 |

