
 Open Access Article
 This Open Access Article is licensed under a Creative Commons Attribution-Non Commercial 3.0 Unported Licence
Click functionalized biocompatible gadolinium oxide core-shell nanocarriers for imaging of breast cancer cells†
Shifaa M. Siribbal‡
 a,
Shaista Ilyas‡a,
Alexander M. Rennera,
Sumiya Iqbala,
Sergio Muñoz Vázquezb,
Abubakar Moawiaef,
Martin Valldorcd,
Muhammad S. Hussainef,
Klaus Schomäckerb and
Sanjay Mathur*a
a,
Shaista Ilyas‡a,
Alexander M. Rennera,
Sumiya Iqbala,
Sergio Muñoz Vázquezb,
Abubakar Moawiaef,
Martin Valldorcd,
Muhammad S. Hussainef,
Klaus Schomäckerb and
Sanjay Mathur*a
aInstitute of Inorganic Chemistry, University of Cologne, Greinstrasse 6, 50939 Cologne, Germany. E-mail: sanjay.mathur@uni-koeln.de; Tel: +49 221 470 5627
bClinic and Polyclinic for Nuclear Medicine, University of Cologne, Kerpenerstrasse 62, 50937 Cologne, Germany
cMax-Planck-Institut für Chemische Physik fester Stoffe, Nöthnitzer Strasse 40, 01187 Dresden, Germany
dCentre for Materials Science and Nanotechnology, Department of Chemistry, University of Oslo, Blindern, 0315 Oslo, Norway
eCologne Center for Genomics (CCG), University of Cologne, Faculty of Medicine and University Hospital Cologne, 50931 Cologne, Germany
fCenter for Biochemistry, Medical Faculty, University of Cologne, 50931 Cologne, Germany
First published on 8th November 2022
Abstract
Site-specific delivery using functionalized nanocarriers is in high demand in imaging applications of modern clinical research. To improve the imaging capabilities of conventionally used contrast agents and expand the targeting accuracy, functional gadolinium oxide based nanocarriers originated from homogeneous core shells structures (Gd2O3@SiO2@Fe3O4) were developed using a multilayer formation approach. The synthesis and chemical configuration for the covalent binding of macrocyclic chelating agents and estrogen targeting molecules on these nanocarriers were designed by a two-step chemical synthesis method. Initially, SiO2@Fe3O4 structures were prepared and encapsulated with a homogenous thin Gd2O3 overlayer. The exterior surface of the as-prepared carriers offered chemical binding with a breast cancer specific estrogen molecule, covalently grafted through a Click-Chemistry protocol. In the next step, to enhance the diagnostic imaging capabilities of these carriers, thiocyanate-linked chelator molecule, DOTA, was attached to the surface of estrogen bound Gd2O3@SiO2@Fe3O4 using basic reaction conditions. The active amino groups before and after conjugation of estrogen molecules on the surface were quantified using a fluorescamine based approach. Due to the covalent binding of the macrocyclic chelator to the Gd2O3@SiO2@Fe3O4 surface, core shell carriers showed potential radiolabeling efficiency using positron emitter radionuclide, gallium-68 (68Ga). Intracellular uptake of estrogen-conjugated carriers was evaluated with MCF7 breast cancer cell lines using confocal laser scanning microscopy and fluorescent flow cytometry. In addition, in vitro cytotoxicity studies of functional nanocarriers as compared to bare nanoparticles showed reduced toxicity to HEK-293 cells demonstrating the role of surface attached molecules in preventing direct exposure of the Gd2O3 surface to the cells. The as-developed gadolinium based nanocarriers presented excellent capabilities as biocompatible target-specific imaging probes which indicates great potential in the field of dual-mode contrast agents.
Introduction
Experimental pathways unifying imaging and therapeutic entities in a single carrier are desired for developing new theranostics probes capable of diagnosing the disease and delivering the therapeutic in a simultaneous action.1 Additionally, by integrating multiple imaging components within one nanoparticulate platform, hybrid materials may become robust contrast agents (CA) for dual mode imaging to enhance the diagnosis accuracy.2 In this context, nanoparticles (NPs) with surface-grafted functional ligands that can selectively link to an imaging unit as well as a drug molecule are of increasing interest.3The next-generation positive (T1) MRI contrast agents' gadolinium oxide (Gd2O3) NPs are growing as an excellent alternative to the current clinically available Gd3+-chelates based CAs on account of their high spin paramagnetism, high stability in physiological milieu, lower toxicity, and better bioavailability achievable through surface conjugation of targeting units.4–6 One of the major obstacles in using Gd-based materials for in vivo experiments is the known toxic effect of the Gd3+ ion.7–9 Although gadolinium ions can be toxic, however, the Gd2O3 nanoparticles can be designed as benign materials and currently being investigated as promising materials for various MRI applications. For instance, BSA and lactobionic acid coated gadolinium-based NPs are known as non-toxic to the different cell lines at the higher concentration and for a longer period of time.10,11 In another study, Gd2O3 particles showed excellent (100%) cell viability after their injection into mice up to 4 weeks.9
Tumor imaging via MRI can be upgraded by active and passive targeting and literature shows several reports on the use of gadolinium as a contrast agent in different biological assays. For example, gadolinium oxide particles covered with polymers such as polyacrylic acid or conjugating sericin enhanced magnetic resonance imaging with higher T1 relativity at tumor site in human brain glioma cells.12,13 Also doping the gadolinium oxide particles with mesoporous silica enhanced T1 contrast of gadolinium due to silica geometrical confinement.14–16 Recent studies have revealed that the conjugation of Gd3+ complexes with iron oxide NPs, and the combination of Gd2O3 NPs with other magnetic materials, such as Fe3O4 NPs into single composite particles leads to the enhancement of T1 and T2 contrast in MRI. In case of a thin gadolinium shell, nanocomposites provided higher relativity than a thick shell during MRI examinations.18 In vivo and in vitro studies during different applications, the gadolinium labeled iron oxide nanoparticles showed brighter-effects in T1-weighted MRI and iron nanoparticles were used as spin–spin relaxation (T2).19 To significantly enhance the T1 relaxation time without decreasing the T2 relaxation, iron-doped gadolinium nanoparticles were further studied by combining with hydrogenated silica to form a core–shell nanostructure with in vivo imaging with a significant improvement in T1/T2 dual mode.20 These results evidently showed that gadolinium labeled iron-silica nanoparticles have potential as a contrast agent in magnetic resonance imaging. However, the optimal design of efficient and nontoxic Gd2O3 nanomaterials remains to date a stimulating approach for the development of biocompatible materials for cancer-specific imaging applications.
The surface chemistry of NPs is an important factor for their biomedical application, as colloidal NPs come into contact with the biological environment through their surfaces.21,22 In general, one of the most critical aspects in the development of optimal nanoparticles is their colloidal stability and uncoated particles tend to aggregate in their dispersion in cell culture media exhibiting a significant toxic effect that limits their performance. Therefore, modifying the surface of NPs with organic molecules or hydrophilic polymers is crucial to improve their stability and inherent water dispersibility.23–28 Our study demonstrate biocompatible Gd2O3 based core shell nanocarriers to boost cancer cells intracellular uptake via ligand–receptor binding interactions. In addition, study also showed that amino silane rooted Gd2O3 carriers prevented the leaching of gadolinium ions which is of tremendous value to generate gadolinium based biocompatible nanomaterials for health-care application. The remaining amine residues were quantified on the surface of Gd2O3@SiO2@Fe3O4 nanocarriers and facilitated the binding of DOTA molecules to enable imaging of the cancer cells (Scheme 1).
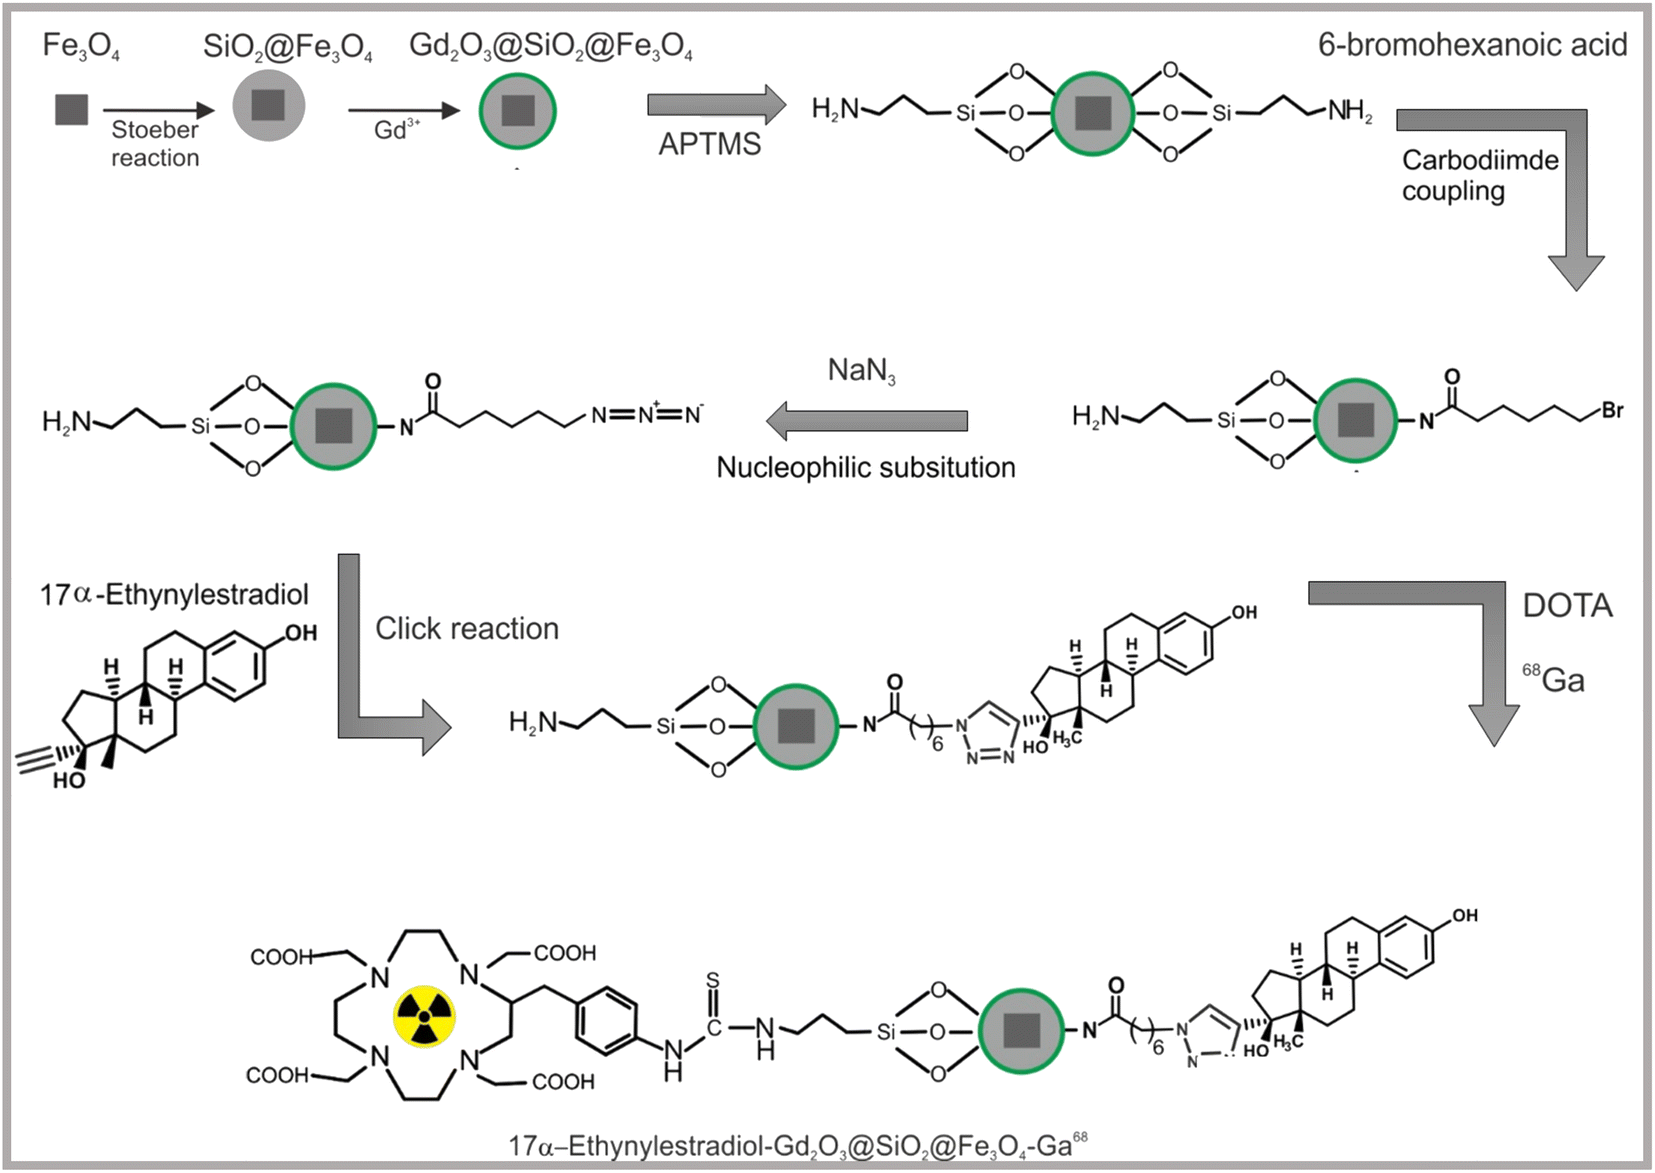 | ||
| Scheme 1 Schematic illustration of the design and functionalization of Gd2O3@SiO2@Fe3O4 (Fe3O4: cubes) nanocarriers with silane linker, estrogen and chelator molecules. | ||
Results and discussion
Design and synthesis of multilayered core–shell
Homogenous structures of Gd2O3@SiO2@Fe3O4 nanocarriers were chemically prepared based on multilayer assisted core shell approach. The formation of gadolinium oxide layer on core shell nanomaterials consists of a magnetite core, a middle SiO2 shell as a separating layer and outer a thin Gd2O3 layer.28–30 The SiO2 shell shields the magnetic dipole interaction of Fe3O4 NPs to reduce the quenching effect on T1 contrast material, and consequently prevents the perturbation of the relaxation properties of T1 contrast material.31,32The pathway of Gd2O3@SiO2@Fe3O4 synthesis first includes, solvothermal method and the use of inorganic iron precursor in the presence of DMF at high temperature for the formation of nanocubes. Following, these cubes were coated with a homogeneous silica shell using controlled reaction condition via a Stöber reaction. The silica shell on iron oxide cubes was chemically covered with a thin layer of gadolinium oxide. The carriers were extended for click conjugation strategies: APTMs was covalently attached on the surface of nanocarriers and quantified for amino active surface. Amino-terminated Gd2O3@SiO2@Fe3O4 carriers were linked with –Br and –N3 molecules via nucleophilic substitution reaction. The estrogen molecules with active alkyne groups were interacted with azide modified Gd2O3@SiO2@Fe3O4 via Click conjugation approach. The chelator molecules were covalently binded on estrogen-capped carriers via a chemical reaction using –SCN–linked DOTA compound under basic conditions.
Following, in a multistep click chemistry approach, the surface of Gd2O3@SiO2@Fe3O4 nanocarriers was evaluated for the quantification of active amino groups.
In detail, primarily, hydrophilic (PVP-capped Fe3O4, quasicubic) and hydrophobic (oleic acid-capped Fe3O4, spherical) iron oxide particles, which differ substantially in size, shape, and surface texture were prepared and coated with a homogeneous silica shell to ensure stability and active linker conjugation.33 Meanwhile, in case of the oleic acid-capped iron oxide particles, the oleic acid molecules were chemically adsorbed at NPs surfaces through the co-ordination between the metal atom and the –COO groups.34 As a result of this chemical interaction, the hydrophobic part of oleic acid heading outwards leads to the nonpolar nature of the oleic layer around NPs surface. Therefore, to confine and control the SiO2 coating and to stimulate the diffusion of the Fe3O4 NPs into the aqueous phase, non-ionic surfactant and micelles were employed. Herein, we applied an alternative strategy to use Stöber method for silica coated spherical iron oxide NPs instead of micro-emulsion approach. The treatment of nanocarriers with HCl (pH range: 3–4) resulted in the protonation of the oleate ligand and consequently the release of oleic acid from the NPs surface.35,36 Therefore, the NPs retained their hydrophilic properties due to the presence of the –OH groups on the surface. The formation of Gd2O3 shell onto the surface of SiO2@Fe3O4 carriers was attained through homogeneous precipitation of Gd3+ ion by the decomposition of urea at an elevated temperature.37 Controlled-precipitation reaction (pH > 6) offered the formation of Gd(OH)CO3 which coagulated on the negatively charged silanol groups at NP-surface. It in turn inhibits the dissolution of SiO2 layer and prevents possible agglomeration. Thermal treatment of Gd(OH)CO3@SiO2@Fe3O4 NPs at 800 °C led to conversion of Gd(OH)CO3 to Gd2O3 layer offering monodispersed Gd2O3@SiO2@Fe3O4 structures. The crystallinity of all samples was investigated by powder X-ray diffraction measurements (Fig. 1). For both, nanocubes and nanospheres, all diffraction peaks are consistent with the standard pattern of pure Fe3O4 which crystallized in an inverse spinel cubic space group. The broadening of the peaks in the case of nanospheres indicates the small size of the NPs, which is confirmed by TEM analysis. XRD pattern of SiO2@Fe3O4 NPs exhibited diffraction peaks similar to that of Fe3O4 NPs. All peaks indexed to the cubic inverse spinel structure of Fe3O4 confirmed that core maintained its crystallinity after SiO2 coating. Two additional peaks with low intensity were observed, probably due to the poorly crystalline state of SiO2 shell.38,39 The diffraction pattern of Gd(OH)CO3@SiO2@Fe3O4 showed key characteristic peaks of Fe3O4, (ICDD: C72-2303). The weak intensity of the peaks can be assigned to the formation of the additional layers on the surface of Fe3O4 core. No other peaks were observed indicating the amorphous nature of the Gd(OH)CO3.40 After annealing at 800 °C (2 h), additional peaks appeared which can be directly marked as a cubic crystalline phase of Gd2O3 according to ICDD: 00-012-0797. The low intensity of the signals can be attributed to the thin thickness of Gd2O3 layer.
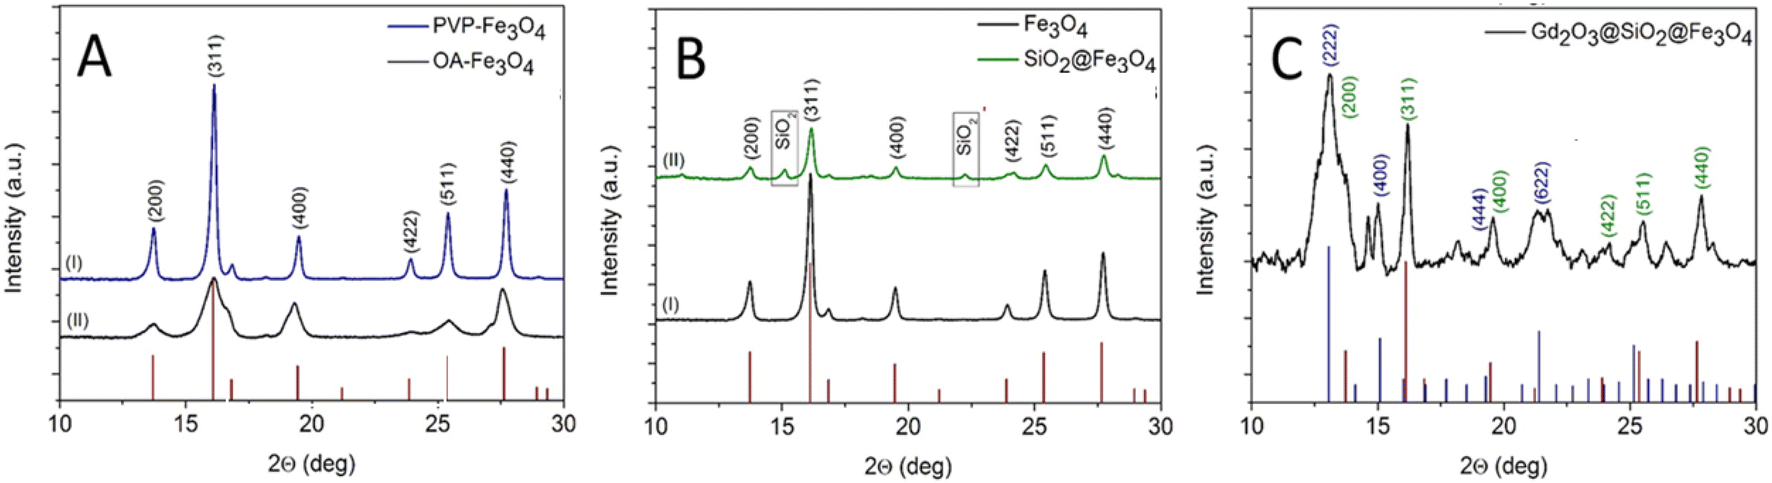 | ||
| Fig. 1 X-ray diffraction patterns of: (A) iron oxide cubes and spheres, (I) PVP-capped Fe3O4 nanocubes, and (II) OA-capped Fe3O4 nanospheres, (B) Fe3O4 nanocubes (I) before and (II) after coating with SiO2 layer, and (C) the as-prepared core–shell Gd2O3@SiO2@Fe3O4 (Fe3O4 cubes as core) after calcination at 800 °C for 2 h. | ||
The transmission electron microscopy (TEM) analysis of iron oxide revealed monodispersed nanocubes with uniform structure and an average diameter of 40 ± 4 nm (Fig. 2A). The controlled-quasi cubic geometry of the resulted nanocubes is dedicated to PVP which aids NPs to select their positions during the course of orientation attachment, and thus, formation of the regular geometry.41 The TEM analysis of other iron oxide particles showed the presence of nanospheres in the sample with an average size of 13 ± 2 nm (Fig. 2D). These uncapped spherical Fe3O4 NPs did not show any agglomeration trends after the detachment of oleic acid which can be due to the presence of characteristic surface charge (Fig. S2†). It has been shown in the literature that the uncovered Fe3O4 NPs are agglomerated compared to the OA-covered Fe3O4 NPs.42 Fig. 2B shows that SiO2@Fe3O4(cubes) acquired a typical core shell structure with dark (Fe3O4 core) and light contrast (SiO2 shell thickness of 20 ± 2 nm). Similar trends of homogeneous shell development (30 ± 10 nm) were observed for SiO2@Fe3O4(spheres) structures originated from spherical iron oxide (Fig. 2E). After, Gd2O3 coating, both, SiO2@Fe3O4(cubes) and SiO2@Fe3O4(spheres) exhibited smooth and thin Gd2O3 layer formation (6 ± 2 nm and 15 ± 5 nm respectively) with uniform solid core–shell structure. The images showed that the final morphology of the materials Gd2O3@SiO2@Fe3O4(cubes) or Gd2O3@SiO2@Fe3O4(spheres) obtained is influenced by the selection of the core material (Fig. 2C and F). More thickness of the Gd2O3 layer on SiO2@Fe3O4(spheres) as compared to SiO2@Fe3O4(cubes) may be due to the concentration of Gd3+ salt precursor during synthesis. Selected area electron diffraction (SAED) pattern showed polycrystalline nature of the Gd2O3-shell (Fig. S-3C†). The composition of the NP was further confirmed by Energy-Dispersive X-ray analysis (EDX) which displayed surface elements distribution of iron (Fe), silicon (Si), gadolinium (Gd) and oxygen (O) elements in the core shell NPs (Fig. S-3D†).43
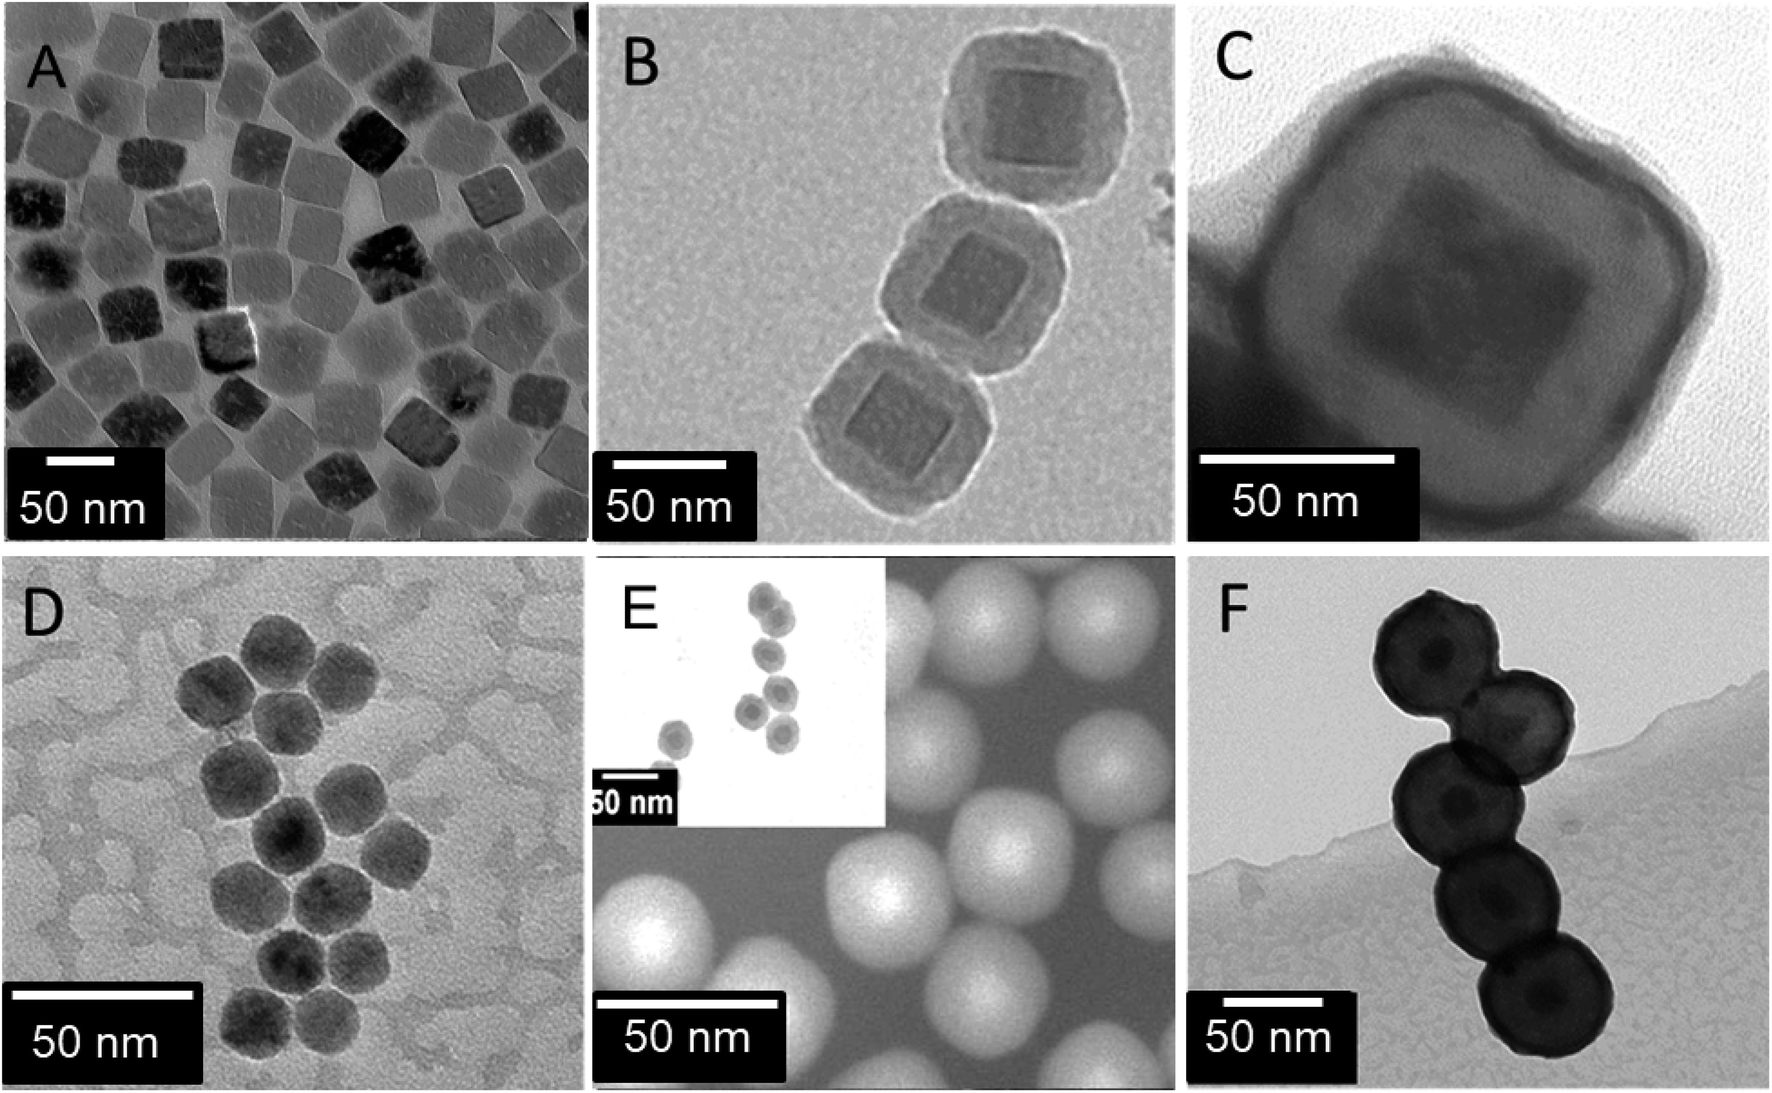 | ||
| Fig. 2 Microscopic images: (A) PVP-capped-Fe3O4 nanocubes, (B) SiO2@Fe3O4(cubes), (C) Gd2O3@SiO2@Fe3O4(cubes), (D) OA-Fe3O4 nanospheres, (E) SiO2@Fe3O4(spheres), and (F) Gd2O3@SiO2@Fe3O4(spheres). | ||
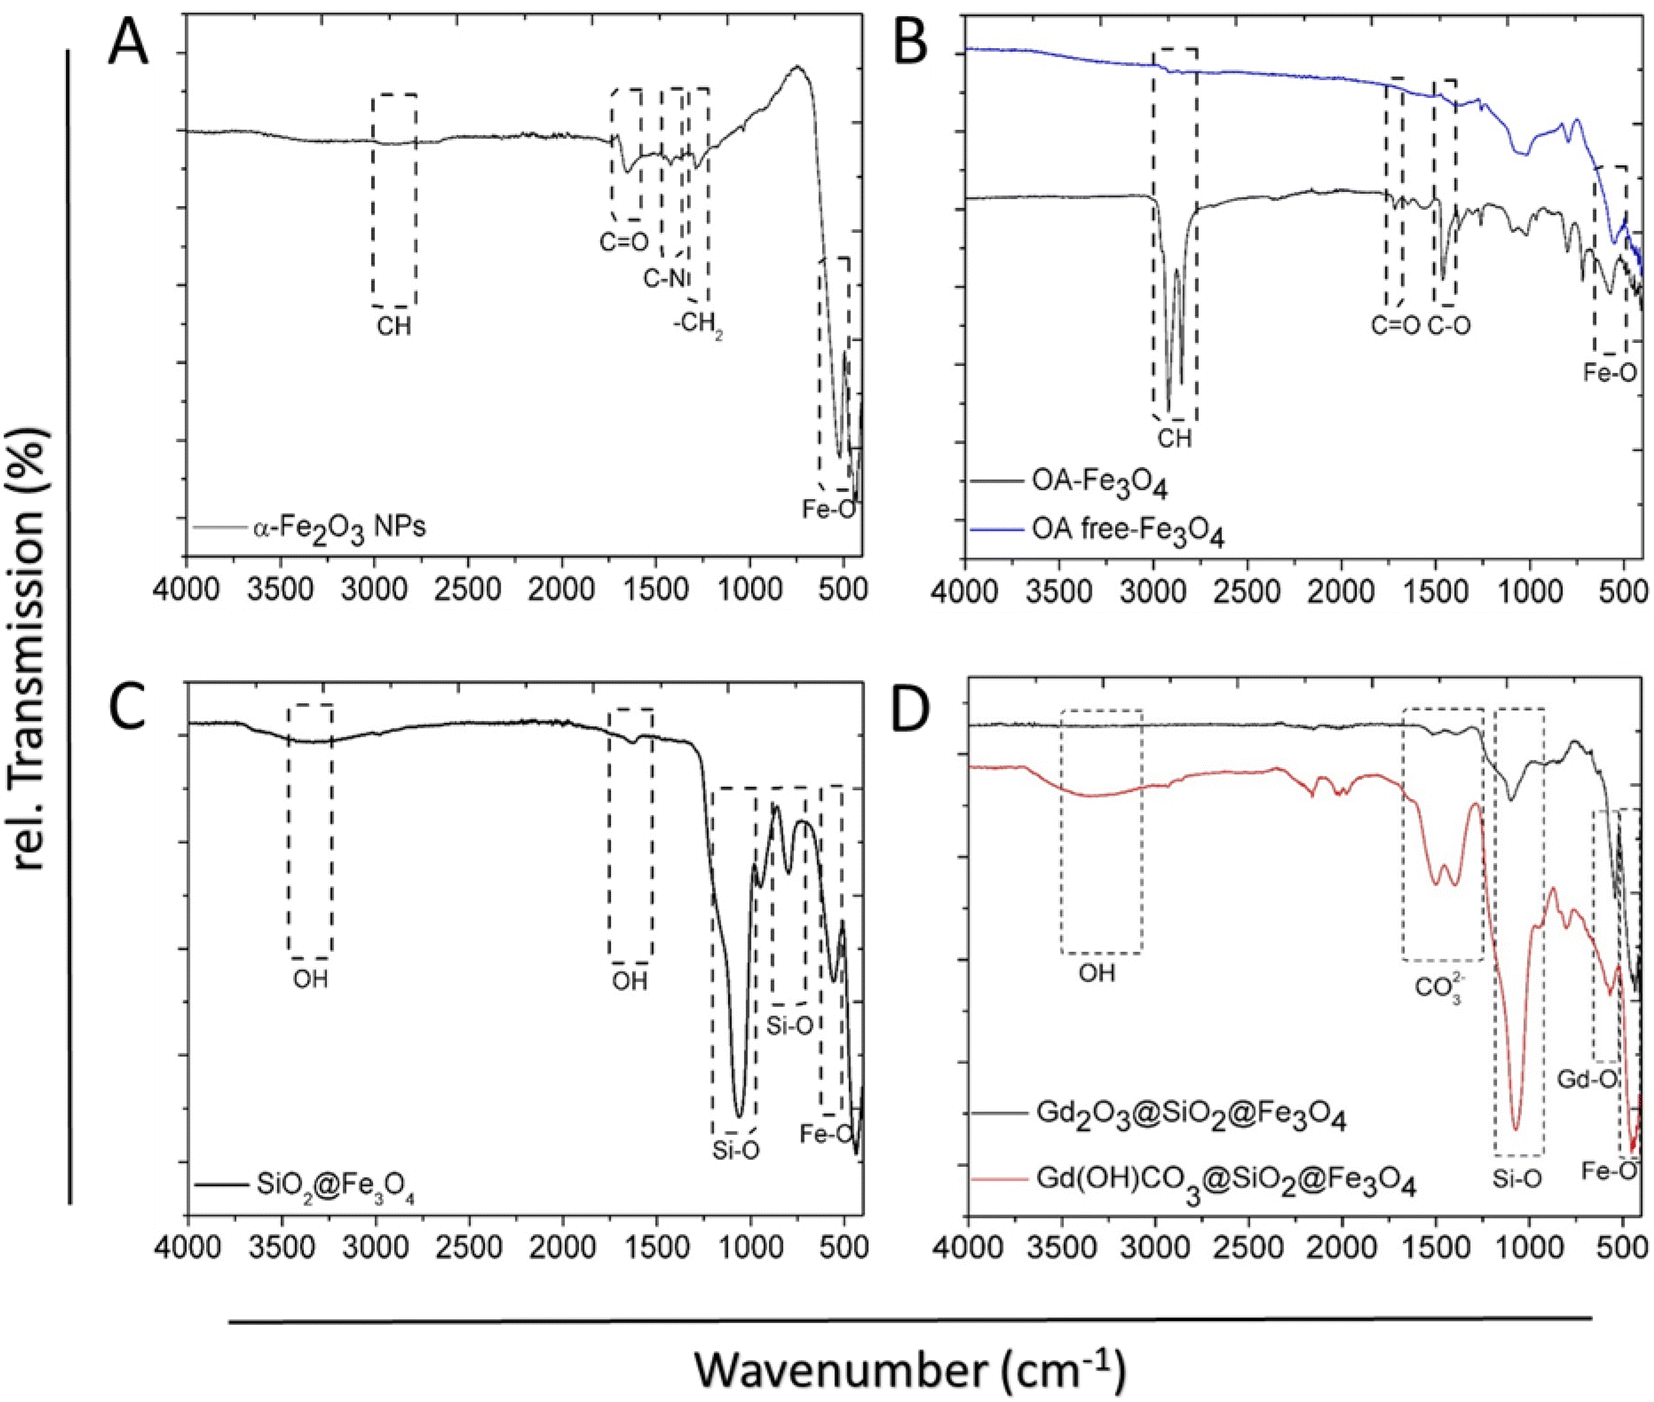
FT-IR spectra demonstrated distinct peaks of α-Fe2O3 NPs, whereas the vibration bands at 2946, 1650, 1420, and 1276 cm−1 are attributed to the CH, C![[double bond, length as m-dash]](https://www.rsc.org/images/entities/char_e001.gif) O, C–N, and –CH2, respectively, from PVP at NPs surface Fig. 3A. The strong peak at 523 cm−1 is ascribed to the Fe–O vibration of Fe2O3. The successful release of oleic acid from the surface of the NPs was confirmed by FT-IR. The spectrum of OA-Fe3O4 NPs showed the characteristic peaks which indicate the presence of the OA-capping ligands at the NPs surface (Fig. 3B).44 The peaks at 2915 cm−1 and 2845 cm−1 can be related to the asymmetric and symmetric stretching of –CH2 groups. These peaks are absent in the OA-free NPs (Fig. 3B upper). Additionally, in contrast to the OA-NPs the peaks at 1711 cm−1 and 1457 cm−1 originate from the asymmetric and symmetric –COO stretching are not observed in the OA free NPs. The band observed around 570 cm−1 in both spectra is assigned to the Fe–O vibration. Surface group analysis of SiO2@Fe3O4 provided further confirmation for the formation of SiO2 shell around Fe3O4 NPs (Fig. 3C). The broad band at 3346 cm−1 corresponds to the –OH group from silanol group at NPs surface as well as the water molecules, which can be absorbed on the surface. This band is correlated with another band at 1617 cm−1 which is attributed to deformation vibration of the water molecules. The sharp band at 1060 cm−1 can be assigned to Si–O–Si asymmetric stretching vibration and the lowest intense band at 798 cm−1 is ascribed to Si–O–Si symmetric stretching vibration. Peak at 556 cm−1 is related to the Fe–O vibration. For Gd(OH)CO3@SiO2@Fe3O4 (Fig. 3D), a strong absorption band at 1520 cm−1 arises from the vibration of CO32− group of amorphous Gd(OH)CO3 shell. In addition, the broad band at 3330 cm−1 can be assigned to the vibrations of –OH groups. A strong band at 1093 cm−1 is assigned to the Si–O–Si asymmetric stretching vibration, whereas the other band at 798 cm is attributed to the Si–O–Si symmetric stretching vibration.
O, C–N, and –CH2, respectively, from PVP at NPs surface Fig. 3A. The strong peak at 523 cm−1 is ascribed to the Fe–O vibration of Fe2O3. The successful release of oleic acid from the surface of the NPs was confirmed by FT-IR. The spectrum of OA-Fe3O4 NPs showed the characteristic peaks which indicate the presence of the OA-capping ligands at the NPs surface (Fig. 3B).44 The peaks at 2915 cm−1 and 2845 cm−1 can be related to the asymmetric and symmetric stretching of –CH2 groups. These peaks are absent in the OA-free NPs (Fig. 3B upper). Additionally, in contrast to the OA-NPs the peaks at 1711 cm−1 and 1457 cm−1 originate from the asymmetric and symmetric –COO stretching are not observed in the OA free NPs. The band observed around 570 cm−1 in both spectra is assigned to the Fe–O vibration. Surface group analysis of SiO2@Fe3O4 provided further confirmation for the formation of SiO2 shell around Fe3O4 NPs (Fig. 3C). The broad band at 3346 cm−1 corresponds to the –OH group from silanol group at NPs surface as well as the water molecules, which can be absorbed on the surface. This band is correlated with another band at 1617 cm−1 which is attributed to deformation vibration of the water molecules. The sharp band at 1060 cm−1 can be assigned to Si–O–Si asymmetric stretching vibration and the lowest intense band at 798 cm−1 is ascribed to Si–O–Si symmetric stretching vibration. Peak at 556 cm−1 is related to the Fe–O vibration. For Gd(OH)CO3@SiO2@Fe3O4 (Fig. 3D), a strong absorption band at 1520 cm−1 arises from the vibration of CO32− group of amorphous Gd(OH)CO3 shell. In addition, the broad band at 3330 cm−1 can be assigned to the vibrations of –OH groups. A strong band at 1093 cm−1 is assigned to the Si–O–Si asymmetric stretching vibration, whereas the other band at 798 cm is attributed to the Si–O–Si symmetric stretching vibration.
 | ||
| Fig. 3 FT-IR spectra of: (A) PVP-capped α-Fe2O3, (B) OA-capped Fe3O4 (black) and uncapped Fe3O4 (blue), (C) SiO2@Fe3O4, and (D) amorphous Gd(OH)CO3 shell of the precursor, and successful conversion to crystalline Gd2O3 layer after calcination. | ||
From the spectra of Gd2O3@SiO2@Fe3O4, the intensity of characteristic bands of Gd(OH)CO3 amorphous shell remarkably decreased after calcination (Fig. 3D). The two intense absorption bands located at 544 and 445 cm−1 are accounting for Gd–O stretching vibration of the Gd2O3 layer and Fe–O vibration of Fe3O4 core, respectively. The FT-IR studies provided further evidence that the amorphous Gd(OH)CO3 shell can be efficiently converted to Gd2O3 during the calcination process, which is consistent with the results obtained from XRD and EDX.
The magnetic measurements of the SiO2@Fe3O4 and Gd2O3@SiO2@Fe3O4 carriers showed an effect on the magnetic behavior of the SiO2@Fe3O4 NPs after the coating of Gd2O3 layer to the composite material (Fig. 4). There is a distinct separation of field-cooled (FC) and zero field-cooled (ZFC) curves, as expected for the superparamagnetic behavior of the Fe3O4 cores (Fig. 4B). The diversion of FC and ZFC curves starts already at 270 K, and agree with the high temperature maximum of both curves. Although the signal is relatively weak, the behavior is mimicking that of pure Fe3O4 NPs,26 however, there is an additional “tail” at lower temperatures in both FC and ZFC curves, indicating the presence of the paramagnetic Gd-moments. Moreover, there is no clear blocking temperature, as was observed at about 120 K for the composite SiO2@Fe3O4 material without the Gd2O3 shell (Fig. 4A).33 The room-temperature magnetization (inset Fig. 4B) can be explained by a superparamagnetic part, which is saturated already at low fields, and a paramagnetic part, causing a linear increase with field on top of the saturation part. The absolute signal is also significantly small per gram, here ∼7 as compared to about ∼35 emu g−1 for SiO2@Fe3O4, which is due to the relatively high density and, thus, the absolute weight of Gd2O3 relative to SiO2@Fe3O4. The addition of Gd2O3 to the SiO2@Fe3O4 composite adds a paramagnetic component across the whole measured temperature range and seems to prevent a clear magnetic blocking to occur between the Fe3O4 cores. Hence, the paramagnetic Gd2O3 shell seems to screen the core ferromagnetic moment of Fe3O4. This perhaps allows the magnetic NPs to act more like individual entities.
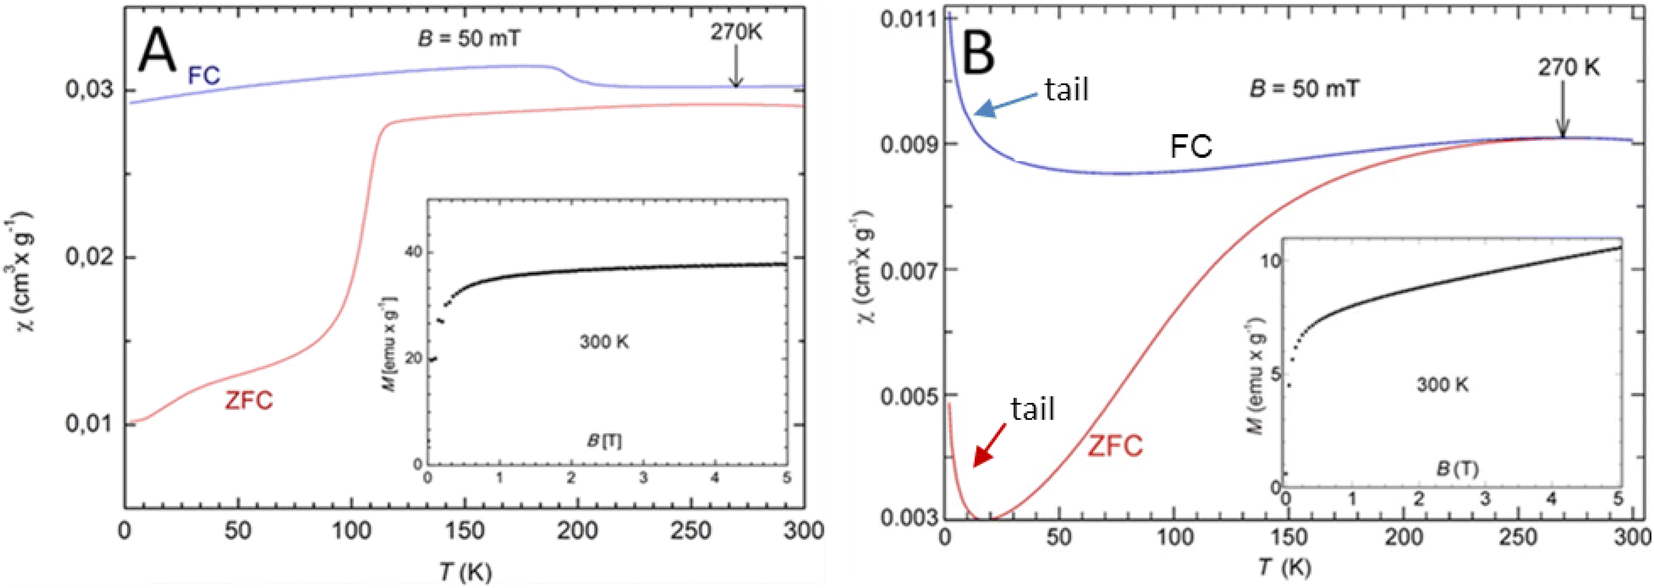 | ||
| Fig. 4 Temperature dependent magnetic susceptibility (χ) of: (A) SiO2@Fe3O4 and (B) Gd2O3@SiO2@Fe3O4 and its field dependent magnetization (M) at 300 K (inset). All data are normalized to the sample mass in g. FC (field cooled) and zero field-cooled (ZFC) data are presented and they superimpose only above the marked 270 K. | ||
The efficiency of the surface-functionalized nanocarriers in biological systems is influenced by the physical and chemical nature of the surface-attached groups.26,46,47 Since both carriers contain a thin gadolinium oxide layer, only the multilayer Gd2O3@SiO2@Fe3O4 with cube-based nanocarriers were extended for chemical conjugation strategies to prove the conjugation concept. The Gd2O3@SiO2@Fe3O4 were modified with APTMS molecules to offer free amino (–NH2) groups. Attachment of APTMS not only provided free amino groups for further ligand conjugation, nevertheless also offered better safety to Gd2O3@SiO2@Fe3O4 nanocarriers evident from toxicity assay. It reveals the coverage of the Gd2O3 surface with silane linkers, could prevent its direct exposure to the cells. FT-IR analysis demonstrated the binding of APTMS groups on Gd2O3@SiO2@Fe3O4 surface evident in the increased intensity of Si–O–Si band at 1093 cm−1, when compared to bare particles (Fig. 5A). The peaks at 1687 and 1380 cm−1 belonged to the –NH bending and C–N stretching vibrations, respectively, whereas the minor peak at 2933 cm−1 is attributed C–H vibrations. Surface modification of the as-developed carriers with estrogen molecule (17α-ethynylestradiol) was carried out via click chemistry approach.48 As a first step of click-functionalization sequences, 6-bromohexanoic acid molecules were covalently binded to the surface of particles by DCC/NHS carbodiimide chemistry at 60 °C. The carboxylic groups were activated by the addition of coupling reagent dicyclohexylcarbodiimide (DCC) to create amine-reactive O-acylisourea ester. Following, the activated carboxylic acid were readily reacted with amino groups at the NPs surface to afford bromo groups on nanoparticles (–Br@NPs), Fig. 5B. After bromohexanoic acid attachment on particles, the FTIR spectrum showed a strong band due to CO vibration at 1717 cm−1, and the stretching vibrations of the C–H at 2965–2850 cm−1 indicating the successful on surface attachment of the bromo-acid (Fig. 5B). Subsequently, the bromide-terminated NPs were substituted with azide groups (–N3) in a nucleophilic substitution SN2 reaction with sodium azide. The absorption band at 2099 cm−1 corresponds to the –N3 stretching vibrational mode verified the conjugation of 6-azido-hexanoate on the surface of particles (Fig. 5C).49,50 The absorption band at 2990 cm−1 owing to the C–H vibration mode showed that the bromine precursor maintained its properties on the surface without any degradation. Successful immobilization of estrogen molecule onto the N3@NPs surface was accomplished by an azide–alkyne cycloaddition reaction.51 In Fig. 5D the characteristic peak of the azide vibration is completely vanished, while new absorption bands at 1624 and 1440 cm−1 owing to triazole ring appeared, demonstrating the completion of click reaction on NPs surface.52 All FT-IR spectra for the modified core shell NPs demonstrated the vibration bands of the Si–O, Gd–O, and Fe–O suggesting the unchanged configuration and structure of the core shell NPs.
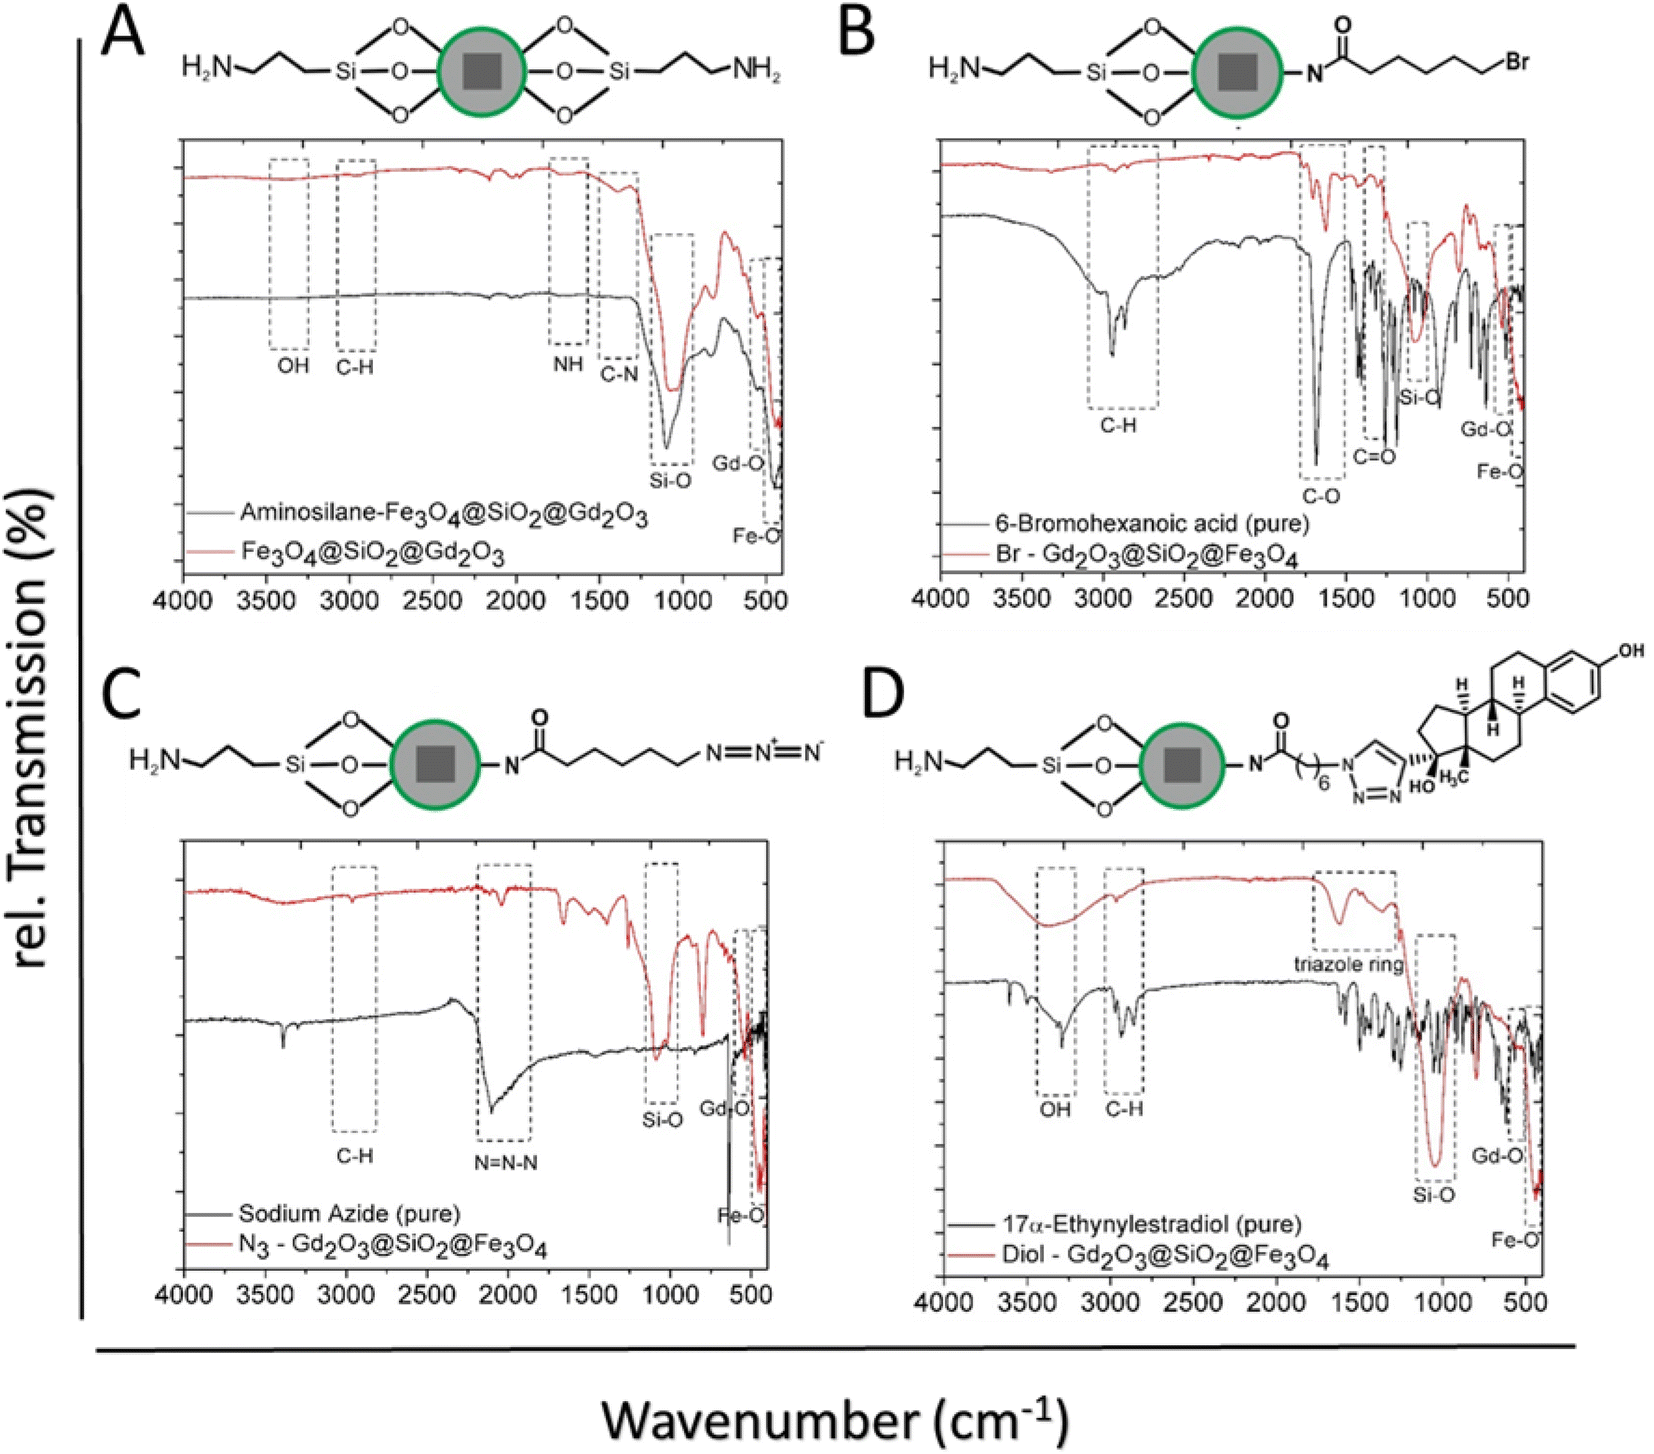 | ||
| Fig. 5 The FTIR-spectra of: (A) APTMS-capped Gd2O3@SiO2@Fe3O4 NPs, (B) attachment of the bromooctanoic acid to the surface, (C) attachment of azide groups, and (D) click chemistry between 17a-ethynylestradiol and the azide-terminated Gd2O3@SiO2@Fe3O4 NPs. | ||
Moreover, the XRD pattern of estrogen-Gd2O3@SiO2@Fe3O4 carriers that the crystallinity of the material did not change during click modification (Fig. S5†).
To evaluate the average hydrodynamic radius of bare and surface functionalized nanocarriers, dynamic light scattering measurements were conducted at pH 7.0 in water. APTMS-Gd2O3@SiO2@Fe3O4 showed an average hydrodynamic diameter of 259 ± 11 which is larger than the diameter shown by bare Gd2O3@SiO2@Fe3O4 indicating a change on the surface of particles after APTMS conjugation. Nanocarriers showed a further increase in hydrodynamic diameter of particles due to the binding of additional molecules including bromo and estrogen onto the surface (Table S1†). To evaluate the average surface charge of the bare and surface functionalized nanocarriers, zeta potential measurements were conducted at pH 7.0 in water. Bare Gd2O3@SiO2@Fe3O4 exhibited a negative value of −10.1 mV due to the presence of hydroxyl groups on bare surface. After amino silane coupling, these values moved to +11.6 mV, ascribed to the positive charge from protonated amine groups in aqueous solution. After bromo and estrogen conjugation to these carriers, the surface charge showed a huge shift to −13.0 mV and −15.8 mV respectively due to the consumption of amino groups during carbodiimide coupling reaction between –NH2 capped nanocarriers and bromo hexanoic acid (bromo: more electron density).
The thermal degradation behaviour of the bare, intermediate steps and estrogen-functionalized Gd2O3@SiO2@Fe3O4 carriers were observed using thermogravimetric (TGA) measurements in the temperature range of 30–900 °C at a heating rate of 10 °C min−1 under the flow of nitrogen. TGA analysis showed that bare Gd2O3@SiO2@Fe3O4 particles are stable up to 300 °C. At this decomposition temperature, the total mass loss is 6% which could be attributed to evaporation of the residual adsorbed solvent and water molecules on the Gd2O3@SiO2@Fe3O4 particles. APTMS-capped Gd2O3@SiO2@Fe3O4 carriers showed a mass loss of in two steps. After solvent evaporation at 250 °C, the results show approximately 5% mass loss followed by second mass loss of 24% (with a total of loss of 31%), occurred in the temperature window from 250 to 900 °C which is much higher than that of bare Gd2O3@SiO2@Fe3O4 particles. This increase in mass loss can be attributed to the thermal decomposition of the surface-grafted aminosilane (APTMS) molecules (Fig. 6B). After surface modification with 6-bromohexanoic acid, the Br-conjugated Gd2O3@SiO2@Fe3O4 particles showed a total mass loss of 28%. At initial decomposition temperature of 300 °C, a mass loss of 6% occurred due to the removal of adsorbed solvent molecules. The other mass loss of 22% from 300 to 900 °C displayed the decomposition of bromo group related content i.e., alkyl chain and amide bond (Fig. 6C). Thermal degradation of N3-conjugated Gd2O3@SiO2@Fe3O4 particles demonstrated a total mass loss of 18% (Fig. 6D) for the removal of azide group related content. The deviation in results as compared to Br-conjugated Gd2O3@SiO2@Fe3O4 particles can be attributed to the different amount of NPs that present in the measured sample as well as the size distribution of NPs. After grafting 17α-Ethynylestradiol on Gd2O3@SiO2@Fe3O4 surface, the larger mass loss of 40% in three steps was the consequence of the thermal decomposition of all molecules including 17α-ethynylestradiol.
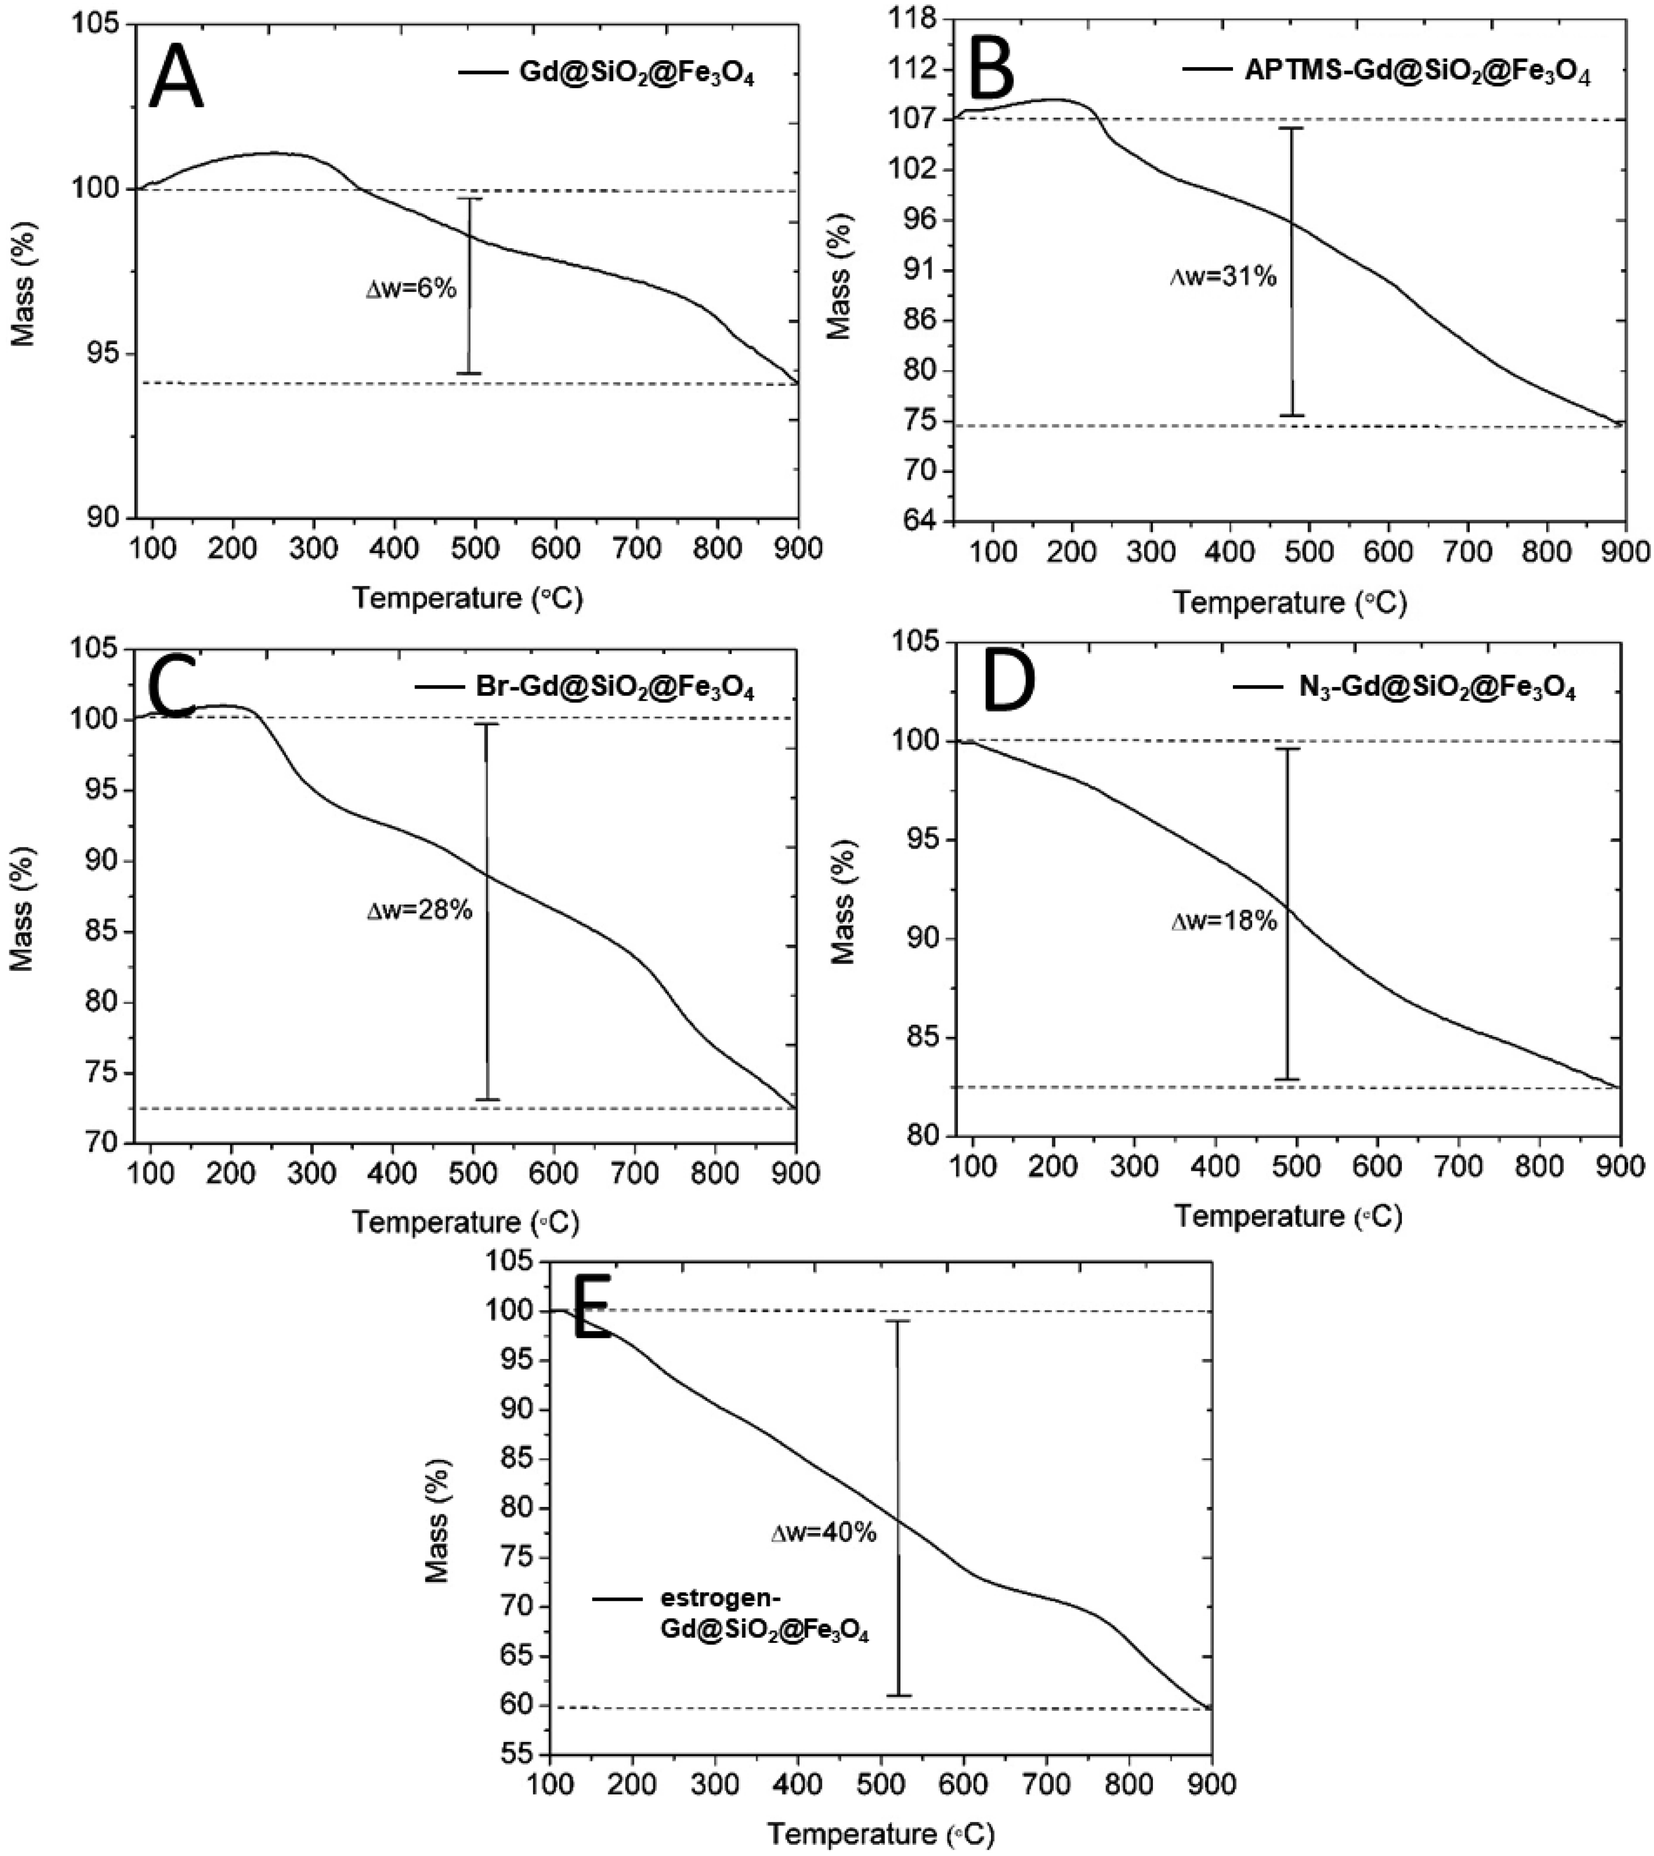 | ||
| Fig. 6 Thermogravimetric analysis of the different synthetic steps of nanocarrier's functionalization: (A) bare Gd2O3@SiO2@Fe3O4, (B) APTMS/NH2-Gd2O3@SiO2@Fe3O4, (C) Br–Gd2O3@SiO2@Fe3O4, (D) N3–Gd2O3@SiO2@Fe3O4, and (E) estrogen-Gd2O3@SiO2@Fe3O4. The initial increase of mass in the range from 0–300 °C in (A), (B) and (C) can be due to the minor fluctuation of the weighing balance of the machine due to the background noise. | ||
Quantification of active primary amines on the surface of nanocarriers
The fluorescamine molecule based approach was chosen to quantify the active amino group on the surface of functional nanocarriers.45a Precisely, fluorescamine is not UV-visible active on its own but when reacts with primary amine groups it forms a product which gives an absorbance at a wavelength of 384 nm under UV-visible radiation.45b Moreover, the unreacted fluorescamine hydrolyzes in the presence of water and produces non UV-visible active molecules and this feature makes this approach more accurate and reliable, Scheme 2.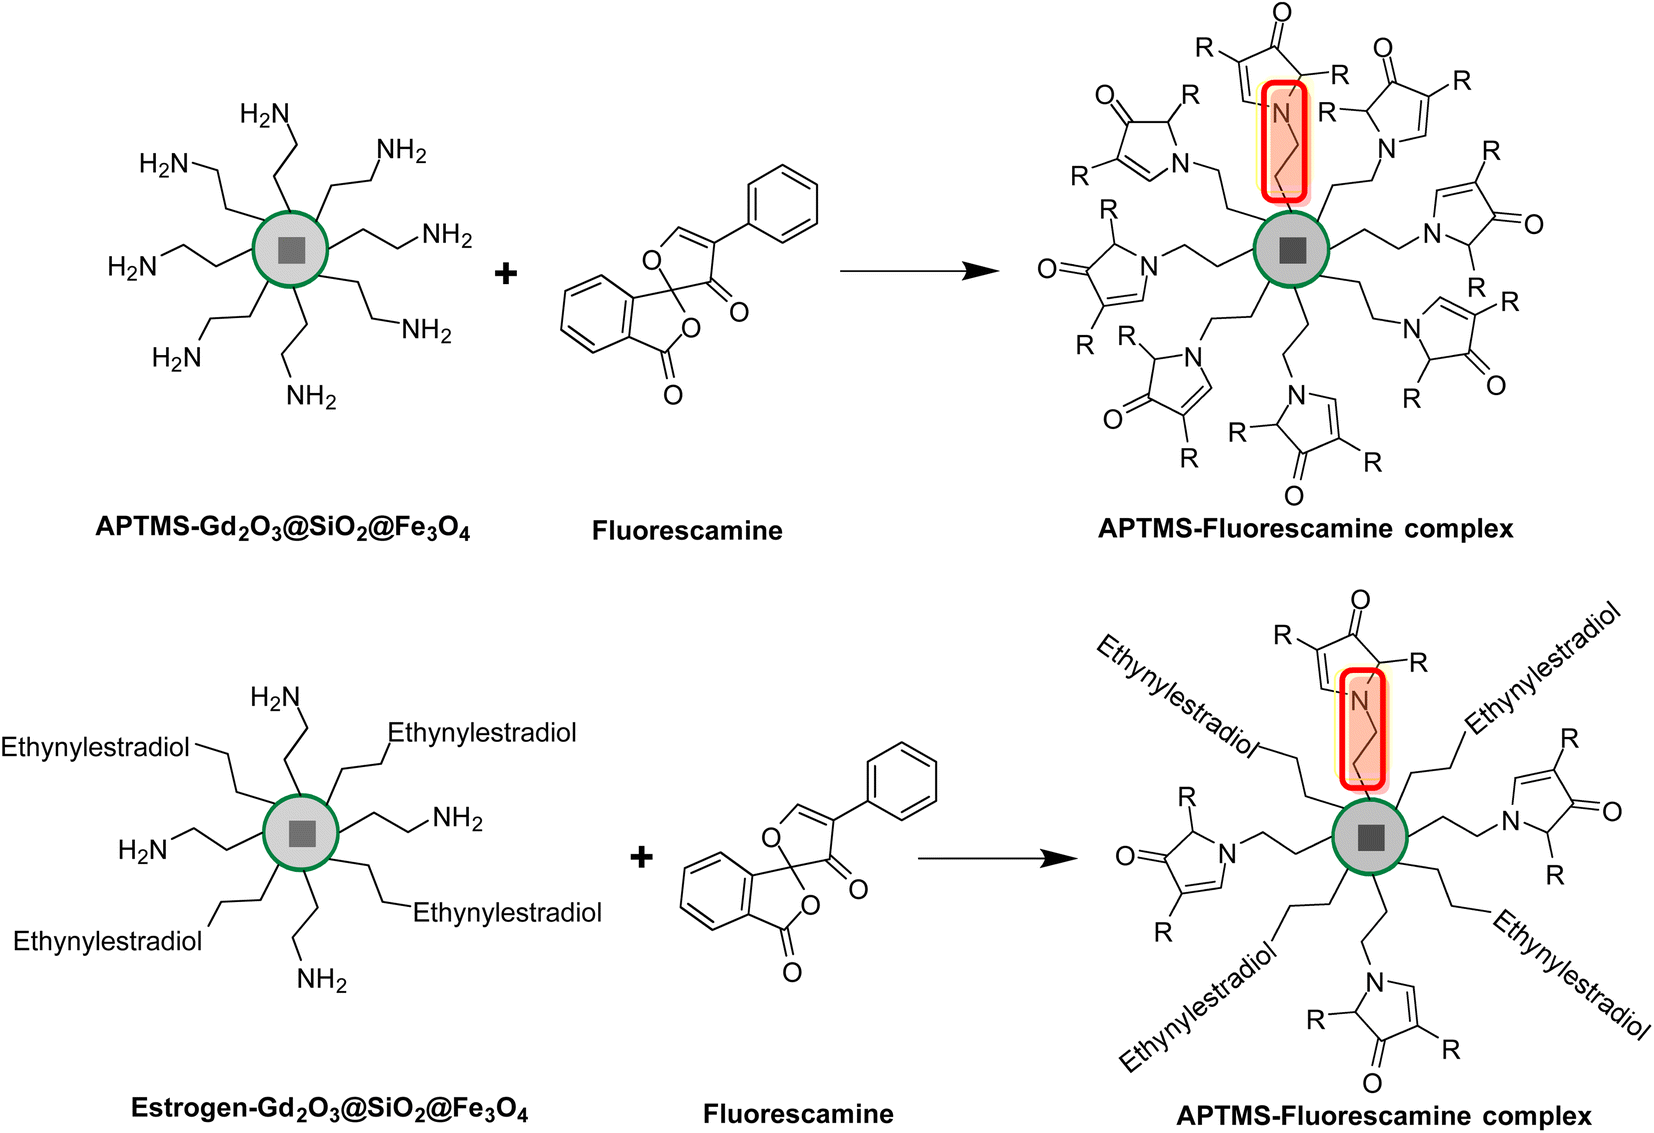 | ||
| Scheme 2 The fluorescamine molecule based approach for the quantification of active amino groups on the surface of nanocarriers before and after the conjugation of estrogen molecules. | ||
To calibrate this approach, the experiments were conducted with pure APTMS at its various concentrations using a constant amount of fluorescamine (stock solution: 1 mg fluorescamine/1 ml acetonitrile). The pure APTMS samples were measured by applying UV-vis spectroscopy in which the absorption of spectra generated at given wavelengths can be linked directly to the concentration of the sample, Table 1.
| APTMS (μl) | APTMS concentration (μg) | No of moles APTMS | Molar concentration | Absorbance (a.u.) |
|---|---|---|---|---|
| 5.84 | 60 | 3.3 × 10⁻⁷ | 3.28 × 10⁻⁷ | 0.50971 |
| 25.33 | 260 | 1.4 × 10⁻⁶ | 1.36 × 10⁻⁶ | 1.32234 |
| 35.08 | 360 | 2.0 × 10⁻⁶ | 1.9 × 10⁻⁶ | 1.62892 |
| 44.83 | 460 | 2.5 × 10⁻⁶ | 2.39 × 10⁻⁶ | 2.20854 |
| 54.57 | 560 | 3.1 × 10⁻⁶ | 2.93 × 10⁻⁶ | 2.75921 |
Based on the values, amino capped-Gd2O3@SiO2@Fe3O4 and estrogen-coated Gd2O3@SiO2@Fe3O4 nanocarriers were evaluated for the quantification of active surface amino ligands. Active amino groups were quantified with reference to the calibration curve using different concentration of APTMS with 50 μl of fluorescamine from the stock solution. Nanocarriers functionalized with APTMS molecules showed a peak at λmax 390 nm with absorbance of 1.36 (Fig. 7C), whereas, the same amount of estrogen-capped carriers showed a peak at 390 nm with absorbance of 0.597. Table 2 (Experimental section) provides details of the quantification readout in which it can be observed that the decrease in the absorbance indicated the presence of less active amino group on the surface of estrogen capped Gd2O3@SiO2@Fe3O4 nanocarriers compared to the APTMS functionalized nanocarrier.
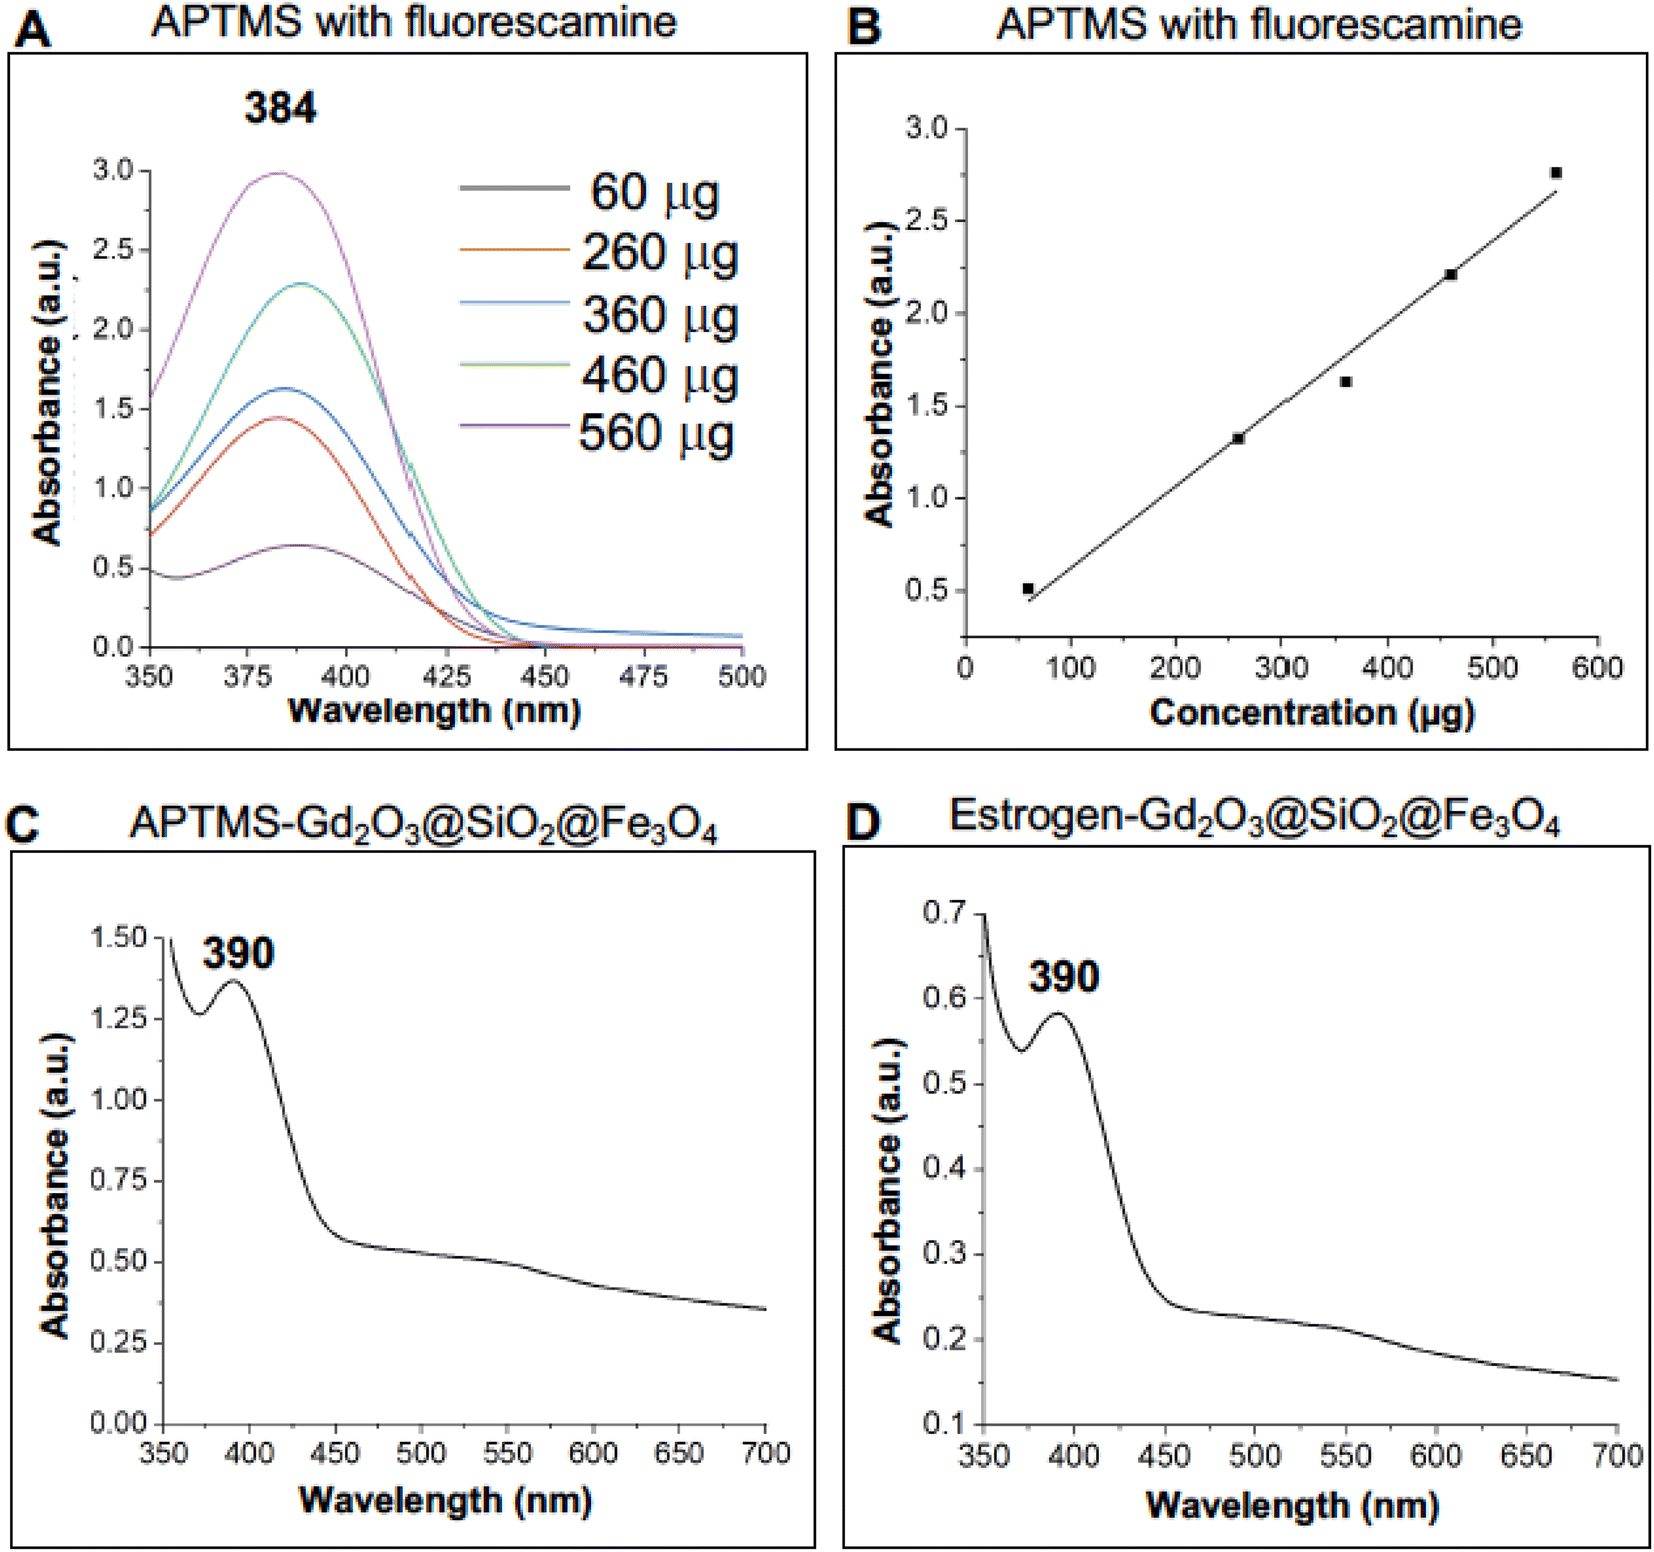 | ||
| Fig. 7 Quantification of active amino groups on the surface of gadolinium based functionalized nanocarriers: (A and B) UV-visible spectra and relevant calibration curve for the quantification of pure APTMS using fluorescamine molecules. (C and D) Determination of amino groups on APTMS-Gd2O3@SiO2@Fe3O4 and estrogen-Gd2O3@SiO2@Fe3O4 nanocarriers. | ||
| Nanocarriers | Absorbance(a.u.) | Concentrationa (μg) of active amino group | No. of molesb of active amino group | Molar concentrationc | No. of moleculed of active amino group |
|---|---|---|---|---|---|
| a Concentration of active amino groups on the surface of nanocarriers was calculated using slope formula.b No of moles = concentration (in grams)/molar mass of APTMS.c Molar concentration = no of moles/1.050 ml.d No of molecules was calculated by multiplying the no of moles with avogadro's number. | |||||
| APTMS@SiO2@Fe3O4 (2 mg) | 1.36 | 266 | 1.48 × 10⁻⁶ | 1.409 × 10⁻⁶ | 8.9 × 10¹⁷ |
| Estrogen-capped Gd2O3@SiO2@Fe3O4 (2 mg) | 0.597 | 94 | 5.2 × 10⁻⁷ | 4.95 × 10⁻⁷ | 3 × 10¹⁷ |
Since the well-known toxic effect of Gd3+-chelate compounds and Gd2O3-NP are inhibiting their application in vitro and in vivo, the biocompatibility of the bare Gd2O3@SiO2@Fe3O4 and APTMS-capped Gd2O3@SiO2@Fe3O4 was verified using as model cell-line HEK 293 (Fig. 8). Hemmer et al. showed that by appropriate surface functionalization, the interaction of ion leaching can be reduced which offers reduced toxicity and enhanced biocompatibility.36 For as-synthesized bare particles showed some toxic effect to the cells (cell viability: 70%) after 48 h with 50 μg ml−1 NPs concentration (Fig. 8A). However, APTMS modification on these carriers offered notable cell viability. The molecules attachment on the surface of Gd2O3 shell, forming a protective layer on the overall core shell structure which renders its direct exposure to the cells (Fig. 8B). A minor decrease in viability of cells (78%) was observed when cells were exposed to nanocarriers with a maximum concentration of 100 μg ml−1. The results are comparable to the applied concentration in reported MRI studies, declaring that the APTMS-coating on gadolinium based carrier's offers biocompatibility and decreased toxicity for cells.
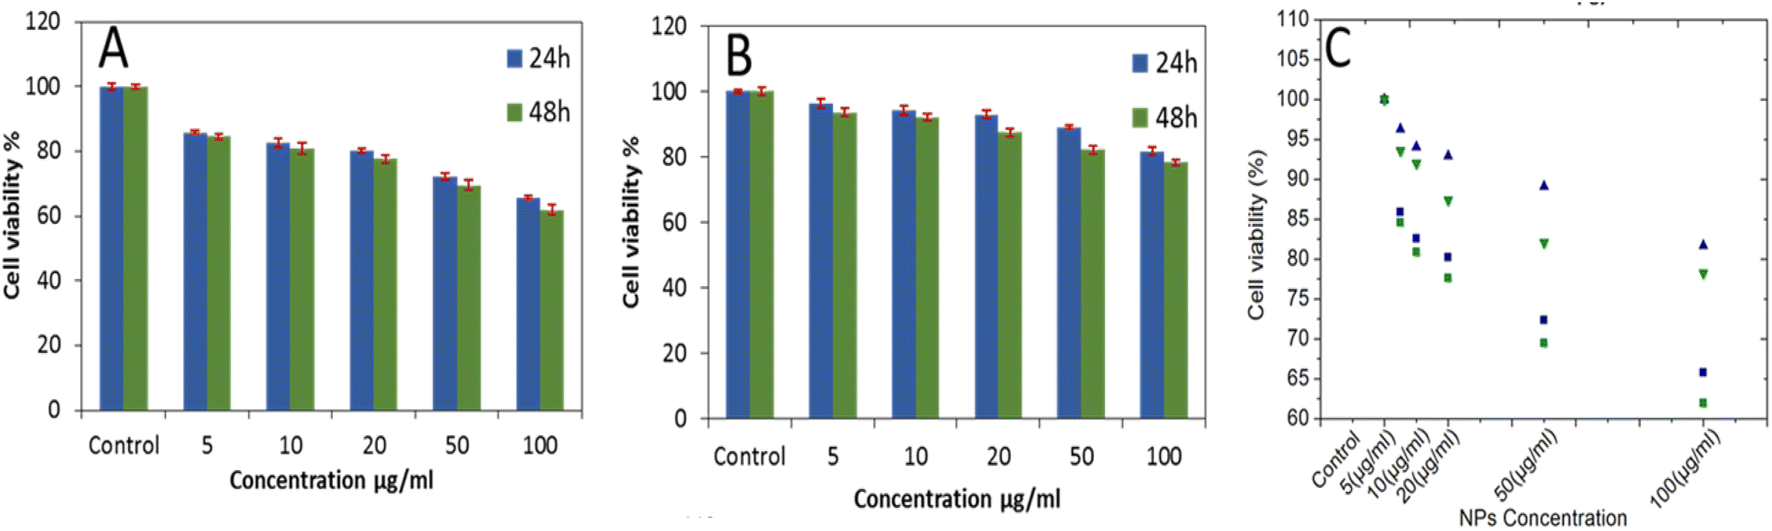 | ||
| Fig. 8 In vitro cell viability data of cultured HEK 293 cells after incubation with: (A) bare Gd2O3@SiO2@Fe3O4, and (B) APTMS-capped Gd2O3@SiO2@Fe3O4, using standard MTT colorimetric assay (C) comparison of the cell viability assay: the square symbols indicate cell viabilities measured for bare Gd2O3@SiO2@Fe3O4 and the triangle symbols for APTMS-capped Gd2O3@SiO2@Fe3O4, viabilities after 24 and 48 h of incubation are shown in blue and green, respectively. | ||
Radiolabeling assessment of DOTA-conjugated estrogen-Gd2O3@SiO2@Fe3O4 nanocarriers
To assess the imaging capabilities of as-synthesized core shell nanocarriers, we have developed an efficient radiolabeling procedure using 68Ga which can be followed through radiation detection as a result of radioactive decay.53 To determine radioactive labeling yields, we used instant radio thin layer chromatography (ITLC) following APTMS-Gd2O3@SiO2@Fe3O4 and estrogen-Gd2O3@SiO2@Fe3O4 nanocarriers. The available amino groups at the carrier's surface provided the binding of p-SCN-Bn-DOTA through isothiocyanate linkage. Subsequently, radiolabeling experiments were conducted using 68Ga considering its incorporation to the vicinity of DOTA chelator. As the half life time of 68Ga radionuclide is 68 min, all experiments were performed for a maximum incorporation time of 60 min. Fig. 9 shows the TLC graph for the radiolabeling efficacy of 68Ga-DOTA conjugated carriers. In both samples, the radiolabeling profile exhibited two different regions, the high intensity peak which correspond to the 68Ga-DOTA nanocarriers, and the low intense peak for the unbound 68Ga radionuclide. Radiochemical Yield (RCY) was estimated to be 80% for APTMS-Gd2O3@SiO2@Fe3O4 (Figure 9A) and 70% for estrogen-Gd2O3@SiO2@Fe3O4 nanocarriers (Fig. 9B). The expected variance of radiochemical yield for both nanocarriers can be explained by the insufficient remaining –NH2 groups on the surface of estrogen-Gd2O3@SiO2@Fe3O4 carriers.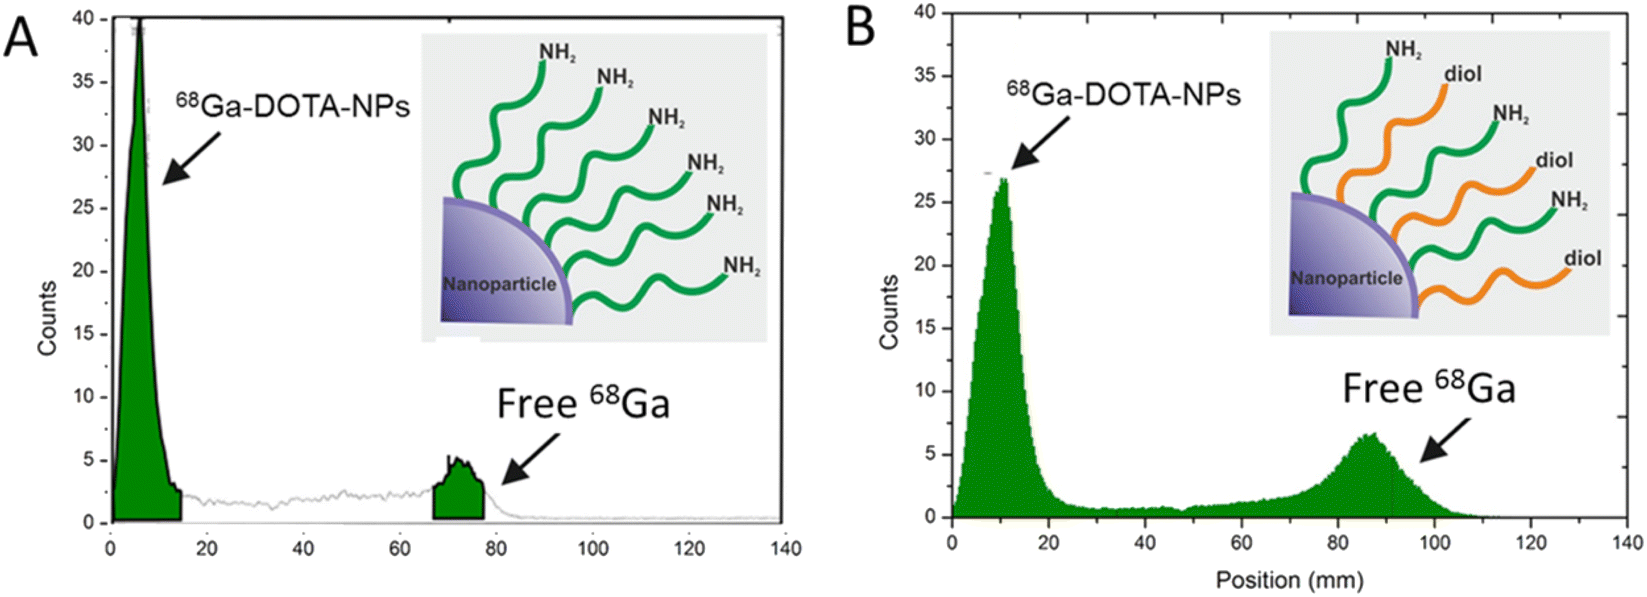 | ||
| Fig. 9 TLC chromatogram of: (A) APTMS-Gd2O3@SiO2@Fe3O4 after radiolabeling with 68Ga and (B) APTMS-estrogen Gd2O3@SiO2@Fe3O4 carriers after radiolabeling with 68Ga. The radiolabeling was performed under slight acidic conditions incubating particles for 15 min at 95 °C. The radiochemical yield was determined by thin layer chromatography (ITLC). No peak was observed for free chelator molecules indicating the covalent binding of the DOTA molecule to the estrogen-capped APTMS-Gd2O3@SiO2@Fe3O4 nanocarries.54 | ||
These amino groups are required for DOTA binding at the particle surface. Due to their consumption during carbodiimide crosslinking, the estrogen-Gd2O3@SiO2@Fe3O4 carriers are expected to have fewer active amino groups for chelator coupling as compared to APTMS-Gd2O3@SiO2@Fe3O4 particles. Therefore, less number of DOTA ligands might be available for 68Ga incorporation, resulting in a lower radiolabeling yield. In general, DOTA ligands are specific and efficient chelating agents for Gd3+ ions. It has been reported that the DOTA ligand has a high affinity to coordinate with Gd3+, while NODAGA (2-[1,4,7-triazacyclononan-1-yl-4,7-bis(tBu-ester)]-1,5-pentanedioic acid) ligands have a high affinity for 68Ga. Moreover, gallium complex must be stable enough to avoid trans-chelation. Thus, a possible competition among Gd3+ and Ga3+ ions for coordinating the DOTA ligands cannot be ruled out in the solutions, which can consequently reduce the RCY. For the labeling experiment, we used a specific activity of 12.8 MBq per microgram (32 MBq per 2.5 microgram), which agrees very well with the values reported for the specific activity of PET probe.
Cellular uptake of estrogen-Gd2O3@SiO2@Fe3O4 nanocarriers
Cell uptake of Gd2O3@SiO2@Fe3O4 and estrogen-Gd2O3@SiO2@Fe3O4 nanocarriers was investigated with confocal microscopy and flow cytometry measurements using MCF7 breast cancer cell-line (in vitro). Before their testing with cancer cells, the carriers were coupled with FITC to track their localization. Confocal imaging was performed in a time dependent manner for 1, 6 and 24 h, Fig. 10. In case of nanocarriers without ligand, it can be observed that even after 24 h only a low amount of Gd2O3@SiO2@Fe3O4 carriers are taken up by BC cells and typically located in the intercellular area (Fig. 10 upper image). In case of estrogen-Gd2O3@SiO2@Fe3O4 carriers, time dependent higher amount of particles is observed. After 24 h the nanocarriers accumulated in the intracellular spaces and are located next to the cell nucleus in the cytoplasm. Flow cytometry measurements were performed with Gd2O3@SiO2@Fe3O4 and estrogen-Gd2O3@SiO2@Fe3O4 using MCF-7 breast cancer cell line. Here, Gd2O3@SiO2@Fe3O4 and cancer cells without particles were considered as control samples, (Fig. S7†). To investigate concentration and time dependent call uptake, cancer cells were incubated with 3 different concentrations of NPs (0.1 μg ml−1, 0.2 μg ml−1 and 0.02 μg ml−1) following the investigation of cellular with 3 time periods of 1, 6 and 24 hours. Based on the negatively charged cell membrane and positively charged APTMs-capped nanocarriers, the particles stack randomly with cancer cells by electrostatically interaction leading to a cellular uptake of over 99% for all tested time periods (1 h, 6 h, and 24 h) as well as all tested concentrations. Only in case of an incubation time for 1 h and 6 h at a concentration of 0.02 μg ml−1, the NPs exhibited an uptake between 74% and 85% respectively, Fig. S7.† The estrogen Gd2O3@SiO2@Fe3O4 showed reduced cellular uptake for all tested time periods, however, in a concentration dependent manner (Fig. 10 lower image) (possibly due to its negative surface charge). For a concentration of 0.02 μg ml−1 during 1 h, nearly no nanoparticles were taken up or stack on cancer cell membrane, illustrating the influence of surface charge of nanoparticles. When estrogen Gd2O3@SiO2@Fe3O4 carriers were incubated with an increased concentration of 0.1 μg ml−1 and 0.2 μg ml−1, the probes showed increasing trends for cell uptake within the first hour of incubation. Over time, the cellular uptake increased due to the affinity of 17α-ethynylestradiol molecules to estrogen receptors indicating receptor mediated cell uptake. The slow cell uptake over a longer period of time, which can be observed in naked nanocarriers and control samples and must be taken into account, is also striking. However, an optimal ratio between randomly (non-specific) and specific cellular uptake was achieved at a concentration of 0.1 μg ml−1. Under these conditions, 20% of all cells took up at least one NP within the first hour. After 6 hours, cellular uptake increased to 85% and after 24 hours to 93%. Thus, estrogen-conjugated carriers showed slower but specific cellular uptake within 24 hours compared to carriers without a targeting molecule. Remarkably, any cancer cell that took up at least one NP resulted in a positive signal.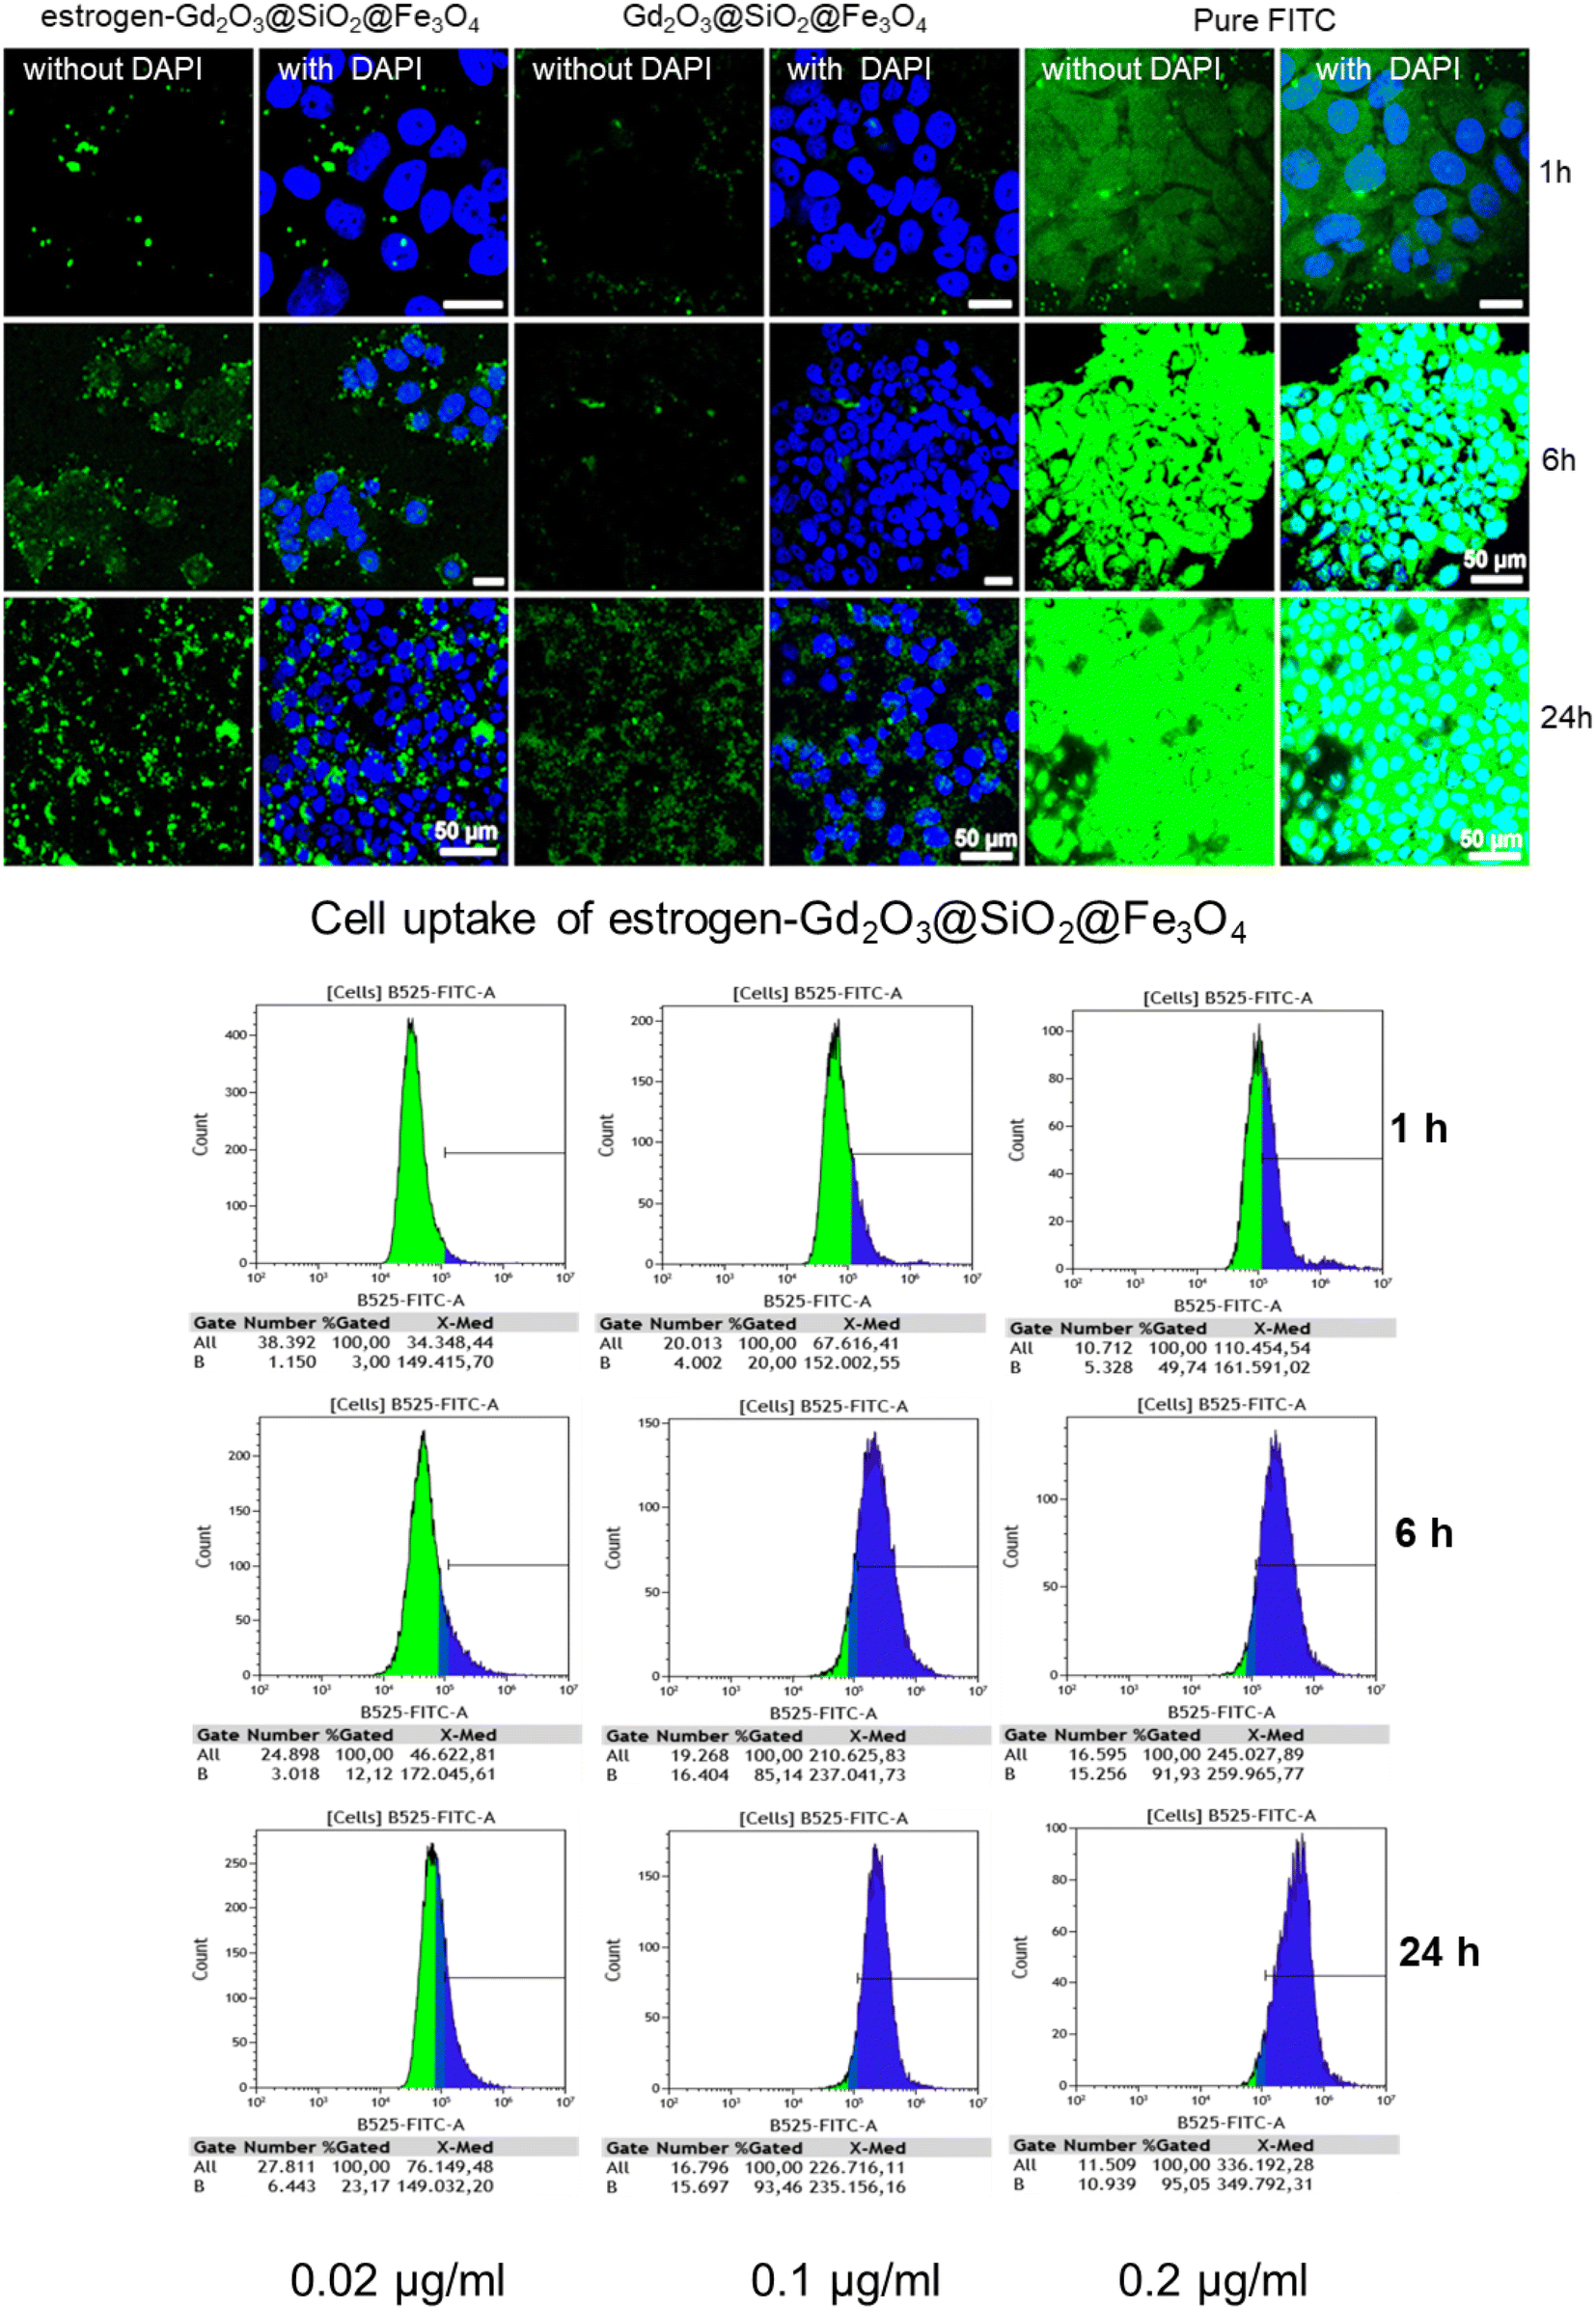 | ||
| Fig. 10 Cell uptake measured by confocal microscopy (upper image) followed by flow cytometry (lower image) using Gd2O3@SiO2@Fe3O4 and estrogen-Gd2O3@SiO2@Fe3O4: estrogen-Gd2O3@SiO2@Fe3O4 exhibited intracellular localization. Confocal laser scanning microscopy showed that nanocarriers has been internalized in cancer cells. MCF-7 cells were incubated with the equivalent concentration of nanocarriers for different time frames, 1 h, 6 h and 24 h. Incubation with estrogen-Gd2O3@SiO2@Fe3O4, bare Gd2O3@SiO2@Fe3O4 and pure FITC were evaluated. Cells were incubated (30 min) with 4′,6-diamidino-2′-phenylindole (DAPI) to give visibility to the nuclei (blue) and FITC is indicated by green fluorescence. Scale bar in each image is 50 μm. The nanocarriers were incubated with MCF7 cells lines. The cell uptake is investigated under the influence of different incubation time and nanocarriers concentration. | ||
Conclusion
Layer by layer chemical method is a versatile approach to develop new core–shell design and structure of nanocarriers such as Gd2O3 based SiO2@Fe3O4. The as-developed carriers offer covalent attachment of more than one ligands quantitatively, on their surface, capable of individually addressing their targets in physiological environment on a single carrier system. In addition, binding the surface Gd2O3 thin layer with silane precursors enables biocompatibility and offer less toxicity to cells. Surface change and active ligands are decisive factors a significant increase in cellular uptake of particles, suggesting receptor-mediated endocytosis in MCF-7 cancer cell lines. The appropriate radiolabeling yield with 68Ga demonstrate its potential as diagnostic nanocarriers for breast cancer research. The developed nanocarriers could be promising dual-contrast agent for T1 & T2 MRI and PET imaging expending different radionuclides.Experimental section
Materials
Gadolinium(III) nitrate hexahydrate (Gd(NO3)·6H2O), iron(III)nitrate nonahydrate (Fe-(NO3)3·9H2O), ammonium hydroxide solution (28–30%), tetraethylorthosilicate (TEOS), 6-bromohexanoic acid, sodium azide (NaN3), 17α-ethynylestradiol 98%, dimethylthiazol-2-yl)-2,5-diphenyltetrazolium bromide (MTT), fluorescamine, borate buffer((0.1 mol L−1), acetonitrile were all supplied by Sigma-Aldrich company. N,N-Dimethyl formamide (DMF) was obtained from Fischer Scientific and poly(N-vinyl-2-pyrrolidone) MW = 55.000 (PVP) from Acros Organics. S-2-(4-Isothiocyanatobenzyl)-1,4,7,10-tetraazacyclododecane tetraacetic acid (p-SCN-Bn-DOTA) from macrocyclics. Phosphate-buffered saline (PBS) and Dulbecco's modified Eagle's medium (DMEM) were obtained from Gibco. The HEK 293 cells were obtained from Leibniz Institute DSMZ-German Collection of Microorganism and Cell Culture, ACC 305. The MCF-7 is human breast cancer cell line and obtained originally by pleural effusion from a female patient with metastatic disease. All reagents and solvents were used as received without further purification.Methods
![[thin space (1/6-em)]](https://www.rsc.org/images/entities/char_2009.gif) 000). The mixture was transferred into a 50 ml Teflon-lined stainless autoclave and heated at 180 °C for 30 h. The obtained NPs were separated from solution by centrifugation and washed several times with water and ethanol. Afterwards NPs were dried in a vacuum oven at 60 °C for 12 h. The hematite NPs were reduced to Fe3O4 in an oven using forming gas (5% H2/95% Ar) at 350 °C for 4 h with a heating rate of 10 °C min−1.33
000). The mixture was transferred into a 50 ml Teflon-lined stainless autoclave and heated at 180 °C for 30 h. The obtained NPs were separated from solution by centrifugation and washed several times with water and ethanol. Afterwards NPs were dried in a vacuum oven at 60 °C for 12 h. The hematite NPs were reduced to Fe3O4 in an oven using forming gas (5% H2/95% Ar) at 350 °C for 4 h with a heating rate of 10 °C min−1.33Quantification of active primary amines on the surface of nanocarriers
Stock solution of fluorescamine was prepared in 1 ml of acetonitrile by adding 1 mg of fluorescamine. Stock solution of APTMS was prepared by adding 500 μl of APTMS to 50 ml of borate buffer. Different concentration of APTMS stock solution in 1 ml of borate buffer (0.1 mol L−1) were reacted with a 50 μl of fluorescamine stock solution (Table 1) and the absorbance of fluorescamine–amine complex was calculated with UV-visible spectrophotometry. Calibration curve at the wavelength of λmax 384 nm was established using the absorbance of different concentration of APTMS with fluorescamine and the whole experiment was done in triplets (Fig. 7B). To calculate the active amino groups 2 mg of each APTMS and estrogen capped Gd2O3@SiO2@Fe3O4 nanocarriers were dispersed in 1 ml of borate buffer and reacted with 50 μl of fluorescamine stock solution.45a,b The pure APTMS samples were measured by applying UV-vis spectroscopy in which the absorption of spectra generated at given wavelengths can be linked directly to the concentration of the sample, Table 2.The UV-visible spectra of both nanocarriers was analyzed and the concentration of active amino group on the surface of nanocarriers were calculated considering slope and intercept values obtained by calibration curve [Fig. 7B and eqn (1)]
| y = a + bx | (1) |
Radiolabeling efficacy studies
000 cells per well. Different concentrations (0.02 μg ml−1, 0.1 μg ml−1, 0.2 μg ml−1) of nanoparticle dispersions were added to each well (except the negative control) and the well plate were incubated for 1 hour, 6 hours and 24 hours. Afterwards the cell medium was removed and the cells were washed carefully with 200 μl DPBS buffer. 100 μl trypsin was added and the 96 well plate was incubated for 3 min. To stop the reaction of trypsin, 150 μl cell medium including PBS was added and the cells were transferred into a second 96 well plate. The dispersion was centrifuged 3 times at 1200 rpm for 5 min and washed with 200 μl cell wash during each step. After the last washing step, the cells were redispersed in 100 μl cell wash and measured (CytoFLEX LX, Beckman Coulter, Germany).24Conflicts of interest
The authors declare no competing financial conflict of interest.Acknowledgements
We thank the University of Cologne and the “Deutscher Akademischer Austauschdienst” (DAAD) for their financial support. We also thank Dr Roitsch for TEM analysis, Mr Arroub for performing toxicity assays, Mr V. Vykoukal (Masaryk University, Brno, Czech Republic) for TGA measurements and Ms. N. Karamat for her help during particles synthesis. The authors thank Dr Wennhold and Prof. Schlößer for providing facilities to conduct cell tests with MCF 7 cells for flow cytometry measurements.References
- J. Shi, P. W. Kantoff, R. Wooster and O. C. Farokhzad, Nat. Rev. Cancer, 2017, 17, 20–37 CrossRef CAS PubMed.
- D. Li, S. Wen, W. Sun, J. Zhang, D. Jin, C. Peng, M. Shen and X. Shi, ACS Appl. Bio Mater., 2018, 1, 221–225 CrossRef CAS PubMed.
- K. Ulbrich, K. Holá, V. Šubr, A. Bakandritsos, J. Tuček and R. Zbořil, Chem. Rev., 2016, 116, 5338–5431 CrossRef CAS PubMed.
- J. L. Bridot, A. C. Faure, S. Laurent, C. Rivière, C. Billotey, B. Hiba, M. Janier, V. Josserand, J. L. Coll, L. vander Elst, R. Muller, S. Roux, P. Perriat and O. Tillement, J. Am. Chem. Soc., 2007, 129, 5076–5084 CrossRef CAS PubMed.
- X. H. Ma, A. Gong, L. C. Xiang, T. X. Chen, Y. X. Gao, X. J. Liang, Z. Y. Shen and A. G. Wu, J. Mater. Chem. B, 2013, 1, 3419–3428 RSC.
- S. J. Kim, W. Xu, M. W. Ahmad, J. S. Baeck, Y. Chang, J. E. Bae, K. S. Chae, T. J. Kim, J. A. Park and G. H. Lee, Sci. Technol. Adv. Mater., 2015, 16, 1–9 CrossRef PubMed.
- J. Y. Park, M. J. Baek, E. S. Choi, S. Woo, J. H. Kim, T. J. Kim, J. C. Jung, K. S. Chae, Y. Chang and G. H. Lee, ACS Nano, 2009, 3, 3663–3669 CrossRef CAS PubMed.
- L. Faucher, M. Tremblay, J. Lagueux, Y. Gossuin and M. A. Fortin, ACS Appl. Mater. Interfaces, 2012, 4, 4506–4515 CrossRef CAS PubMed.
- L. Zhou, Z. Gu, X. Liu, W. Yin, G. Tian, L. Yan, S. Jin, W. Ren, G. Xing, W. Li, X. Chang, Z. Hu and Y. Zhao, J. Mater. Chem., 2012, 22, 966–974 RSC.
- B. Zhang, H. Jin, Y. Li, B. Chen, S. Liu and D. Shi, J. Mater. Chem., 2012, 22, 14494–14501 RSC.
- W. Xu, J. Y. Park, K. Kattel, B. A. Bony, W. C. Heo, S. Jin, J. W. Park, Y. Chang, J. Y. Do, K. S. Chae, T. J. Kim, J. A. Park, Y. W. Kwak and G. H. Lee, New J. Chem., 2012, 36, 2361–2367 RSC.
- S. Liu, H. Yue, S. L. Ho, S. Kim, J. A. Park, T. Tegafaw, M. Y. Ahmad, S. Kim, A. K. A. al Saidi, D. Zhao, Y. Liu, S. W. Nam, K. S. Chae, Y. Chang and G. H. Lee, Int. J. Mol. Sci., 2022, 3, 1792 CrossRef PubMed.
- Z. Huang, Y. Wang, M. Wu, W. Li, H. Zuo, B. Xiao, X. Zhang, J. Wu, H. He and Q. Xia, Mater. Des., 2021, 203, 109600 CrossRef CAS.
- Z. Li, J. Guo, M. Zhang, G. Li and L. Hao, Front. Chem., 2022, 10, 1–10 CAS.
- J. Wang, M. Zha, H. Zhao, W. Yue, D. Wu and K. Li, Anal. Chem., 2022, 94, 4005–4011 CrossRef CAS PubMed.
- J. Yin, X. Wang, H. Zheng, J. Zhang, H. Qu, L. Tian, F. Zhao and Y. Shao, ACS Appl. Nano Mater., 2021, 4, 3767–3779 CrossRef CAS.
- K. Cheng, M. Yang, R. Zhang, C. Qin, X. Su and Z. Cheng, ACS Nano, 2014, 8, 9884–9896 CrossRef CAS PubMed.
- J. Yin, D. Chen, Y. Zhang, C. Li, L. Liu and Y. Shao, Phys. Chem. Chem. Phys., 2018, 20, 10038–10047 RSC.
- K. Wang, L. An, Q. Tian, J. Lin and S. Yang, RSC Adv., 2018, 8, 26764–26770 RSC.
- Y. Si, G. Zhang, D. Wang, C. Zhang, C. Yang, G. Bai, J. Qian, Q. Chen, Z. Zhang, Z. Wu, Y. Xu and D. Zou, Chem. Eng. J., 2019, 360, 289–298 CrossRef CAS.
- R. A. Sperling and W. J. Parak, Philos. Trans. R. Soc., A, 2010, 368, 1333–1383 CrossRef CAS PubMed.
- R. Mout, D. F. Moyano, S. Rana and V. M. Rotello, Chem. Soc. Rev., 2012, 41, 2539–2544 RSC.
- B. Pelaz, P. del Pino, P. Maffre, R. Hartmann, M. Gallego, S. Rivera-Fernández, J. M. de La Fuente, G. U. Nienhaus and W. J. Parak, ACS Nano, 2015, 9, 6996–7008 CrossRef CAS PubMed.
- S. Ilyas, N. K. Ullah, M. Ilyas, K. Wennhold, M. Iqbal, H. A. Schlößer, M. S. Hussain and S. Mathur, ACS Biomater. Sci. Eng., 2020, 6, 6138–6147 CrossRef CAS PubMed.
- T. Perrier, P. Saulnier and J. P. Benoît, Chem.–Eur. J., 2010, 16, 11516–11529 CrossRef CAS PubMed.
- M. Renner, S. Ilyas, H. A. Schlößer, A. Szymura, S. Roitsch, K. Wennhold and S. Mathur, Langmuir, 2020, 36, 14819–14828 CrossRef PubMed.
- S. E. Bulun, D. Chen, M. Lu, H. Zhao, Y. Cheng, M. Demura, B. Yilmaz, R. Martin, H. Utsunomiya, S. Thung, E. Su, E. Marsh, A. Hakim, P. Yin, H. Ishikawa, S. Amin, G. Imir, B. Gurates, E. Attar, S. Reierstad, J. Innes and Z. Lin, J. Steroid Biochem. Mol. Biol., 2007, 106, 81–96 CrossRef CAS PubMed.
- M. B. Schütz, S. Ilyas, K. Lê, M. Valldor and S. Mathur, ACS Appl. Nano Mater., 2020, 3, 5936–5943 CrossRef.
- L. Xiao, M. Mertens, L. Wortmann, S. Kremer, M. Valldor, T. Lammers, F. Kiessling and S. Mathur, ACS Appl. Mater. Interfaces, 2015, 7, 6530–6540 CrossRef CAS PubMed.
- S. Aime, S. G. Crich, E. Gianolio, G. B. Giovenzana, L. Tei and E. Terreno, Coord. Chem. Rev., 2006, 250, 1562–1579 CrossRef CAS.
- J. S. Choi, J. H. Lee, T. H. Shin, H. T. Song, E. Y. Kim and J. Cheon, J. Am. Chem. Soc., 2010, 132, 11015–11017 CrossRef CAS PubMed.
- R. Ghosh Chaudhuri and S. Paria, Chem. Rev., 2012, 112, 2373–2433 CrossRef CAS PubMed.
- L. Wortmann, S. Ilyas, D. Niznansky, M. Valldor, K. Arroub, N. Berger, K. Rahme, J. Holmes and S. Mathur, ACS Appl. Mater. Interfaces, 2014, 6, 16631–16642 CrossRef CAS PubMed.
- K. Yang, H. Peng, Y. Wen and N. Li, Appl. Surf. Sci., 2010, 256, 3093–3097 CrossRef CAS.
- N. Bogdan, F. Vetrone, G. A. Ozin and J. A. Capobianco, Nano Lett., 2011, 11, 835–840 CrossRef CAS PubMed.
- E. Hemmer, M. Quintanilla, F. Légaré and F. Vetrone, Chem. Mater., 2015, 27, 235–244 CrossRef CAS.
- B. Aiken, W. P. Hsu and E. Matijevik, Preparation and Properties of Monodispersed Colloidal Particles of Lanthanide Compounds: 111, Yttrium(III) and Mixed Yttrium(III)/Cerium(III) Systems, 1988.
- Y. Wang, X. Peng, J. Shi, X. Tang, J. Jiang and W. Liu, Nanoscale Res. Lett., 2012, 1, 1–13 Search PubMed.
- G. Jian, Y. Liu, X. He, L. Chen and Y. Zhang, Nanoscale, 2012, 4, 6336–6342 RSC.
- G. Tian, Z. Gu, X. Liu, L. Zhou, W. Yin, L. Yan, S. Jin, W. Ren, G. Xing, S. Li and Y. Zhao, J. Phys. Chem. C, 2011, 115, 23790–23796 CrossRef CAS.
- Y. Zheng, Y. Cheng, Y. Wang, F. Bao, L. Zhou, X. Wei, Y. Zhang and Q. Zheng, J. Phys. Chem. B, 2006, 110, 3093–3097 CrossRef CAS PubMed.
- P. B. Shete, R. M. Patil, B. M. Tiwale and S. H. Pawar, J. Magn. Magn. Mater., 2015, 377, 406–410 CrossRef CAS.
- P. Araichimani, K. M. Prabu, G. Suresh Kumar, G. Karunakaran, N. van Minh, S. Karthi, E. K. Girija and E. Kolesnikov, Ceram. Int., 2020, 46, 18366–18372 CrossRef CAS.
- M. Mahdavi, M. bin Ahmad, M. J. Haron, F. Namvar, B. Nadi, M. Z. Ab Rahman and J. Amin, Molecules, 2013, 18, 7533–7548 CrossRef CAS PubMed.
- (a) M. F. Attia, N. Anton, R. Bouchaala, P. Didier, Y. Arntz, N. Messaddeq, A. S. Klymchenko, Y. Mély and T. F. Vandamme, RSC Adv., 2015, 5, 74353–74361 RSC; (b) L. Lanlan, J. Guo and J. Wei, J. Appl. Polym. Sci., 2014, 131, 41058 Search PubMed.
- R. Mout, D. F. Moyano, S. Rana and V. M. Rotello, Chem. Soc. Rev., 2012, 41, 2539–2544 RSC.
- A. Guay-Bégin, P. Chevallier, L. Faucher, S. Turgeon and M. A. Fortin, Langmuir, 2012, 28, 774–782 CrossRef PubMed.
- S. Ilyas, M. Ilyas, R. A. L. van der Hoorn and S. Mathur, ACS Nano, 2013, 7, 9655–9663 CrossRef CAS PubMed.
- S. N. A. Jenie, S. Pace, B. Sciacca, R. D. Brooks, S. E. Plush and N. H. Voelcker, ACS Appl. Mater. Interfaces, 2014, 6, 12012–12021 CrossRef CAS PubMed.
- C. Haensch, S. Hoeppener and U. S. Schubert, Nanotechnology, 2007, 19, 035703 CrossRef PubMed.
- M. Meldal and C. W. Tomøe, Chem. Rev., 2008, 108, 2952–3015 CrossRef CAS PubMed.
- H. Li, Q. Zheng and C. Han, Analyst, 2010, 135, 1360–1364 RSC.
- M. W. Brechbiel, Q. J. Nucl. Med. Mol. Imaging, 2008, 52(2), 166 CAS.
- M. Meisenheimer, S. Kürpig, M. Essler and E. Eppard, Molecules, 2008, 2, 166 Search PubMed.
- L. M. Bronstein, X. Huang, J. Retrum, A. Schmucker, M. Pink, B. D. Stein and B. Dragnea, Chem. Mater., 2007, 19, 3624–3632 CrossRef CAS.
- E. Krakor, I. Gessner, M. Wilhelm, V. Brune, J. Hohnsen, L. Frenzen and S. Mathur, MRS Commun., 2021, 11, 363–371 CrossRef CAS.
- S. Ilyas, Click Functionalized Nanoprobes for Target Specific Biomedical Applications, Dr Hut Verlag, Universität Köln, 2015 Search PubMed.
- Z. A. Barra, N. M. Ferreira, M. A. Martins, H. Oliveira, L. P. Ferreira, M. M. Cruz, M. D. D. Carvalho, S. M. Neumayer, B. J. Rodriguez, C. Nunes and P. Ferreira, J. Mater. Chem. B, 2020, 8, 1256–1265 RSC.
- T. Ishiguchi and S. Takahashi, Drugs R&D, 2010, 10, 133–145 CrossRef PubMed.
Footnotes |
| † Electronic supplementary information (ESI) available: The EDX and SAED of as-prepared core shell nanocarriers, DLS graphs and table, additional SEM, TEM images and XRD measurements. In addition, the flow cytometry measurements of pure MCF7 breast cancer cells without the addition of nanocarriers, FITC conjugated Gd2O3@SiO2@Fe3O4 are provided. See DOI: https://doi.org/10.1039/d2ra00347c |
| ‡ Shifaa M. Siribbal and Shaista Ilyas contributed equally as primary author for this manuscript. |
| This journal is © The Royal Society of Chemistry 2022 |