 Open Access Article
Selective CO2 adsorption and bathochromic shift in a phosphocholine-based lipid and conjugated polymer assembly†
Juran Noh a,
Dong Geon Koob,
Chohee Hyunc,
Dabin Leeb,
Seohyeon Jangb,
Jiho Kim
 e,
Yejee Jeonb,
Su-Young Moond,
Boknam Chaee,
Inho Nam
 b,
Tae Joo Shin
 *cf and
Juhyun Park
 *b
*b
aDepartment of Material Science and Engineering, Texas A&M University, College Station, TX 77843, USA
bDepartment of Intelligent Energy and Industry, School of Chemical Engineering and Materials Science, Chung-Ang University, Seoul 06974, Republic of Korea. E-mail: jpark@cau.ac.kr
cUNIST Central Research Facilities, Ulsan National Institute of and Technology (UNIST), Ulsan 44919, Republic of Korea. E-mail: tjshin@unist.ac.kr
dC1 Gas & Carbon Convergent Research Center, Chemical & Process Technology, Korea Research Institute of Chemical Technology, Daejeon 34114, Republic of Korea
ePohang Accelerator Laboratory, Pohang 37673, Republic of Korea
fGraduate School of Semiconductor Materials and Devices Engineering, Ulsan National Institute of Science and Technology (UNIST), Ulsan 44919, Republic of Korea
First published on 16th March 2022
Abstract
We assemble a film of a phosphocholine-based lipid and a crystalline conjugated polymer using hydrophobic interactions between the alkyl tails of the lipid and alkyl side chains of the polymer, and demonstrated its selective gas adsorption properties and the polymer's improved light absorption properties. We show that a strong attractive interaction between the polar lipid heads and CO2 was responsible for 6 times more CO2 being adsorbed onto the assembly than N2, and that with repeated CO2 adsorption and vacuuming procedures, the assembly structures of the lipid-polymer assembly were irreversibly changed, as demonstrated by in situ grazing-incidence X-ray diffraction during the gas adsorption and desorption. Despite the disruption of the lipid structure caused by adsorbed polar gas molecules on polar head groups, gas adsorption could promote orderly alkyl chain packing by inducing compressive strain, resulting in enhanced electron delocalization of conjugated backbones and bathochromic light absorption. The findings suggest that merging the structures of the crystalline functional polymer and lipid bilayer is a viable option for solar energy-converting systems that use conjugated polymers as a light harvester and the polar heads as CO2-capturing sites.
1. Introduction
Carbon dioxide (CO2) recycling technologies for the reduction of carbon footprints are crucial because the concentration of CO2 in the atmosphere has kept increasing from 280 ppm in the preindustrial era to the current level of 410 ppm, driving global warming.1–6 Technologies to capture, store and convert CO2 directly from air are thus indispensable for stabilizing or decreasing the concentration of atmospheric CO2. Furthermore, it is greatly beneficial when both capture and conversion of CO2 can be simultaneously carried out in the air. Because the sources of CO2 emission are widely distributed over the world, not limited to point sources such as power plants and industrial factories, localized CO2 capture and storage facilities are not adequate to achieve the goal for the CO2 reduction. Technologies for direct capture of CO2 from ambient air and immediate conversion to useful fuels and chemicals such as formaldehyde, methanol and methane should thus be a strong requirement to prevent a drastic increase in CO2 concentration.One of the most effective approaches for this goal is to use photocatalysts for both CO2 capturing and reducing, environmentally friendly harvesting and utilizing solar energy, which has received a lot of attention. Carbon nitride,7 metal–organic frameworks (MOFs),8,9 surface-modified metal oxide semiconductor nanocrystals such as TiO2,10,11 nanocomposites of TiO2 and MOFs,12 and metal chalcogenides/nitrides13 have been investigated for CO2 capture and photocatalytic reduction. Photocatalysis based on conjugated polymers is also a promising candidate for both CO2 capture and photoconversion reaction. It's because, as proven by polymeric photovoltaic systems, one may take advantages of conjugated polymers' chemical stability14,15 and outstanding light harvesting properties over a broad range of solar energy from ultraviolet (UV), visible, to near infrared (NIR) light by easily tuning their molecular structure.16–18 However, CO2-fixation has been regarded as the most difficult barrier to overcome in order to improve overall efficiency.19 Only a few investigations on CO2 capture and photoreduction based on conjugated polymers have been undertaken, including CO2 adsorption to ionic liquid and subsequent photochemical conversion by conjugated polymers,20 and conjugated microporous polymers.21 Thus, a process for effective CO2 fixation is in great demand for photocatalytic CO2 conversion based on conjugated polymers.
Numerous investigations on capturing and storing CO2 have been reported in the field of CO2 fixation.22–24 CO2 gas can be collected in a variety of ways25 that include physical adsorption without any chemical reactions22,26 and chemisorption with a chemical reaction such as the production of carbamic acid with an amine1,27–29 or mineral salts.2,30 Low interfacial energy, which derives from high polarity, and a large surface area are critical elements for improving capture efficiency in both physisorption and chemisorption.10,12 As a result, materials having a wide surface area and electrostatic or chemical attraction sites, such as amine compounds,1,27 inorganic salts, covalent organic frameworks,22,24,27 and metal–organic frameworks,5,31 have been proposed for CO2 fixation.
We expect conjugated polymer nanomaterials assembled with phospholipids to provide both CO2 collecting sites and photocatalysis via conjugated polymers, as well as nanodimensions for a large surface area. Phospholipids that include phosphocholine (PC) and phosphorus amine23 are the most abundant lipids, with significant polarity due to phosphorus-based zwitterions in their head groups. These differently charged neighboring groups contain both positive and negative areas in a molecule to maximize polarity and generate dipole polarization to neighbour nonpolar but dipolar molecules,28 making them a promising candidate for CO2 capturing sites. Phospholipids, on the other hand, can form a bilayer structure with high polar boundaries and hydrophobic intermediate layer, as seen in cell membranes, by compact packing of polar heads and alkyl tails.32–36 As we previously demonstrated, conjugated polymers can be integrated into the intermediate layer by alkyl chain association between the polymers' side chains and the phospholipids' tails, resulting in nanoparticles with a hydrophobic polymer core and an outer surface made up of polar lipid heads,37–39 which can be employed for photocatalysis.40,41 Such integration of organic and polymeric semiconductors in the intermediate layer of the lipid bilayer and increased charge transfer efficiency42 were also demonstrated for microbial fuel cells,43 membrane sensors44–46 and photocurrent generation systems.47 Based on these findings, we presume that conjugated polymers in the nanomaterials' core area can efficiently harvest solar energy, and that charges can be carried to the nanomaterials' outer polar surfaces, where CO2 can be adsorbed.
As a starting point for CO2 conversion using assemblies of phospholipids and conjugated polymers, we studied the structure variation during polar and nonpolar gas adsorption in a model lipid bilayer film using 1,2-diphytanoyl-sn-glycero-3-phosphocholine (D7PC) and a highly crystalline conjugated polymer, poly(3-hexylthiophene) (P3HT), as shown in Fig. 1a. D7PC is a phosphocholine lipid with an alkyl chain length that is similar to that of P3HT, resulting in a densely packed structure with exposed polar head groups that bind polar gas molecules. We confirmed the selective physisorption between external gases and lipid heads groups in the film assembly structure and revealed that the effect of gas adsorption on the assembly structure and optical property of the conjugated polymer in the intermediate layer. By analyzing the structure and intermolecular interaction variation in the assemblies of phospholipids and conjugated polymers, we were able to better understand the role of each section of lipids during gas adsorption and highlight the potential for photocatalytic application.
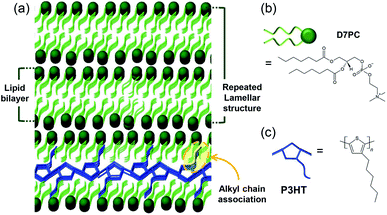 | ||
| Fig. 1 Schematic image of (a) P3HT-lipid bilayer structure for CO2 adsorption and conjugate polymer annealing effect and molecular structure of (b) lipid, D7PC and (c) P3HT. | ||
2. Experimental
2.1 Materials
Regioregular P3HT was purchased from 1-Material (Quebec, Canada). D7PC in a 25 mg mL−1 chloroform solution were obtained from Avanti Polar Lipids (Alabama, USA). All chemicals were used without further purification.2.2 Preparation of P3HT–D7PC lipid bilayer film
First, 0.2 mg of P3HT (molecular weight (MW) = 166.28 g mol−1 on a repeat unit basis, 1.2 μmol) was dissolved in 2 mL of chloroform. Then, 6 μmol of lipid (5 times larger than the molar amount of P3HT) was added to the P3HT chloroform solution (0.116 mL of D7PC solution, 2.89 mg of D7PC (MW = 481.56 g mol−1)) and ultrasonicated for 5 min. Uniform films were fabricated by evaporating the solvent in an oil bath at 32 °C while blowing a gentle stream of N2. For further drying, the films were stored in vacuum at room temperature overnight. For a control sample, a P3HT film was prepared via the same method without the addition of the lipid solution. For measurements of infrared (IR) spectra, surface morphology, and grazing-incidence X-ray diffraction (GIXD), film samples were assembled on silicon substrates or quartz plates and scraped from substrates for gas adsorption examination.2.3 First principle calculation
The selectivity of CO2 gas absorption behavior was calculated by first-principle calculations based on density functional theory (DFT). The entire calculation has employed B3LYP hybrid functional with a 6-311++G basis set, which is a highly reliable exchange-correlation functional in terms of precision and calculation resource. All atomic and electronic structures were first optimized at the relaxed states, and the lowest energy structures were obtained for further absorption energy analysis using Gaussian 16 package program.2.4 Characterizations
Gas adsorption isotherms were recorded on an ASAP 2020 volumetric adsorption apparatus (Micromeritics, USA) at a range of absolute pressures from 0 to 870 mmHg for N2 and CO2 at 273 K. The samples were degassed in the degas port of the adsorption analyzer at 298 K for 12 h before measurement. Fourier-transform IR (FT-IR) absorption spectra were obtained in reflection mode in the range of 600 to 4000 cm−1 with a Hyperion 3000 FTIR microscope and a Vertex 80/v FTIR spectrometer equipped at PLS-II 12D IRS beamline of Pohang Accelerator Laboratory in Korea. Phase images of the polymer films were obtained via atomic force microscopy (AFM, Nanoscope III, Veeco Instruments, Inc.). Contact-angle images were obtained using a drop-shape analyzer (DSA100S, KRUSS, Germany) via the sessile drop method. Synchrotron grazing-incidence X-ray diffraction (GIXD) measurements were conducted at the PLS-II 6D UNIST-PAL beamline. The X-rays emitted from the bending magnet were monochromated at 11.6 keV (wavelength: 1.0688 Å) using Si(111) double crystals and were focused on the detector by using a combination of a sagittal-type monochromator crystal and a toroidal mirror system. The incident angle of the X-ray beams was set at 0.13°, and the sample-to-detector distance was approximately 246 mm. The diffraction patterns were recorded with a two-dimensional (2D) charge-coupled device detector (MX225-HS, Rayonix LLC, USA) and the diffraction angles were calibrated using a lanthanum hexaboride (LaB6) standard material (NIST SRM 660c). Ultraviolet-visible (UV–vis) absorption spectra were obtained using a UV–vis spectrometer (V-670, JASCO, Japan).3. Results and discussions
3.1 Selective gas adsorption
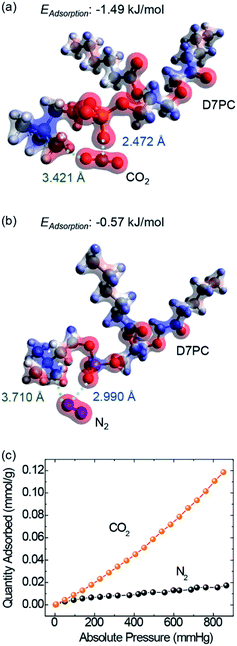
The polar head group in D7PC, highly polarized phosphate choline, has been shown by DFT calculations to have the ability to attract polar gas molecules. Charge distributions of lipids based on DFT calculations (Fig. 2a and b) demonstrate that the phosphocholine group strongly polarizes with electron-deficient choline group (blue) and electron-rich phosphor group (red), resulting in partial polarization of the gas molecules.48 The partially negative oxygen atom in CO2 interacts with the choline group and the partially positive carbon in CO2 interacts with the phosphor group due to electrostatic attraction.49,50 In comparison to N2 molecules, the CO2 molecule is more likely to be stabilized closer to the lipid head group. The distance between the choline group and the gas molecules was calculated to be 3.421 Å in CO2 adsorption and 3.710 Å in N2, whereas the distance between the phosphor group and the gas was 2.472 Å in CO2 and 2.990 Å in N2. CO2 adsorption energies eventually reached −1.49 kJ mol−1, about three times higher than N2 adsorption energies of −0.57 kJ mol−1. The DFT calculations demonstrate that D7PC may preferentially adsorb gas molecules and that it is primarily made up of phosphocholine groups, which are polar head groups that cause dipole interaction. The selective adsorption of N2 and CO2 was evaluated using a Brunauer–Emmett–Teller (BET) analysis (Fig. 2c) in agreement with the DFT calculations. The amount of CO2 gas adsorbed into 1 g of the P3HT–D7PC lipid bilayer film at 760 mmHg was 0.102 mmol, over six times higher than that of N2 (0.016 mmol). This indicates that CO2 was attracted to the polar head group by electrostatic interaction with induced polarization.FT-IR spectroscopy was used to analyze the intermolecular interaction between D7PC and CO2 molecules as experimental evidence for DFT computations (Fig. 3 and S1†). D7PC and D7PC–P3HT films were assembled on Si wafers and used for reflected mode measurements. The D7PC and D7PC–P3HT films' FT-IR spectra were collected sequentially in three different environments: air (@air), vacuum for 15 minutes of degassing (@vac), and finally 30 minutes of CO2 purging (@CO2). Fig. 3 shows normalized absorbance spectra in the range of 1300–1000 cm−1 for assessing any variations in phosphate bonds. The phosphate group's four IR bands were allocated to terminated bonds (1250–1220 cm−1, ν1(P![[double bond, length as m-dash]](https://www.rsc.org/images/entities/char_e001.gif) O) and 1190–1070 cm−1, ν3(P–O−), and bonds connected to choline (1170–1055 cm−1, ν2) and alkyl tails (1140–1000 cm−1, ν4)).51,52 Variations in the environment had a significant impact on the terminated bands that were exposed to the media. When ambient air was removed, the peak attributed to ν1 in the spectrum for D7PC–P3HT film (dashed lines in Fig. 3) was displaced from 1234 to 1253 cm−1, then restored to 1240 cm−1 following CO2 purging. This finding indicates that CO2 might be put near the terminal bonds and pull electrons from the electron-rich oxygen molecule, resulting in a lower force constant and the shorter interatomic distance between carbon in CO2 and oxygen in the P
O) and 1190–1070 cm−1, ν3(P–O−), and bonds connected to choline (1170–1055 cm−1, ν2) and alkyl tails (1140–1000 cm−1, ν4)).51,52 Variations in the environment had a significant impact on the terminated bands that were exposed to the media. When ambient air was removed, the peak attributed to ν1 in the spectrum for D7PC–P3HT film (dashed lines in Fig. 3) was displaced from 1234 to 1253 cm−1, then restored to 1240 cm−1 following CO2 purging. This finding indicates that CO2 might be put near the terminal bonds and pull electrons from the electron-rich oxygen molecule, resulting in a lower force constant and the shorter interatomic distance between carbon in CO2 and oxygen in the P![[double bond, length as m-dash]](https://www.rsc.org/images/entities/char_e001.gif) O bond as calculated by DFT. The wavenumber of the peak assigned to ν3(P–O−) followed the same pattern, varying from 1078, 1082, and 1080 cm−1 in air, vacuum, and CO2, respectively, but the change was not as pronounced as it was in ν1.
O bond as calculated by DFT. The wavenumber of the peak assigned to ν3(P–O−) followed the same pattern, varying from 1078, 1082, and 1080 cm−1 in air, vacuum, and CO2, respectively, but the change was not as pronounced as it was in ν1.
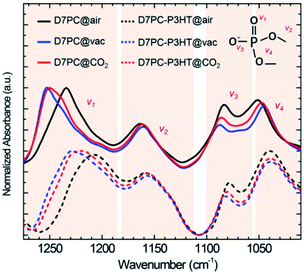 | ||
| Fig. 3 Normalized FT-IR absorbance spectra in 1300 to 1000 cm−1 range of D7PC (solid line) and D7PC/P3HT film (dashed line) in air (black), vacuum (blue) and CO2 (red) condition. | ||
Meanwhile, even after CO2 purging, the peaks assigned to ν2 and ν4 remained unchanged at 1159 and 1039 cm−1. Because of their relationship to heavy alkoxyl groups, these two bonds were situated opposite the bonds exposed to the environment, correcting electron distribution, and their bond strengths were unaffected by the environment. All of these findings point to P![[double bond, length as m-dash]](https://www.rsc.org/images/entities/char_e001.gif) O and CO2 as the primary intermolecular interaction between D7PC and CO2 molecules. It's worth noting that the IR spectra of D7PC reveal a somewhat different pattern for ν4, despite the fact that the patterns for ν1, ν2, and ν3 are similar to those of D7PC–P3HT. For measurements in air, vacuum, and CO2, the peak of ν4 varies from 1051, 1045, and 1047 cm−1, respectively (solid lines in Fig. 3). These findings suggest that when alkyl tails are coupled with alkyl side chains of P3HT via hydrophobic interactions, the P–O bond connected to lipid tails is less influenced by environmental change.
O and CO2 as the primary intermolecular interaction between D7PC and CO2 molecules. It's worth noting that the IR spectra of D7PC reveal a somewhat different pattern for ν4, despite the fact that the patterns for ν1, ν2, and ν3 are similar to those of D7PC–P3HT. For measurements in air, vacuum, and CO2, the peak of ν4 varies from 1051, 1045, and 1047 cm−1, respectively (solid lines in Fig. 3). These findings suggest that when alkyl tails are coupled with alkyl side chains of P3HT via hydrophobic interactions, the P–O bond connected to lipid tails is less influenced by environmental change.
3.2 Structural and optical characteristics
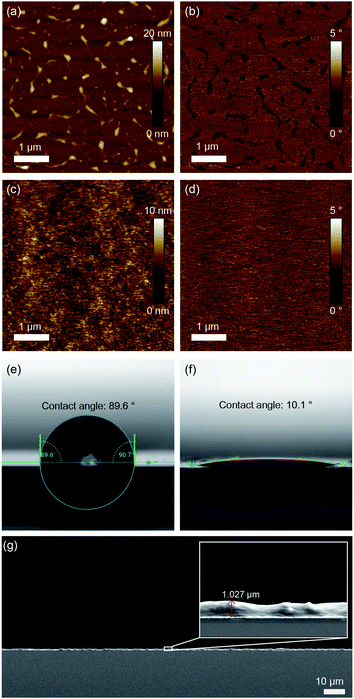
Surface morphologies and any structural features of films were investigated by utilizing AFM. Fig. 4a and b show a P3HT film generated by N2 blowing with an uneven surface morphology and a roughness of 1.23 nm. The D7PC–P3HT film, on the other hand, produced a remarkably homogenous, smooth surface with a roughness of 0.194 nm. P3HT and D7PC–P3HT films have contact angles of 90° ± 1° and 9° ± 1°, respectively. These findings show that P3HT chains are embedded in the D7PC bilayer's alkyl intermediate region, and that the D7PC–P3HT film's outermost surface is made up of D7PC polar heads, which are hydrophilic.53,54 The thickness of assembled films was in a range from 200 nm to a few micrometer, which was irregular due to our film preparation process by nitrogen blowing. In a uniformly coated region on the silicon substrate, it was about 1 μm as shown in Fig. 4g.We investigated in situ GIXD patterns in vacuum and during CO2 adsorption to observe if there was any structural alteration due to gas adsorption on the D7PC–P3HT film. Fig. 5a, b, and c show 2D GIXD patterns of P3HT, D7PC, and D7PC–P3HT films recorded in vacuum on silicon wafers, with their line cuts along in-plane (Fig. 5d) and out-of-plane (Fig. 5e) directions, respectively. The pristine P3HT film has a highly ordered edge-on structure, vertically aligned with the z-axis, as shown in the 2D GIXD image in Fig. 5a. The (100) lamellar stacking peak of P3HT chains, which is strongest in the z-direction, is ascribed to the most conspicuous peak that appears as a ring pattern at q = 0.364 Å−1 (d-spacing = 17.262 Å). As illustrated by the red-colored line in Fig. 5e, more repeating lamella peaks arise at qrz = 0.744 Å−1 and 1.130 Å−1 for the (200) and (300) planes, respectively, which are similar to a scattering pattern of a P3HT film in literature.55 Additionally, the clear peak of (010) plane characteristic for π–π stacking (qxy = 1.622 Å−1, d-spacing = 3.874 Å) and a weak but distinguishable peak of alkyl chain association (qxy = 1.4 Å−1, d-spacing = 4.5 Å) were observed, supporting the edge-on structure of the pristine P3HT film, as indicated by the red line in Fig. 5d (the 1D line cut of the P3HT film scattering pattern along in-plane direction).55 The (100) peak, on the other hand, also emerges in the qxy 1D plot, showing that the P3HT was substantially crystallized but that some of the crystal domain was scattered randomly.
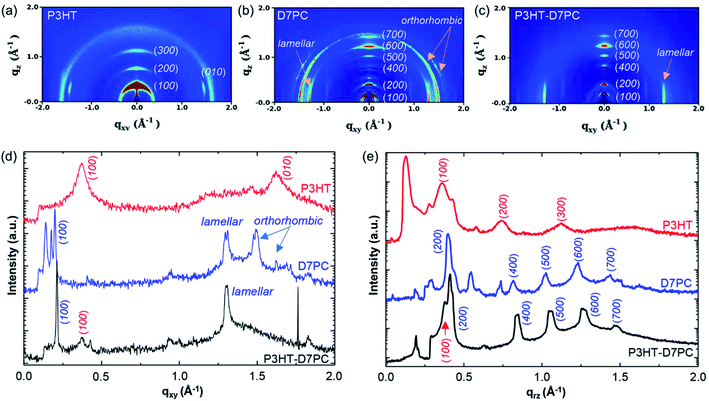 | ||
| Fig. 5 GIXD 2D images of (a) P3HT film, (b) D7PC film, and (c) D7PC–P3HT film in a vacuum condition. (d) 1-D qxy plots and (e) qrz plots of P3HT (red), D7PC (blue) and P3HT–D7PC composite (black). | ||
The D7PC film, on the other hand, shows a densely packed lamellar structure with recurrent peaks in the z-direction at qrz = 0.204, 0.398, 0.816, 1.025, 1.232, and 1.439 Å−1 for (100), (200), (400), (500), (600), and (700), which are similar to literature.56 The calculated lipid bilayer thickness of 30.80 Å is similar to that of D7PC's liquid crystalline phase (L phase, 30.14 Å).57 Because of the packing of lipid molecules, the bilayer structure is also packed in a plane orientation. Three distinct peaks can be seen in Fig. 5b and d: qxy = 1.314 Å−1 (d-spacing = 4.782 Å), qxy = 1.500 Å−1 (d-spacing = 4.109 Å), and qxy = 1.624 Å−1 (d-spacing = 3.869 Å). The peak at qxy = 1.314 Å−1 is due to packing of liquid alkyl chains in a lamellar structure, while the other two peaks are due to alkyl chain packing in an orthorhombic crystalline structure. These findings suggest that D7PC film's liquid crystalline structure is a mix of liquid lamellar and orthorhombic crystalline structures, comparable to the lipid assembly structure in the stratum corneum.58
The GIXD pattern of the D7PC–P3HT assembly is similar to that of the D7PC assembly. It has a lipid bilayer thickness of 29.778 Å (q = 0.211 Å−1), which is somewhat less than the bilayer thickness of D7PC alone (30.8 Å). It's also worth noting that the peak at qxy = 1.3 Å−1 persists, whereas the peaks at qxy = 1.5 and 1.6 Å−1 vanish. These results indicate that the alkyl chain packing with the orthorhombic crystalline structure is disrupted when P3HT chains are assembled with D7PC molecules, with only an interchain spacing between alkyl chains in the liquid lamellar structure. The D7PC–P3HT, on the other hand, does not have lamellar peaks in the (200) and (300) planes for the crystalline P3HT assembly. At q = 0.364 Å−1, only the peak of the (100) plane of the P3HT assembly is visible, which is overlapped with the peak of the (200) plane for D7PC. These findings strongly suggest that P3HT chains do not form a self-domain in its crystalline structure and are bound to D7PC via alkyl chain association, with D7PC's lamellar structure dominating D7PC–P3HT assembly. These results also indicate that the D7PC–P3HT assembly exhibits a slightly reduced bilayer thickness because the D7PC bilayer structure is constricted by the presence of P3HT via alkyl chain association outside of the D7PC domain.
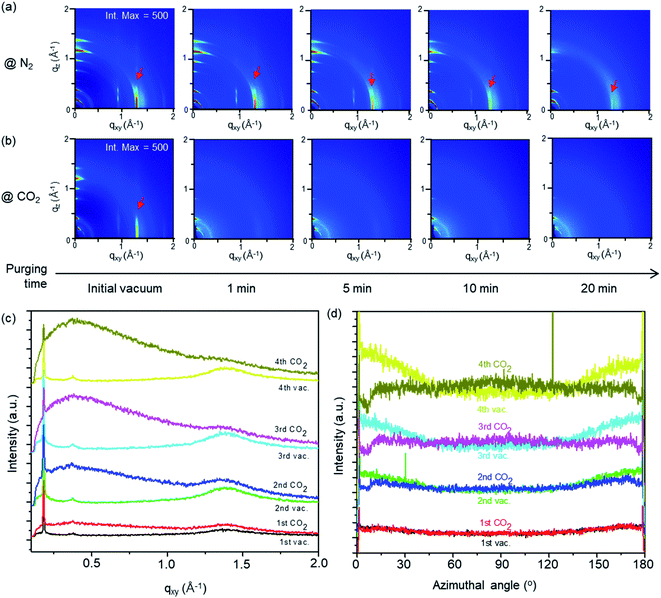
The structural change of the D7PC-only and D7PC–P3HT assemblies with gas absorption was studied using in situ GIXD measurements with purging N2 and CO2 gases. 2D GIXD patterns of the assemblies were recorded every 10 seconds to examine the gas environment conditions. Both assemblies in vacuum (∼5 × 10⁻² Torr) revealed a lamellar structure with distinct alkyl chain packing peaks (red arrows) in the in-plane direction and layering peaks in the out-of-plane direction, as shown in Fig. 6a and b. However, depending on the types of gases, they displayed distinct structural variations upon gas adsorption after purging them. With N2 purging (540 Torr), the strong diffraction peaks of the lamellar and alkyl chain packing were sustained for up to 15 minutes (Fig. 6a at an intensity maximum of 500 and Fig. S2† at that of 380). On the other hand, the strength of the lamellar and alkyl chain packing peaks is considerably reduced within 1 min after CO2 purging (540 Torr) as shown in Fig. 6b at an intensity maximum of 500 and Fig. S3† at that of 380. These findings indicate that CO2 molecules are quickly adsorbed onto the D7PC–P3HT assembly and pierced into the lipid bilayer, disrupting the assembly's ordered structure, whereas N2 gas molecules are difficult to adsorb and penetrate into the assembly.
The ordered assembly structure is recovered to its original structure when the sample was purged with N2 for 40 min and then vacuumed for 20 min (Fig. S2†), but not fully recovered when the sample was purged with CO2 (Fig. S3†). These results suggest that structural changes generated by N2 purging and vacuuming are reversible, whereas those caused by CO2 gas molecules adsorption and penetration are not. Furthermore, as shown in Fig. 6c and d, repeated vacuuming for 20 min and CO2 purging for 40 min rearranged alkyl chains into an orderly structure. With repeated vacuuming and CO2 purging, the diffraction peaks of P3HT's (100) plane at q ∼ 0.38 Å−1 and D7PC's alkyl chain packing peak at q ∼ 1.3 Å−1 become clearer, as demonstrated in the 1D line cut along the in-plane direction measured in vacuum (Fig. 6c) (note: the samples used in Fig. 6c and d are thinner than the samples used in Fig. 6b, resulting in less sharp diffraction patterns in vacuum). Azimuthal cut profiles for the diffraction peak of alkyl chain packing at q ∼ 1.3 Å−1 (Fig. 6d) show increased intensity at around 0 and 180°, suggesting that alkyl chains are vertically organized on the substrate surface after repeated vacuuming and CO2 purging. Our findings present that CO2 can be easily absorbed and penetrated into a lipid bilayer assembly, allowing lipid molecules to reorganize themselves into an ordered structure. Furthermore, with repeated vacuuming and purging processes, increased gas scattering intensity, seen as an amorphous hollow below q 1.0 Å−1 in Fig. 6c, suggests that some CO2 is trapped in the assembly even after the vacuuming process.
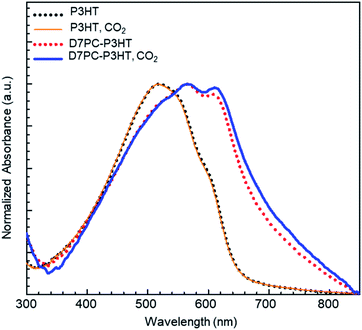
We examined the effect of CO2 treatment on the optical properties of P3HT assembled with the D7PC. The optical absorbance measured with samples assembled on a transparent slide indicated that the aligned alkyl chains in the D7PC–P3HT assembly improved the absorption property of P3HT, as shown in Fig. 7. The absorbance of the D7PC–P3HT assembly was red-shifted to 564 nm (red dotted line in Fig. 7) in vacuum, compared to 520 nm for the pure P3HT film (black dotted line), which is assigned to S1 band transition.59 There was also a second absorption band at 606 nm, which is assigned to a (0–0) transition of S0 band in aggregates of P3HT in literature, indicating a bathochromic shift due to improved intra- or intermolecular electron delocalization.60,61 The maximum intensity ratio of S0/S1, is 0.951, which is unusually high for P3HT based thin films.52 Then, the two films were placed in a small chamber charged with CO2 for 1 hour to confirm the CO2 purging action and utilized to measure absorption spectra in ambient atmosphere within 5 min after they were removed from the chamber. Fig. 7 indicates that following CO2 charge, the absorption spectrum of the P3HT film (orange solid line) didn't change, whereas the D7PC–P3HT film (blue solid line) showed an even further bathochromic shift of the S0 band to 611 nm and a higher S0/S1 ratio of 0.982. Because we couldn't discover distinct diffraction peaks of the (200) and (300) planes and π–π stacking of P3HT in the assembly with an excess of D7PC used in our investigation, it's unlikely that P3HT forms crystalline aggregates as reported in thin films. Thus, the bathochromic shift of P3HT assembled with D7PC is most likely caused by intramolecular electron delocalization. As predicted by theoretical calculations,62 such intramolecular electron delocalization is possible by reduced torsional angle and prolonged π conjugation along P3HT backbone. Our analysis shows that CO2 adsorption and penetration into the D7PC–P3HT assembly causes compressive strain, and rearrangement of conjugated backbones and alkyl chains for the intramolecular electron delocalization when CO2 molecules are muscling with polar heads and alkyl chains.
It is noteworthy that the CO2 annealing under supercritical circumstances of P = 8–15 MPa and T = 35–36 °C could plasticize P3HT films and accelerate their crystallization for enhanced charge carrier mobility.63,64 In our investigation, a similar CO2 annealing effect was obtained for the P3HT assembled with D7PC at a lower pressure of 0.072 MPa and room temperature than the critical pressure and temperature of CO2, which is remarkable. We believe that high CO2 gas adsorption on D7PC's polar heads and trapping in the assembly plays a key role in the molecular rearrangement.
4. Conclusions
As a model system for photochemical reactions of gas molecules based on conjugated polymers, we investigated the gas adsorption property on the assembly films of a phospholipid, D7PC, and a crystalline conjugated polymer, regioregular P3HT. Because the polar heads of D7PC are arrayed on the outermost surface of the films and CO2 has a stronger electrostatic attraction to the polar heads than N2 gas molecules, a higher amount of CO2 than N2 gas molecules could be adsorbed onto the assembly films, as confirmed by DFT calculations and experimental results. In situ GIXD measurements revealed structural changes based on gas adsorption and penetration into the D7PC–P3HT films. CO2 gas molecules are immediately adsorbed on polar heads, disrupting the layering of lipids and alkyl chain packing, and allowing for orderly rearranging of lipid and polymer molecules. The increased intensity of the S0 band in the absorption spectra of the D7PC–P3HT assembly films was due to enhanced electron delocalization along the conjugated backbones that are embedded in the lipid bilayer via alkyl chain association between lipid heptyl tails and ethylhexyl side chains. Our findings suggest that a phospholipid-conjugated polymer assembly could be a promising CO2 fixation and photochemical conversion candidate. The well-blended lipid-conjugated polymer films with strong and closer packing between the lipid and conjugated polymer films have the potential to improve CO2 accessibility to the photochemical reaction site, resulting in increased conversion efficiency. Furthermore, the aligned conjugated films enable for the development of specialized photochemical processes by enlarging the light absorption range to acceptable energy levels via repeated adsorption/desorption. This research presents a lipid-conjugated polymer composite model that has the potential to produce a dual fixing and CO2 conversion system. It should be further emphasized that a new technique should be created to enhance surface area of this system, for example, by manufacturing nanomaterials or porous structures based on this kind of system. In addition, for practical applications, novel amphiphilic materials that feature CO2 collecting sites and can be combined with conjugated polymers should be manufactured in a cost-effective process to replace expensive phospholipids.Author contributions
Juran Noh: formal analysis, investigation, data curation, writing – original draft. Dong Geon Koo: formal analysis, investigation. Chohee Hyun, formal analysis, investigation, resources. Dabin Lee: formal analysis, investigation. Seohyeon Jang: formal analysis, investigation. Jiho Kim: formal analysis, investigation. Yejee Jeon: formal analysis, investigation. Su-Young Moon: formal analysis, investigation, data curation, validation. Boknam Chae: formal analysis, investigation, validation. Inho Nam: formal analysis, investigation, data curation, validation. Juhyun Park: methodology, conceptualization, writing – review & editing, supervision. Tae Joo Shin: methodology, conceptualization, funding acquisition, writing – review & editing, supervision.Conflicts of interest
There are no conflicts to declare.Acknowledgements
This research was supported by the Chung-Ang University Graduate Scholarship in 2020, and the National Research Foundation of Korea (Grant No. NRF-2018R1A5A1025224). The authors thank Seong-hun Lee and Juhyun Yang, who helped with the GIXD experiments. Synchrotron X-ray Experiments at PLS-II 6D and 12D beamlines were supported in part by UCRF, MSIP, and POSTECH.References
- F. Inagaki, C. Matsumoto, T. Iwata and C. Mukai, J. Am. Chem. Soc., 2017, 139, 4639–4642 CrossRef CAS PubMed.
- H.-J. Ho, A. Iizuka and E. Shibata, Ind. Eng. Chem. Res., 2019, 58, 8941–8954 CrossRef CAS.
- N. Kittner, F. Lill and D. M. Kammen, Nat. Energy, 2017, 2, 17125 CrossRef.
- V. Scott, R. S. Haszeldine, S. F. B. Tett and A. Oschlies, Nat. Clim. Change, 2015, 5, 419–423 CrossRef CAS.
- J. Liang, Y.-B. Huang and R. Cao, Coord. Chem. Rev., 2019, 378, 32–65 CrossRef CAS.
- X. Shi, H. Xiao, H. Azarabadi, J. Song, X. Wu, X. Chen and K. S. Lackner, Angew. Chem., Int. Ed., 2020, 59, 6984–7006 CrossRef CAS PubMed.
- S. N. Talapaneni, G. Singh, I. Y. Kim, K. AlBahily, A. H. Al-Muhtaseb, A. S. Karakoti, E. Tavakkoli and A. Vinu, Adv. Mater., 2020, 32, e1904635 CrossRef PubMed.
- S. Wang and X. Wang, Angew. Chem., Int. Ed., 2016, 55, 2308–2320 CrossRef CAS PubMed.
- I. I. Alkhatib, C. Garlisi, M. Pagliaro, K. Al-Ali and G. Palmisano, Catal. Today, 2020, 340, 209–224 CrossRef CAS.
- J. Low, B. Cheng and J. Yu, Appl. Surf. Sci., 2017, 392, 658–686 CrossRef CAS.
- Y. Liao, S. W. Cao, Y. Yuan, Q. Gu, Z. Zhang and C. Xue, Chem.–Eur. J., 2014, 20, 10220–10222 CrossRef CAS PubMed.
- A. Crake, K. C. Christoforidis, A. Kafizas, S. Zafeiratos and C. Petit, Appl. Catal., B, 2017, 210, 131–140 CrossRef CAS.
- D. Adekoya, M. Tahir and N. A. S. Amin, Renewable Sustainable Energy Rev., 2019, 116, 1093898 CrossRef.
- R. Prabhu, B. Roopashree, T. Jeevananda, S. Rao, K. Raghava Reddy and A. V. Raghu, Mater. Sci. Energy Technol., 2021, 4, 92–99 CAS.
- R. Prabhu, T. Jeevananda, K. R. Reddy and A. V. Raghu, Mater. Sci. Energy Technol., 2021, 4, 107–112 CAS.
- J. Park, J. Ind. Eng. Chem., 2017, 51, 27–43 CrossRef CAS.
- M. Liras, M. Barawi and V. A. de la Pena O'Shea, Chem. Soc. Rev., 2019, 48, 5454–5487 RSC.
- C. Dai and B. Liu, Energy Environ. Sci., 2020, 13, 24–52 RSC.
- S. Dang, H. Yang, P. Gao, H. Wang, X. Li, W. Wei and Y. Sun, Catal. Today, 2019, 330, 61–75 CrossRef CAS.
- Y. Chen, G. Ji, S. Guo, B. Yu, Y. Zhao, Y. Wu, H. Zhang, Z. Liu, B. Han and Z. Liu, Green Chem., 2017, 19, 5777–5781 RSC.
- H.-P. Liang, A. Acharjya, D. A. Anito, S. Vogl, T.-X. Wang, A. Thomas and B.-H. Han, ACS Catal., 2019, 9, 3959–3968 CrossRef CAS.
- X. Zhu, C. Tian, G. M. Veith, C. W. Abney, J. Dehaudt and S. Dai, J. Am. Chem. Soc., 2016, 138, 11497–11500 CrossRef CAS PubMed.
- Y. Chen, H. Sun, R. Yang, T. Wang, C. Pei, Z. Xiang, Z. Zhu, W. Liang, A. Li and W. Deng, J. Mater. Chem. A, 2015, 3, 87–91 RSC.
- K. Wang, H. Huang, D. Liu, C. Wang, J. Li and C. Zhong, Environ. Sci. Technol., 2016, 50, 4869–4876 CrossRef CAS PubMed.
- Z. H. Ban, L. K. Keong and A. Mohd Shariff, Adv. Mater. Res., 2014, 917, 134–143 Search PubMed.
- X. Sun, D. Li, W. Gao and H. Yin, Nanotechnology, 2021, 32, 065601 CrossRef CAS PubMed.
- H. J. Kwon, C. Lee, J.-W. Kook, J. H. Kim, K. Hwang and J.-Y. Lee, Macromol. Res., 2021, 28, 1289–1296 CrossRef.
- H. Coskun, A. Aljabour, P. De Luna, D. Farka, T. Greunz, D. Stifter, M. Kus, X. Zheng, M. Liu, A. W. Hassel, W. Schöfberger, E. H. Sargent, N. S. Sariciftci and P. Stadler, Sci. Adv., 2017, e1700686 CrossRef PubMed.
- F. Li, S. Zeng, Y. Bai, H. Dong, H. Wang, X. Ji and X. Zhang, Energy Fuels, 2020, 34, 8526–8533 CrossRef CAS.
- B. Yang, L. Wang, Z. Hua and L. Guo, Ind. Eng. Chem. Res., 2019, 58, 9838–9843 CrossRef CAS.
- Y. Yu, Q.-G. Yin, L.-J. Ye and H. Yu, Macromol. Res., 2021, 29, 605–612 CrossRef CAS.
- Y. Zhang, X. Wang, S. Ma, K. Jiang and X. Han, RSC Adv., 2016, 6, 11325–11328 RSC.
- L. Bechtella, C. Kirschbaum, M. Cosset, G. Clodic, L. Matheron, G. Bolbach, S. Sagan, A. Walrant and E. Sachon, Anal. Chem., 2019, 91, 9102–9110 CrossRef CAS PubMed.
- P. O. Saboe, E. Conte, S. Chan, H. Feroz, B. Ferlez, M. Farell, M. F. Poyton, I. T. Sines, H. Yan, G. C. Bazan, J. Golbeck and M. Kumar, J. Mater. Chem. A, 2016, 4, 15457–15463 RSC.
- F. Ito, Y. Nishiyama, S. Duan and H. Yamada, Macromol. Res., 2019, 28, 365–372 CrossRef.
- I. O. L. Bacellar, M. C. Oliveira, L. S. Dantas, E. B. Costa, H. C. Junqueira, W. K. Martins, A. M. Durantini, G. Cosa, P. Di Mascio, M. Wainwright, R. Miotto, R. M. Cordeiro, S. Miyamoto and M. S. Baptista, J. Am. Chem. Soc., 2018, 140, 9606–9615 CrossRef CAS PubMed.
- J. Yoon, J. Kwag, T. J. Shin, J. Park, Y. M. Lee, Y. Lee, J. Park, J. Heo, C. Joo, T. J. Park, P. J. Yoo, S. Kim and J. Park, Adv. Mater., 2014, 26, 4559–4564 CrossRef CAS PubMed.
- Y. K. Choi, D. Lee, S. Y. Lee, T. J. Shin, J. Park and D. J. Ahn, Macromolecules, 2017, 50, 6935–6944 Search PubMed.
- T.-T. D. Pham, Y. H. Seo, D. Lee, J. Noh, J. Chae, E. Kang, J. Park, T. J. Shin, S. Kim and J. Park, Polymer, 2019, 161, 205–213 CrossRef CAS.
- J. Che, N. Bae, J. Noh, T. Kim, P. J. Yoo, T. J. Shin and J. Park, Macromol. Res., 2019, 27, 427–434 CrossRef CAS.
- V. Javanbakht and M. Mohammadian, J. Mol. Struct., 2021, 1239, 130496 CrossRef CAS.
- K. R. Reddy, H. M. Jeong, Y. Lee and A. V. Raghu, J. Polym. Sci., Part A: Polym. Chem., 2010, 48, 1477–1484 CrossRef CAS.
- J. P. L. E. Garner, S. M. Dyar, A. Chworos, J. J. Sumner and G. C. Bazan, J. Am. Chem. Soc., 2010, 132, 10042–10052 CrossRef PubMed.
- N. Sakai and S. Matile, J. Am. Chem. Soc., 2018, 140, 11438–11443 CrossRef CAS PubMed.
- T. Nishimura, F. Tamura, S. Kobayashi, Y. Tanimoto, F. Hayashi, Y. Sudo, Y. Iwasaki and K. Morigaki, Langmuir, 2017, 33, 5752–5759 CrossRef CAS PubMed.
- B. S. Dakshayini, K. R. Reddy, A. Mishra, N. P. Shetti, S. J. Malode, S. Basu, S. Naveen and A. V. Raghu, Microchem. J., 2019, 147, 7–24 CrossRef CAS.
- Y. Lee, I. Yang, J. E. Lee, S. Hwang, J. W. Lee, S.-S. Um, T. L. Nguyen, P. J. Yoo, H. Y. Woo, J. Park and S. K. Kim, J. Phys. Chem. C, 2013, 117, 3298–3307 CrossRef CAS.
- R. Raveesha, A. M. Anusuya, A. V. Raghu, K. Yogesh Kumar, M. G. Dileep Kumar, S. B. Benaka Prasad and M. K. Prashanth, Comput. Toxicol., 2022, 21, 100202 CrossRef.
- B. Pramodh, P. Naresh, S. Naveen, N. K. Lokanath, S. Ganguly, J. Panda, S. Murugesan, A. V. Raghu and I. Warad, Chem. Data Collect., 2021, 31, 100587 CrossRef CAS.
- S. B. Benaka Prasad, S. Naveen, C. S. Ananda Kumar, N. K. Lokanath, A. V. Raghu, I. Daraghmeh, K. R. Reddy and I. Warad, J. Mol. Struct., 2018, 1167, 215–226 CrossRef CAS.
- J. Coates, Encycl. Anal. Chem., 2006, pp. 1–23 Search PubMed.
- L. De Marco, M. Thamer, M. Reppert and A. Tokmakoff, J. Chem. Phys., 2014, 141, 034502 CrossRef PubMed.
- D. P. Suhas, T. M. Aminabhavi and A. V. Raghu, Appl. Clay Sci., 2014, 101, 419–429 CrossRef CAS.
- D. P. Suhas, T. M. Aminabhavi and A. V. Raghu, Polym. Eng. Sci., 2014, 54, 1774–1782 CrossRef CAS.
- M. Brinkmann, J. Polym. Sci., Part B: Polym. Phys., 2011, 49, 1218–1233 CrossRef CAS.
- J. Noh, S. Jung, G. Kim, D. G. Koo, K. S. Choi, T. J. Shin, C. Yang and J. Park, J. Mol. Liq., 2019, 288, 111046 CrossRef CAS.
- D. March, Handbook of Lipid Bilayers, CRC Press, 2nd edn, 2013, p. 385 Search PubMed.
- W. Stephene Faraci and C. T. Walsh, Biochemistry, 1988, 27, 3267–3276 CrossRef PubMed.
- J. Müllerrová, M. Kaiser, V. Nádaždy, P. Šiffalovič and E. Majková, Sol. Energy, 2016, 134, 294 CrossRef.
- F. C. Spano and C. Silva, Annu. Rev. Phys. Chem., 2014, 65, 477 CrossRef CAS PubMed.
- P. J. Brown, D. S. Thomas, A. Köhler, J. S. Wilson, J.-S. Kim, C. M. Ramsdale, H. Sirringhaus and R. H. Friend, Phys. Rev. B: Condens. Matter Mater. Phys., 2003, 67, 064203 CrossRef.
- M. Böckmann, T. Schemme, D. H. de Jong, C. Denz, A. Heuer and N. L. Doltsinis, Phys. Chem. Chem. Phys., 2015, 17, 28616 RSC.
- B. X. Dong, J. A. Amonoo, G. E. Purdum, Y. L. Loo and P. F. Green, ACS Appl. Mater. Interfaces, 2016, 8, 31144–31153 CrossRef CAS PubMed.
- N. Jiang, L. Sendogdular, M. Sen, M. K. Endoh, T. Koga, M. Fukuto, B. Akgun, S. K. Satija and C. Y. Nam, Langmuir, 2016, 32, 10851–10860 CrossRef CAS PubMed.
Footnote |
| † Electronic supplementary information (ESI) available. See DOI: 10.1039/d2ra00453d |
| This journal is © The Royal Society of Chemistry 2022 |

