 Open Access Article
Excellent physicochemical and sensing characteristics of a RexOy based pH sensor at low post-deposition annealing temperature†
Munmun Dasa,
Titisha Chakrabortya,
Kin Fong Lei b,
Chan Yu Linc and
Chyuan Haur Kao
 *acde
*acde
aDepartment of Electronic Engineering, Chang Gung University, 259 Wen-Hwa 1st Road, Kwei-Shan, Tao-Yuan 333, Taiwan, Republic of China
bBiomedical Engineering, Chang Gung University, Taoyuan, Taiwan
cKidney Research Center, Department of Nephrology, Chang Gung Memorial Hospital, No. 5, Fuxing St., Guishan Dist., Taoyuan City 333, Taiwan, Republic of China
dDepartment of Electronic Engineering, Ming Chi University of Technology, 284 Gungjuan Rd, Taishan Dist., New Taipei City 24301, Taiwan, Republic of China
eCenter for Green Technology, Chang Gung University, 259 Wen-Hwa 1st Road, Kwei-Shan, Tao-Yuan 333, Taiwan, Republic of China
First published on 6th May 2022
Abstract
pH monitoring in clinical assessment is pivotal as pH imbalance significantly influences the physiological and extracellular functions of the human body. Metal oxide based pH sensors, a promising alternative to bulky pH electrodes, mostly require complex fabrication, high-temperature post-deposition treatment, and high expenses that inhibit their practical applicability. So, there is still room to develop a straightforward and cost-effective metal oxide based pH sensor comprising high sensitivity and reliability. In this report, a novel solution-processed and low-temperature annealed (220 °C) mixed-valence (VII/VI) oxide of rhenium (RexOy) was applied in an electrolyte–insulator–semiconductor (EIS) structure. The annealing effect on morphological, structural, and compositional properties was scrutinized by physical and chemical characterizations. The post-annealed RexOy exhibited a high pH sensitivity (57.3 mV pH−1, R2 = 0.99), a lower hysteresis (4.7 mV), and a reduced drift rate (1.7 mV h−1) compared to the as-prepared sample for an analytically acceptable pH range (2–12) along with good stability and reproducibility. The magnified sensing performance originated due to the valence state of Re from Re6+ to Re7+ attributed to each electron transfer for a single H+ ion. The device showed high selectivity for H+ ions, which was confirmed by the interference study with other relevant ions. The feasibility of the sensor was verified by measuring the device in real samples. Hence, the ease-of-fabrication and notable sensing performance of the proposed sensor endorsed its implementation for diagnosing pH-related diseases.
Introduction
pH (potential of hydrogen) recognition is fundamental in several disciplines, including environmental science, chemical engineering, food science, medicine, and clinical diagnosis, as pH modulates the chemical reactions of the reactant species.1 However, the demand for pH detection tools for clinical diagnosis is increasing swiftly as most biological processes require maintaining a normal pH range (pH 7.2–pH 7.4).2,3 There are extracellular and intracellular buffer systems in the human body that control fluid pH variation.4 The most crucial buffer system is the bicarbonate/carbon dioxide (HCO3−/CO2) system, involving the acid and base loads regulated by the kidney and lungs, respectively.5 An acid–base imbalance of body fluid may indicate the occurrence of renal stone, osteoporosis, metabolic syndrome, muscle wasting, gastrointestinal fluid loss, Gitelman syndrome, and Bartter syndrome.6 Hence, efficient detection of the pH of human body fluids is a prime requirement for diagnosing relevant health issues.The existing pH sensing methods include colorimetric,7 fluorescence,8 a combination of colorimetric and fluorescence,9 electrochemical10 and field effect transistor (FET) based techniques.11 Despite high sensitivity and selectivity, colorimetric and fluorescence suffer challenges arising from photobleaching, dye leaching, dependence on ionic strength of the sample, higher cost, and hardware complications.12 Electrochemical sensors avoid using dye or any external label, but they involve complicated electrode structures. For example, Oliveira et al. applied layer-by-layer films of polyaniline–gum arabic nanocomposite (PANI–GA) and graphene oxide (GO) for electrochemical pH detection.13 Polyaniline thin film deposited on the flexible substrate polyethylene terephthalate coated with indium tin oxide was explored as a pH sensing electrode in a report by Mazzara et al.14 In contrast, the field effect transistor-based technique is the most common approach due to fabrication simplicity, miniaturization, faster response time, good mechanical strength, and cost-friendliness.11 Bergveld first demonstrated the ion-sensitive field effect transistors (ISFET) based sensor, replacing the gate electrode of a metal oxide semiconductor (MOSFET) with the electrolyte, which became the most popular field effect based sensor with time.15 The ISFET without source and drain represents the electrolyte–insulator–semiconductor (EIS) framework with a more straightforward fabrication process.16 The sensing parameters (sensitivity, reliability, and stability) are calculated by analyzing the capacitance–voltage (C–V) measurement, which depends on different operational metrics, such as surface charge, threshold voltage, flat-band voltage, Fermi level, and carrier concentration.17
EIS sensors using micro or nanostructured metal oxide materials have been extensively studied in biosensing applications due to their superior sensing performance. Several metal-oxides, including SnO2, IrO2–rGO, RuO2–Ta2O5, and CeO2, endure excellent pH sensing features.18 In addition, EIS-based pH sensors using various insulating films, like Al2O3, Ta2O5, and HfO2 with high dielectric constants (high k), have drawn attention due to their high charge transfer kinetics.19 However, their sensing performance largely depends on the surface morphology, uniformity, and crystallinity. To obtain the optimum sensing surface microstructure, complicated fabrication methods (electrodeposition, sputtering, and screen printing) and high-temperature post-synthesis annealing treatments are accomplished, leading to high resource and energy expenditure. But, it is well known that the high-temperature annealing treatment originates the silicate or silicide formation at the oxide and silicon substrate interface, causing their electrical response deterioration. To overcome this issue, there is an upsurge to explore pertinent sensing materials that need mild-temperature annealing treatment for their optimized sensing characteristics.
The challenges regarding the complex deposition method and higher energy consumption of traditional metal oxide based EIS sensors can be overcome by applying RexOy as a sensing membrane. Re, a rare-earth transition metal, owns a wide range of oxidation states (−3 to +7). Re(VII) oxide is the most chemically stable state among all other oxide forms of Re.20 It shows a polymeric crystallographic arrangement with van der Waals interaction between oxygen atoms resulting in a large surface area with cleavages, which is highly suitable for sensing applications.21 Moreover, low melting point (225 °C) and low-temperature crystallization facilitate low-temperature applications of the material.22 Various compounds of Re, including alloys, sulfides, and oxides, are applied as catalysts in radiotherapy, petroleum industry, and other organic material syntheses.23 However, RexOy as a sensing membrane in EIS structure has not been explored previously, as far as we know.
In this report, RexOy was employed as the sensing membrane to estimate pH in the electrolyte solution by EIS measurement. The solution-processed RexOy was annealed at 220 °C in oxygen (O2) ambient to fulfill the defects, minimize the impurities, and enhance the surface properties. The surface morphology, crystallinity, and structural composition were evaluated by field emission scanning electron microscopy (FESEM), atomic force microscopy (AFM), X-ray diffraction (XRD), and X-ray photoelectron spectroscopy (XPS). The sensitivity, hysteresis, drift, and anti-interference performance of annealed RexOy were compared to the as-prepared RexOy. Under optimized conditions, the reproducibility and stability of the proposed sensor were evaluated. The practical applicability of the sensing performance of RexOy based EIS sensor in human serum was authenticated by a commercially available pH meter.
Experimental
Chemicals and reagents
Ethanol, lactic acid, rhenium(VII) oxide 99.99% trace metal basis, hydrofluoric (HF) acid, sodium hydroxide (NaOH), sodium chloride (NaCl) 0.1 M, potassium (KCl) 0.1 M, magnesium chloride (MgCl2) 0.1 M, calcium chloride (CaCl2) 0.1 M, human serum normal, epoxy AB (PDMS) were purchased from Sigma Aldrich (united states). pH 2–pH 12 solutions were bought from Honeywell. Deionized (DI) water was accessed from the Millipore Milli-Q plus 185 purification system with a resistivity of 18.2 MΩ.Instruments used for physical and electrical characterization
To elucidate the surface morphology of RexOy film, FESEM images were obtained by a JEOL JSM 7500F (Japan) with a 5 kV operating voltage. The surface roughness of the films was investigated by a Veeco D5000 AFM (United States) instrument using a tapping method with a Si cantilever probe. The crystalline properties and phases were interpreted by XRD characterization using Rigaku D/MAX2000 (Japan) with a Cu Kα (1.54176 Å). The XPS analysis for compositional investigation was obtained by a PHI 5800 ESCA (Japan) XPS system where monochromated Al Kα X-ray (1486.6 eV) with a spot diameter of 100 μm was used. The binding energies of all XPS spectra were calibrated with respect to carbon (C) 1s peak at 284.8 eV. The Gaussian–Lorentzian function was used for line contour fitting, and Shirley background subtraction was used for peak fitting due to its ease of use.The C–V characterization of the RexOy based sensor in the electrolytes was obtained by an HP 4284A LCR meter (United States) at the operating frequency of 500 Hz. A silver/silver chloride (Ag/AgCl) was used as a reference electrode. All the measurements were conducted inside a black box to avoid the undesired interference of light.
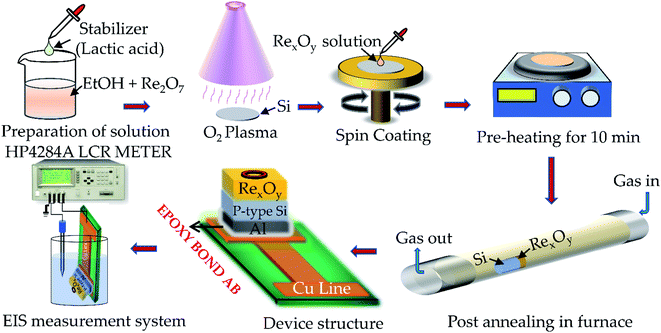
Preparation of RexOy solution
An estimated amount of as-purchased dirhenium heptoxide precursor powder, 99.99% trace metal base, was dissolved into ethanol, maintaining the concentration to 0.1 M. The solution was stirred using a magnetic stirrer for 1 h at 40 °C. Lactic acid was added to the solution dropwise to stabilize the solution for a long time. The colloidal solution was stored at room temperature and kept unperturbed for 2 days to achieve optimum stability and uniformity.Preparation of sensing film
p-Type silicon (Si), selected as the substrate due to its low work function and good adhesion to oxide thin film,24 was cleaned by immersing in hydrofluoric acid (HF)![[thin space (1/6-em)]](https://www.rsc.org/images/entities/char_2009.gif) :
:![[thin space (1/6-em)]](https://www.rsc.org/images/entities/char_2009.gif) DI water = 1
DI water = 1![[thin space (1/6-em)]](https://www.rsc.org/images/entities/char_2009.gif) :
:![[thin space (1/6-em)]](https://www.rsc.org/images/entities/char_2009.gif) 100 solution to remove the native SiO2 from the surface. The Si substrate was treated in a drying oven at 100 °C for 10 minutes to remove the surface water. The substrate was made hydrophilic by treating it with oxygen (O2) plasma for 5 min. After performing the necessary pre-treatments, the Si substrate was coated by the prepared RexOy solution by a spin-coater (Top Tech, Taiwan) with a speed of 2500 rpm for 30 s and then heated at 100 °C for 10 min to remove the organic impurities. The thickness of the film measured by a J. A. Woollam Spectroscopic Ellipsometer (United States) was nearly 50 nm. The as-prepared sample was inserted inside the furnace (Shimadzu, Taiwan) at 220 °C in an O2 ambient for 12 min to obtain the annealed sample. A 300 nm thick aluminum (Al) was deposited using a thermal evaporator (LJ-UHV Technology Co., Ltd., Taiwan) at the back of the as-prepared and annealed sample to make the back contact.
100 solution to remove the native SiO2 from the surface. The Si substrate was treated in a drying oven at 100 °C for 10 minutes to remove the surface water. The substrate was made hydrophilic by treating it with oxygen (O2) plasma for 5 min. After performing the necessary pre-treatments, the Si substrate was coated by the prepared RexOy solution by a spin-coater (Top Tech, Taiwan) with a speed of 2500 rpm for 30 s and then heated at 100 °C for 10 min to remove the organic impurities. The thickness of the film measured by a J. A. Woollam Spectroscopic Ellipsometer (United States) was nearly 50 nm. The as-prepared sample was inserted inside the furnace (Shimadzu, Taiwan) at 220 °C in an O2 ambient for 12 min to obtain the annealed sample. A 300 nm thick aluminum (Al) was deposited using a thermal evaporator (LJ-UHV Technology Co., Ltd., Taiwan) at the back of the as-prepared and annealed sample to make the back contact.
Sensing device fabrication
The sensing films were mounted on a copper printed circuit board (Cu PCB) with conductive silver gel. A circular opening with a 1 mm diameter was drawn on the sensing surface by resin dispensed by a robotic arm to define the sensing window. The sensing chip leaving the circular sensing window was covered by polydimethylsiloxane (PDMS) to prevent unwanted interaction with the analyte. Fabrication of the RexOy based EIS sensing device was shown in Fig. 1.Results and discussion
Morphological, stoichiometric, and structural characterization of the sensing film
Since the surface texture and material distribution highly impact the sensing performance of a film, morphological analysis is crucial. The surface morphology of the as-prepared and annealed RexOy was visualized by FESEM images shown in Fig. 2. A nearly smooth surface with no significant grain growth was observed in the as-prepared sample (Fig. 2(a)). In contrast, the FESEM image of the annealed sample showed a polyhedrally crystalline RexOy surface. The uniformity, crystallinity, and grain growth improved remarkably in the annealed RexOy sample, which facilitated a higher pH response, acquiring an increased the number of surface sites. | ||
| Fig. 2 FESEM images of (a) as-prepared and (b) 220 °C annealed RexOy, AFM images of (c) as-prepared and (d) 220 °C annealed RexOy samples. | ||
In addition to morphological characterization, AFM analysis provides information about profile shape, grain growth, and surface roughness. AFM images presented the surface topography of the as-prepared (Fig. 2(c)) and annealed RexOy film (Fig. 2(d)). The AFM of the as-prepared sample showed an indefinite microstructure with a root mean square (RMS) surface roughness of 0.64 nm, indicating its polycrystallinity and poor grain growth. The sample was annealed at 220 °C in O2 ambient to improve the film quality, which showed more prominent grain and vastly increased surface roughness (12.92 nm). This phenomenon stipulated that better crystalline growth took place at 220 °C annealing temperature as the vacancy-related defects were fulfilled due to the optimum heat and presence of oxygen. The increased grain growth in annealed RexOy is attributed to the high pH sensing performance of the sensing film.
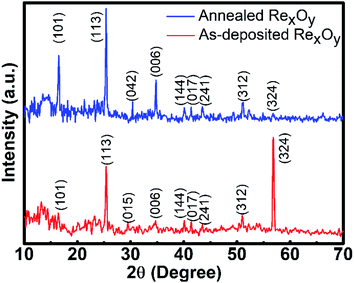
The crystallinity and crystal phases of as-prepared and annealed RexOy were demonstrated in XRD spectra, as shown in Fig. 3. The as-prepared sample obtained (101), (113), (015), (006), (144), (017), (241), (312), and (324) crystalline planes, whereas the planes at (101), (113), (042), (006), (144), (017), (241), (312), and (324) directions were observed in 220 °C annealed sample (mp-1016092).25 The (324) plane at ∼56.77° was dominant in the as-prepared sample, whereas (113) at ∼25.59° became the most significant peak in the 220 °C annealed sample, indicating their corresponding preferred location. The yield effect in grains can explain the potential change in preferred location after annealing. The annealing process increased the grain growth in RexOy thin-film, thereby increasing the in-plane stress in the grains.26 When the RexOy thin-film initiates to yield with the thermal treatment of the pristine sample, the grains in (113) direction start to yield more rapidly than the grains oriented in (324) direction. Hence, the (113) grains obtain more energy to promote further grain growth in the annealed sample. Thus, the change in preferred orientation of the annealed RexOy at (113) compared to the as-prepared sample can be justified. The thermal treatment cumulates higher energy positions to produce superior nucleation positions, facilitating consistent recrystallization of grains. The disappearance of the (015) plane and the occurrence of (042) direction 220 °C annealed sample compared to the as-prepared one indicated the crystalline structure change after annealing. Moreover, the annealing process circumvented structural deformation and vacancy-related defects, resulting in a more stable crystalline structure than the pristine one, indicated by the sharper XRD peaks in the annealed sample. The interplanar spacing d = 3.38 Å for (113) dominant direction, calculated by Bragg's equation (λ = 2d![[thin space (1/6-em)]](https://www.rsc.org/images/entities/char_2009.gif) sin
sin![[thin space (1/6-em)]](https://www.rsc.org/images/entities/char_2009.gif) θ), was nearly similar to the d spacing (d = 3.63 Å) estimated in ref. 27. All other peaks appeared sharper in the 220 °C annealed sample implying the better crystalline properties of the 220 °C annealed RexOy than the as-prepared sample, probably due to defect repairing and stronger bonding between Re and O. This result was consistent with the AFM analysis, supporting the improvement in the pH response of RexOy after annealing. The number of surface sites extensively depends on the surface stoichiometry, thereby influencing the surface ion-exchange property. For this purpose, XPS analysis was executed to examine the chemical states and composition of as-deposited and annealed RexOy. In Fig. 4(a) and (b), the XPS scan in the region, Re 4f of as-deposited RexOy and 220 °C annealed RexOy were compared. Two spin–orbit-split peaks (Re 4f7/2 and Re 4f5/2) were observed for Re7+ species, whereas only one broad peak of Re6+ was noticed due to its presence in a low amount compared to Re7+ in both as-deposited and annealed RexOy.28 The XPS peak maxima for Re 4f7/2 were located at 45.14 eV, whereas Re 4f5/2 was at 47.50 eV in the as-deposited RexOy sample. In the XPS of the annealed sample, the Re 4f7/2 and Re 4f5/2 peaks shifted by 0.26 eV and 0.21 eV, respectively, towards higher binding energy, which implies the improved oxide formation compared to the as-deposited sample. Fig. 4(c) and (d) demonstrate the O 1s core-level XPS spectra for as-deposited and annealed RexOy. The XPS of O 1s was deconvoluted into three prominent peaks representing (1) Re(VII) oxide at the lowest binding energy, (2) Re(VI) oxygen at the second-lowest binding energy, and (3) Re-hydrous (Re–OH) species at the highest binding energy. The Re(VII) and Re(VI) oxygen peak of the annealed sample shifted more towards lower binding energy by 0.31 eV and 0.18 eV compared to the peak positions of the oxygen regarding Re(VII) at 531 eV and Re(VI) at 531.9 eV of the as-prepared sample. This phenomenon was impressively consistent with the higher binding energy shift of the Re(VII) XPS peaks, indicating the stoichiometric improvement due to annealing. The higher intensity of the Re(VII) and Re(VI) oxygen peaks of the annealed sample denotes the emergence of a maximum amount of metallic oxide than that of the as-deposited film. Moreover, the Re–OH peaks originated from the environmental hydrous species, and defects on the surface were noticeably decreased in the XPS of the annealed sample, which implies the presence of a less amount of contaminant and defect repairing in the annealed sample compared to the as-deposited one. Fig. S1, ESI,† demonstrates the survey spectra of as-prepared and annealed RexOy.
θ), was nearly similar to the d spacing (d = 3.63 Å) estimated in ref. 27. All other peaks appeared sharper in the 220 °C annealed sample implying the better crystalline properties of the 220 °C annealed RexOy than the as-prepared sample, probably due to defect repairing and stronger bonding between Re and O. This result was consistent with the AFM analysis, supporting the improvement in the pH response of RexOy after annealing. The number of surface sites extensively depends on the surface stoichiometry, thereby influencing the surface ion-exchange property. For this purpose, XPS analysis was executed to examine the chemical states and composition of as-deposited and annealed RexOy. In Fig. 4(a) and (b), the XPS scan in the region, Re 4f of as-deposited RexOy and 220 °C annealed RexOy were compared. Two spin–orbit-split peaks (Re 4f7/2 and Re 4f5/2) were observed for Re7+ species, whereas only one broad peak of Re6+ was noticed due to its presence in a low amount compared to Re7+ in both as-deposited and annealed RexOy.28 The XPS peak maxima for Re 4f7/2 were located at 45.14 eV, whereas Re 4f5/2 was at 47.50 eV in the as-deposited RexOy sample. In the XPS of the annealed sample, the Re 4f7/2 and Re 4f5/2 peaks shifted by 0.26 eV and 0.21 eV, respectively, towards higher binding energy, which implies the improved oxide formation compared to the as-deposited sample. Fig. 4(c) and (d) demonstrate the O 1s core-level XPS spectra for as-deposited and annealed RexOy. The XPS of O 1s was deconvoluted into three prominent peaks representing (1) Re(VII) oxide at the lowest binding energy, (2) Re(VI) oxygen at the second-lowest binding energy, and (3) Re-hydrous (Re–OH) species at the highest binding energy. The Re(VII) and Re(VI) oxygen peak of the annealed sample shifted more towards lower binding energy by 0.31 eV and 0.18 eV compared to the peak positions of the oxygen regarding Re(VII) at 531 eV and Re(VI) at 531.9 eV of the as-prepared sample. This phenomenon was impressively consistent with the higher binding energy shift of the Re(VII) XPS peaks, indicating the stoichiometric improvement due to annealing. The higher intensity of the Re(VII) and Re(VI) oxygen peaks of the annealed sample denotes the emergence of a maximum amount of metallic oxide than that of the as-deposited film. Moreover, the Re–OH peaks originated from the environmental hydrous species, and defects on the surface were noticeably decreased in the XPS of the annealed sample, which implies the presence of a less amount of contaminant and defect repairing in the annealed sample compared to the as-deposited one. Fig. S1, ESI,† demonstrates the survey spectra of as-prepared and annealed RexOy.
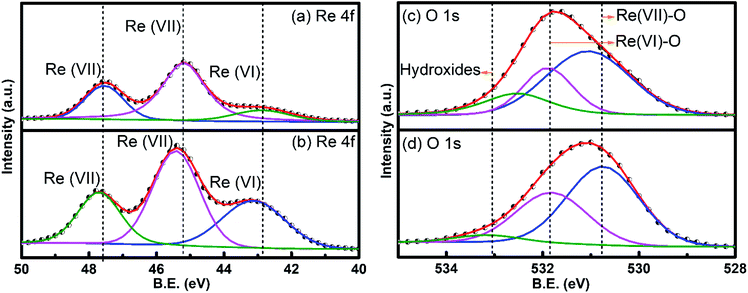 | ||
| Fig. 4 XPS of (a) Re 4f of as-prepared RexOy (b) Re 4f of 220° annealed RexOy (c) O 1s of as-prepared RexOy (d) O 1s of 220 °C annealed RexOy. | ||
pH sensing performance
In general, the site-binding theory can explain the pH sensing phenomena of metal oxide (MOx)-based insulators/semiconductors, depending on the formation of net surface charge.29 A metal surface contains many unsatisfied valences, referred to as dangling bonds of the hydroxyl (OH) group, which bind the H+ and OH− of the analyte. The amphoteric OH groups (M–OH) are formed on the surface when the unsatisfied bonds couple the ions from the analyte. These groups captivate the H+ ions for the low pH value of the analyte forming the proton acceptor groups (M–OH2+). Similarly, for the higher pH value of the analyte, the surface hydroxyl groups donate H+ creating proton donor groups (M–O−). The H+ ion sensitivity of the metal oxide surface is determined by the parameter β given in eqn (1).
 | (1) |
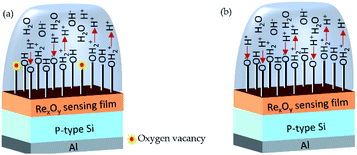
In the case of RexOy thin film, Re–OH2+, Re–OH, and O–O− are considered as the H+ ion binding sites based on the above discussion. The surface site dependent pH response of RexOy can be realized by probing the XPS analysis. The O 1s XPS spectra confirmed that more lattice oxygen was formed in the annealed sample than in the as-prepared one. Consequently, more oxygen vacancies appeared on the as-prepared sample resulting in fewer binding sites. In contrast, as the oxygen vacancies were repaired due to annealing at 220 °C, the surface sites significantly increased (Ns). The improved sensitivity of the 220 °C annealed RexOy than its as-prepared form may be attributed to the vacancy fulfillment resulting in better crystallinity and surface roughness. Hence, the sensitivity parameter β also increased in the case of 220 °C annealed RexOy film as surface sites (Ns) increased correspondingly. The pictorial representation of the ion-exchange mechanism of as-prepared and annealed RexOy is shown in Fig. 5.
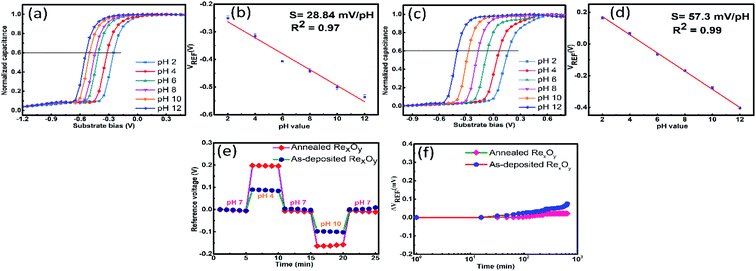
To determine the pH sensitivity of the as-prepared and 220 °C annealed RexOy based EIS sensor, C–V curves (Fig. 6) were obtained for different pH solutions ranging from pH2–pH12 by applying sweep voltage to the back-contact, and the Ag/AgCl reference electrode was connected to the ground. The corresponding reference voltage was determined from 0.4Cnormalized for all pH values. The flat band voltage was shifted according to the varying pH can be portrayed in eqn (2).30
 | (2) |
The chemical equation involving the conversation of the rhenium oxide redox couples (Re6+/Re7+) is given below:
| Re(OH)6 ↔ Re(OH)5O− + H+ | (3) |
| Re2O(OH)12 ↔ Re2O(OH)10O22− + 2H+ | (4) |
| 2Re(OH)6 + H2O ↔ Re2O(OH)12 + 2H+ + 2e−1 | (5) |
Substituting eqn (3) and (4) into eqn (5), the resulting redox reaction is given below:
| 2Re(OH)5O− + H2O ↔ Re2O(OH)10O22− + 2H+ + 2e−1 | (6) |
The theoretical pH sensitivity of the RexOy based can be calculated from the ideal Nernst equation30 by analyzing the value of the potential difference across the sensing membrane given in eqn (7).
| E = E0 − 0.059 × pH | (7) |
![[thin space (1/6-em)]](https://www.rsc.org/images/entities/char_2009.gif) :
:![[thin space (1/6-em)]](https://www.rsc.org/images/entities/char_2009.gif) 1. Hence, the theoretically estimated sensitivity of the RexOy based sensor was equivalent to the ideal Nernst sensitivity, i.e., 59 mV pH−1. In our study, the sensitivity achieved for RexOy based pH sensor was 57.3 mV pH−1, close enough to the calculated value. The negligible decline in the actual sensitivity compared to the calculated one may arise due to the insignificant stoichiometric imperfection. However, the poor crystallinity and lower surface roughness of the as-prepared sample resulted in a considerable difference in the sensitivity compared to the calculated value. Due to the lack of surface sites in the as-prepared sample originating from the oxygen vacancy-related defects, the proton to electron transfer ratio (H+/e−1) becomes less than one, attributing to much lower pH sensitivity (28.8 mV pH−1).
1. Hence, the theoretically estimated sensitivity of the RexOy based sensor was equivalent to the ideal Nernst sensitivity, i.e., 59 mV pH−1. In our study, the sensitivity achieved for RexOy based pH sensor was 57.3 mV pH−1, close enough to the calculated value. The negligible decline in the actual sensitivity compared to the calculated one may arise due to the insignificant stoichiometric imperfection. However, the poor crystallinity and lower surface roughness of the as-prepared sample resulted in a considerable difference in the sensitivity compared to the calculated value. Due to the lack of surface sites in the as-prepared sample originating from the oxygen vacancy-related defects, the proton to electron transfer ratio (H+/e−1) becomes less than one, attributing to much lower pH sensitivity (28.8 mV pH−1).
Although the RexOy based pH sensor achieved high sensitivity, the assessment of short-term (hysteresis) and long-term (drift) reliability is a prime requirement. The hysteresis effect of the sensor was obtained by evaluating the difference between the starting and terminal value of VREF for pH 7 after attaining a varying pH loop of pH 7 → pH 4 → pH 7 → pH 10 → pH7 for 25 min. Fig. 6(e) compares the hysteresis curves for as-prepared and annealed RexOy based sensors. The hysteresis values achieved by the as-prepared and annealed sample were 6.1 mV and 4.7 mV, respectively. The hysteresis effect is mainly attributed to surface defects, unsatisfied bonds, and scattered ions. As annealing helped the RexOy surface become uniform, continuous, and depleted of defects, the annealed sample obtained minimized hysteresis compared to the as-prepared one.
The comparative representation of the drift characteristic for as-prepared and annealed RexOy is shown in Fig. 6(f). The drift rate was determined as the rate change of the difference in VREF between the initial and final hour with respect to time (h) immersing the sensor in pH 7 for 12 h. A high drift rate (6.2 mV h−1) was procured for the as-prepared sample, whereas a noticeably lower drift (1.7 mV h−1) was obtained for the annealed sample. The undesired drift phenomena occurred due to the surface pinning effect, presence of unsatisfied bonds, and dispersive transport. In the case of the annealed sample, a thick hydrous layer was formed upon simmering the device for the long term as the surface contained fewer dangling bonds than the as-prepared sample. Therefore, the hydrous layer resisted the further interaction between the sensing surface and the analyte over time, resulting in the minimized drift rate of the annealed sample. Conversely, the higher stoichiometric defects of the as-prepared sample, unable to create a stable hydrous layer over time, obtained a relatively higher drift rate. The pH sensitivity, hysteresis, and drift rate of the annealed RexOy were compared to other existing reports in Table 1.
| Sensing material | Deposition method | pH sensitivity (mV pH−1) | Hysteresis (mV) | Drift (mV h−1) |
|---|---|---|---|---|
| SiO2 (ref. 32) | Low-pressure chemical vapor deposition | 41.5 | 19.6 | 19.4 |
| Al2O3 (ref. 33) | Atomic layer deposition | 55 | — | 5.5 |
| Si3N4 (ref. 34) | Low-pressure chemical vapor deposition | 50 | 21 | 4 |
| HfO2 (ref. 35) | Radio frequency sputtering | 51 | 25 | 1 |
| PbTiO3 (ref. 36) | Sol–gel | 56–59 | — | — |
| Ta2O5 (ref. 37) | Thermal oxidation of Ta | 56 | 5 | — |
| RexOy (this work) | Solution | 57.3 | 4.7 | 1.7 |
Selectivity, reproducibility, and stability analysis
Selectivity, reproducibility, and stability analysis are essential for evaluating the sensing performance of a sensor. The interference study of the annealed RexOy pH sensor for H+ ion was examined in the analytes containing sodium (Na+), potassium (K+), calcium (Ca2+), and magnesium (Mg2+) ions. The actual blood sample contains different ions such as Na+, K+, Ca2+, Mg2+, etc. Na+ and K+ are directly involved in the ion balance of blood along with the H+ ion, whereas other divalent ions are related to oxygen transport, cell signaling, gene mutation, and neurotransmission.38 The concentrations of all ions were maintained at 10−1 to 10−5 M, comparable to their actual concentration present in the real sample. The Na+, K+, Mg2+, and Ca2+, sensitivities (Fig. S2(a), (c), (e) and (g), ESI†) of the as-prepared RexOy were 4.2 mV pNa−1 (R2 = 0.98), 2.3 mV pK−1 (R2 = 0.90), 5.3 mV pMg−1 (R2 = 0.96), and 4.6 mV pCa−1 (R2 = 0.98) whereas the annealed sample obtained the Na+, K+, Mg2+, and Ca2+ sensitivities as low as 10.7 mV pNa−1 (R2 = 0.99), 6.7 mV pK−1 (R2 = 0.92), 11.0 mV pMg−1 (R2 = 0.96), and 9.3 mV pCa−1 (R2 = 0.99), depicted in Fig. S2(b), (d), (f) and (h).† The Na+, K+, Mg2+, and Ca2+ sensitivities of both as-prepared and annealed samples were much lower than the H+ ion sensitivities, probably due to the smaller dimension and lighter weight of the H+ ion compared to Na+, K+, Mg2+, and Ca2+ ions.39 Therefore, the RexOy can be considered more selective to H+ ions than the interferent ions. A comparative representation of the H+ and interfering ion sensitivities is depicted in Table 2.| Sensing film | Na+ sensitivity (mV pNa−1) | K+ sensitivity (mV pK−1) | Mg2+ sensitivity (mV pMg−1) | Ca2+ sensitivity (mV pCa−1) | H+ sensitivity (mV pH−1) |
|---|---|---|---|---|---|
| As-prepared RexOy | 4.2 (R2 = 0.98) | 2.3 (R2 = 0.90) | 5.3 (R2 = 0.96) | 4.6 (R2 = 0.98) | 28.8 (R2 = 0.97) |
| 220 °C annealed RexOy | 10.7 (R2 = 0.99) | 6.7 (R2 = 0.92) | 11.0 (R2 = 0.96) | 9.3 (R2 = 0.99) | 57.3 (R2 = 0.99) |
Producing the same outputs for different identical devices is called reproducibility. Fig. 7(a) presents the comparison bar graph of the sensitivities achieved by four different devices measured in pH (2–12). The four devices showed sensitivities of 57.32 mV pH−1, 57.03 mV pH−1, 55.85 mV pH−1, 55.82 mV pH−1. The percentage of relative standard deviation (RSD%) of the sensitivities of four different devices was estimated as 1.07%. The change in the sensitivity varied within the space 5% tolerance range, which is acceptable for clinical measurements.
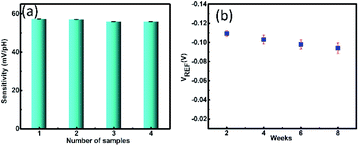 | ||
| Fig. 7 (a) Reproducibility of RexOy based pH sensor demonstrating the similar sensitivities of different samples (b) stability analysis of RexOy based pH sensors for 8 weeks. | ||
The stability of a sensor is referred to as the capability to maintain an identical output over a constant time duration. The stability test of the RexOy based pH sensor was conducted for 8 weeks by monitoring the reference voltage shift of the device in pH 7, as shown in Fig. 7(b). The device showed only 13% degradation of the reference voltage in 8 weeks compared to its initial value in the 1st week, indicating sufficient long-term sensor stability. However, the inaccuracy mentioned above of the pH sensor over the long-term use can be evaded by recalibrating the sensor prior to the measurement.
Real sample analysis
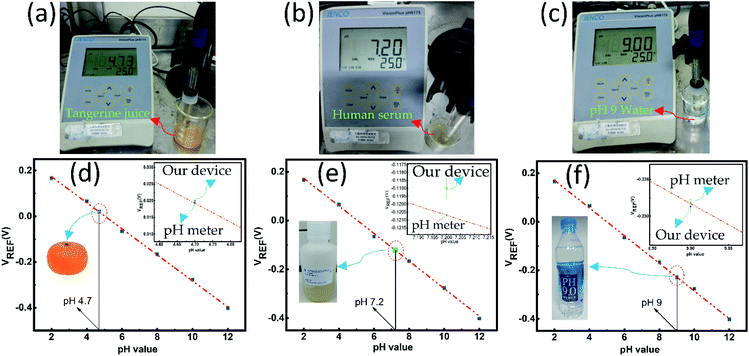
The real sample analysis of the sensor was performed by measuring the pH value of tangerine juice (acidic), human serum (nearly neutral), and alkaline drinking water (Uni-President, Taiwan). Initially, the pH values of the above-mentioned samples were determined by a commercially available JENCO Vision Plus pH6175 pH meter (United States). The pH meter displayed the pH values of tangerine juice, human serum, and alkaline water as pH 4.7, pH 7.2, and pH 9, respectively, as shown in Fig. 8(a)–(c). Fig. 8(d)–(f) show that the pH values of the tangerine juice, human serum, and alkaline drinking water were estimated from the calibration plot (Fig. 5(d)), which was almost the same as the pH values measured by the pH meter. The inset shows the magnified image of the deviation of the expected and the measured value on the calibration plot. The relative errors (%) for the pH measurement of the tangerine juice, human serum, and alkaline water were calculated as −3%, +1.7%, and +0.2%, respectively. All the measurements were repeated thrice to obtain the standard error bar.Conclusion
In this report, we developed a RexOy based EIS pH sensor. The RexOy thin film was deposited on Si by spin-coating the RexOy solution. To improve the microstructural properties of RexOy, beneficial for pH sensing, post-deposition annealing treatment at 220 °C was executed. The morphological, structural, and compositional betterment of the annealed sample compared to the as-prepared one was confirmed by FESEM, AFM, XRD, and XPS analysis. The pH sensing performance of the as-prepared and annealed sample was evaluated by capacitance–voltage (C–V) characterization. The annealed sample showed significant improvement in terms of sensitivity (57.3 mV pH−1), hysteresis (4.7 mV), and drift (1.7 mV h−1) compared to the as-prepared sample. After annealing, the enhanced sensing performance was achieved due to the improved stoichiometry fostering the active redox exchange reaction. The annealed sample also showed better selectivity for H+ ion than the as-prepared sample as per the interference study was conducted with the analytes containing interfering ions. The reproducibility and stability study of the annealed sample depicted that the sensor is repeatable and impressively stable (8 weeks). The RexOy pH sensor measured the pH of the real samples (tangerine juice, human serum, and alkaline drinking water) with high accuracy. The excellent pH sensing performance of the RexOy based sensor evidences the potential of the sensor for the futuristic application as a reliable platform for complex biomolecule conjugation.Author contributions
Munmun Das: conceptualization, data curation, formal analysis, investigation, methodology, writing – original draft. Titisha Chakraborty: methodology, investigation, formal analysis. Kin Fong Lei: methodology. Chan Yu Lin: methodology, Chyuan Haur Kao: project administration, funding acquisition, supervision, validation, writing – review & editing.Conflicts of interest
The funders had no role in the design of the study; in the collection, analyses, or interpretation of data; in the writing of the manuscript, or in the decision to publish the results.Acknowledgements
This study was supported in part by a grant from the Chang Gung Medical Foundation grant CMRP program (Assistance Agreement CMRPD2J0092, CMRPD2H0182, and BMRPA00). This study was conducted by the Ministry of Science and Technology (MOST; MOST 110-2221-E-182-032).References
- P. Salvo, N. Calisi, B. Melai, B. Cortigiani, M. Mannini, A. Caneschi, G. Lorenzetti, C. Paoletti, T. Lomonaco, A. Paolicchi, I. Scataglini, V. Dini, M. Romanelli, R. Fuoco and F. Di Francesco, Biosens. Bioelectron., 2017, 91, 870–877 CrossRef CAS PubMed.
- J. H. Yoon, S. M. Kim, H. J. Park, Y. K. Kim, D. X. Oh, H. W. Cho, K. G. Lee, S. Y. Hwang, J. Park and B. G. Choi, Biosens. Bioelectron., 2020, 150, 111946 CrossRef CAS PubMed.
- K. Enomoto and M. Hotomi, Endocrinol. Metab., 2020, 35, 227–236 CrossRef CAS PubMed.
- W. Aoi and Y. Marunaka, BioMed Res. Int., 2014, 2014, 598986 Search PubMed.
- L. L. Hamm, N. Nakhoul and K. S. Hering-Smith, Clin. J. Am. Soc. Nephrol., 2015, 10, 2232–2242 CrossRef CAS PubMed.
- J. Pizzorno, J. Integr. Med., 2015, 14, 8–12 Search PubMed.
- N. Promphet, P. Rattanawaleedirojn, K. Siralertmukul, N. Soatthiyanon, P. Potiyaraj, C. Thanawattano, J. P. Hinestroza and N. Rodthongkum, Talanta, 2019, 192, 424–430 CrossRef CAS PubMed.
- N. Promphet, J. P. Hinestroza, P. Rattanawaleedirojn, N. Soatthiyanon, K. Siralertmukul, P. Potiyaraj and N. Rodthongkum, Sens. Actuators, B, 2020, 321, 128549 CrossRef CAS.
- L. Wang, M. Li, W. Li, Y. Han, Y. Liu, Z. Li, B. Zhang and D. Pan, ACS Sustainable Chem. Eng., 2018, 6, 12668–12674 CrossRef CAS.
- R. Wang, Q. Zhai, Y. Zhao, T. An, S. Gong, Z. Guo, Q. Q. Shi, Z. Yong and W. Cheng, J. Mater. Chem. B, 2020, 8, 3655–3660 RSC.
- M. Schöning, Sensors, 2005, 5, 126–138 CrossRef.
- M. I. Khan, K. Mukherjee, R. Shoukat and H. Dong, Microsyst. Technol., 2017, 23, 4391–4404 CrossRef CAS.
- R. D. Oliveira, J. Pscheidt, C. S. Santos, R. T. Ferreira, G. Marciniuk, J. R. Garcia, M. Vidotti, L. F. Marchesi and C. A. Pessoa, J. Electrochem. Soc., 2020, 167, 047505 CrossRef CAS.
- F. Mazzara, B. Patella, C. D’Agostino, M. G. Bruno, S. Carbone, F. Lopresti, G. Aiello, C. Torino, A. Vilasi, A. O’Riordan and R. Inguanta, Chemosensors, 2021, 9(7), 169 CrossRef CAS.
- P. Bergveld, IEEE Trans. Biomed. Eng., 1970, 17, 70–71 CAS.
- A. Poghossian and M. J. Schöning, Sensors, 2020, 20, 5639 CrossRef CAS PubMed.
- E. M. Al-Khalqi, M. A. Hamid, R. Shamsudin, N. H. Al-Hardan, A. Jalar and L. K. Keng, IEEE Sens. J., 2021, 21, 6234–6240 CAS.
- L. Manjakkal, D. Szwagierczak and R. Dahiya, Prog. Mater. Sci., 2020, 109, 100635 CrossRef CAS.
- T. Rao, J. Li, W. Cai, M. Wu, J. Jiang, P. Yang, Y. Zhou and W. Liao, ACS Omega, 2021, 6, 32297–32303 CrossRef CAS PubMed.
- T. Chatterjee and M. Ravikanth, Coord. Chem. Rev., 2020, 422, 213480 CrossRef CAS.
- B. Krebs, A. Mueller and H. H. Beyer, Inorg. Chem., 1969, 8, 436–443 CrossRef CAS.
- Y. Jia, L. Duan, D. Zhang, J. Qiao, G. Dong, L. Wang and Y. Qiu, J. Phys. Chem. C, 2013, 117, 13763–13769 CrossRef CAS.
- V. G. Kessler and G. A. Seisenbaeva, Minerals, 2012, 2, 244–257 CrossRef CAS.
- R. Marnadu, J. Chandrasekaran, P. Vivek, V. Balasubramani and S. Maruthamuthu, Z. Phys. Chem., 2020, 234, 355–379 CrossRef CAS.
- K. Persson, Materials Data on Re2O7 (SG:19), Materials Project, (accessed March 2022), DOI:10.17188/1338673, https://materialsproject.org/docs/calculations.
- S. Du and Y. Li, Adv. Mater. Sci. Eng., 2015, 2015, 1–8 Search PubMed.
- The Materials Project, Materials Data on Re2O7 by Materials Project, United States: N. p., 2020, DOI:10.17188/1338673, accessed March 2022.
- W. T. Tysoe, F. Zaera and G. A. Somorjai, Surf. Sci., 1988, 200, 1–14 CrossRef CAS.
- M. Piacenti da Silva, J. C. Fernandes, N. B. de Figueiredo, M. Congiu, M. Mulato and C. F. de Oliveira Graeff, AIP Adv., 2014, 4, 037120 CrossRef.
- C. H. Kao, C. W. Chang, Y. Tzu Chen, W. Ming Su, C. Cheng Lu, C. Y. Lin and H. Chen, Sci. Rep., 2017, 7, 2405 CrossRef PubMed.
- H. R. Sadig, L. Cheng and T. F. Xiang, Arabian J. Chem., 2019, 12, 610–620 CrossRef CAS.
- M. Liu, R. Liu and W. Chen, Biosens. Bioelectron., 2013, 45, 206–212 CrossRef CAS PubMed.
- J. Y. Oh, H.-J. Jang, W. J. Cho and M. S. Islam, Sens. Actuators, B, 2012, 171–172, 238–243 CrossRef CAS.
- H. J. Jang, M. S. Kim and W. J. Cho, IEEE Electron Device Lett., 2011, 32, 973–975 CAS.
- T. F. Lu, J. C. Wang, C.-M. Yang, C. P. Chang, K. I. Ho, C. F. Ai and C. S. Lai, Microelectron. Reliab., 2010, 50, 742–746 CrossRef CAS.
- B. Wang, W. Huang, L. Chi, M. Al-Hashimi, T. J. Marks and A. Facchetti, Chem. Rev., 2018, 118, 5690–5754 CrossRef CAS PubMed.
- M. J. Schöning, D. Brinkmann, D. Rolka, C. Demuth and A. Poghossian, Sens. Actuators, B, 2005, 111–112, 423–429 CrossRef.
- X. Zheng, W. Cheng, C. Ji, J. Zhang and M. Yin, Rev. Anal. Chem., 2020, 39, 231–246 CrossRef CAS.
- C. H. Kao, C. S. Liu, S. H. Lu, S. C. Tsai, W. L. Chan, B. H. Lin, C. F. Lin, H. Chen and J. Han, IEEE Sens. J., 2020, 20, 10653–10663 CAS.
Footnote |
| † Electronic supplementary information (ESI) available. See https://doi.org/10.1039/d2ra01177h |
| This journal is © The Royal Society of Chemistry 2022 |

