 Open Access Article
A reasonably constructed fluorescent chemosensor based on the dicyanoisophorone skeleton for the discriminative sensing of Fe3+ and Hg2+ as well as imaging in HeLa cells and zebrafish†
Chuqi Zhang,
Xinyan Lv,
Xiuhong Liu *,
Hongyun Chen* and
Haifeng He
School of Chemistry and Chemical Engineering, Jiangxi Science and Technology Normal University, Nanchang 330013, People's Republic of China. E-mail: xiuhong0627@163.com; chenhongyun92@126.com
First published on 25th April 2022
Abstract
In this study, a new fluorescent sensor dicyanoisophorone Rhodanine-3-acetic acid (DCI-RDA) (DCI-RDA) has been developed by employing a DCI-based push–pull dye as the fluorophore and RDA as the recognition moiety for the simultaneous sensing of Fe3+ and Hg2+ with a large Stokes Shift (162 nm), high selectivity and sensitivity, and low LOD (1.468 μM for Fe3+ and 0.305 μM for Hg2+). In particular, DCI-RDA has a short response time (30 s). The Job's plot method in combination with 1H NMR titration and theoretical calculations was used to determine the stoichiometry of both DCI-RDA-Fe3+/Hg2+ complexes to be 1![[thin space (1/6-em)]](https://www.rsc.org/images/entities/char_2009.gif) :
:![[thin space (1/6-em)]](https://www.rsc.org/images/entities/char_2009.gif) 1. Moreover, DCI-RDA is applied as a fluorescent probe for imaging in HeLa cells and zebrafish, indicating that it can be potentially applied for Fe3+/Hg2+ sensing in the field of biology.
1. Moreover, DCI-RDA is applied as a fluorescent probe for imaging in HeLa cells and zebrafish, indicating that it can be potentially applied for Fe3+/Hg2+ sensing in the field of biology.
1. Introduction
Different elements play different roles in the human body; for example, iron is the most important, abundant, and sophisticated transition metal within these metal cations, which exist in the structure of numerous proteins and enzymes. Normal iron concentration levels are very essential for the human body because it is responsible for a variety of cell functions including electron transfer, transcriptional regulation, and oxygen uptake.1–3 Insufficient or excess iron can cause numerous diseases such as cancer, Alzheimer's disease, Parkinson's disease, renal injury, and iron deficiency anemia.4–6 On the other hand, mercury is widely used today; it exists in three forms, namely, elemental, inorganic and organic mercury. Hg2+ ions can be converted into methyl mercury, which is one of the most powerful neurotoxins for mammals.7 Numerous studies have shown that mercury is one of the most toxic heavy metal ions in the living system, and even low doses of mercury may lead to neurological symptoms, damage to the kidneys, brain and hormonal immunological changes because mercury cations can coordinate with sulfur-containing enzymes and proteins.8 In addition, since the nervous system is highly sensitive to mercury, its exposure may cause hallucinations, impaired consciousness, and other irreversible life-threatening complications.9 According to the U.S. EPA, the limit value of iron in drinking water is 0.3 mg L−1, while for mercury, the permitted limit is only 0.002 mg L−1.10 Therefore, it is quite urgent to develop a new, fast, highly sensitive and highly selective method to detect Fe3+ and Hg2+ in in vivo and environment systems.Nowadays, a variety of traditional analytical methods are widely used for the qualitative and quantitative detection of these two ions, such as atomic absorption spectrometry (AAS),11 atomic fluorescence spectrometry (AFS),12 inductively coupled plasma mass spectrometry (ICP-MS),13 and electrochemical methods.14 Although the instrument methodology has the advantages of high sensitivity and small injection volume, it is not only inconvenient to maintain the instrument but also needs complex sample pretreatments and professional operators.15 Thus, researchers have been paying extensive attention to the development of chemosensors to monitor cations due to their relatively low-cost, fast response, and sensitivity for gaining information in real-time even in living cells and organisms.16–18 To date, a large number of fluorescent chemosensors for the selective and sensitive detection of Hg2+,19–24 and Fe3+ (ref. 25–27) have been reported, but most of them can only detect one target. It is well known that bifunctional and multifunctional fluorescent sensors utilize a single host to recognize two or more analytes by distinct fluorescence responses through the same or different channels. Compared with the one-to-one analysis method, the detection of multiple targets with a single sensor is more efficient, hence attracting increasing the attention to this type probe.28 However, very few sensors have been reported for the simultaneous detection of Hg2+ and Fe3+.29–32 Besides, sensors with a long emission wavelength have deeper tissue penetration and minimal background fluorescence.33,34 On top of that, fluorescent probes with relatively small Stokes shifts restrict their further biodetection, while those with large Stokes shifts can effectually reduce interferences resulting from self-absorption by increasing spectral separation between excitation and emission bands.35 Therefore, a chemosensor that meets these requirements would be pretty meaningful.
Dicyanoisophorone (DCI) derivatives have shown unique optoelectronic properties and promising applications in fluorescence analyses.36 They are extremely suitable for developing the aforesaid chemosensor. As fluorophore scaffolds for sensing applications, DCI-based donor–π–acceptor (D–π–A) dyes have some advantageous features including tunable structures, large Stokes shifts, and a long emission wavelength window.37 The optical properties of DCI-based D–π–A dyes depend on the strength of the donor and acceptor groups.38 Even more, both S and O on Rhodanine-3-acetic acid (RDA) have lone electron pairs, which are easily contributed to coordinate with metal ions. RDA is chosen as a recognition unit for the detection of metal ions.39
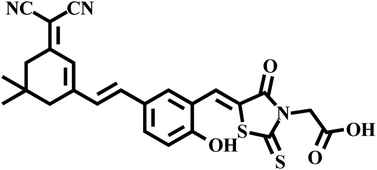
Hence, a new dual-functional fluorescent sensor DCI-RDA was constructed for the simultaneous sensing of Fe3+ and Hg2+ by using a DCI-based push–pull dye as the fluorophore and RDA as the recognition moiety (Fig. 1). The probe showed long wavelength emission, excellent selectivity and sensitivity toward Fe3+/Hg2+. Furthermore, the probe with low cytotoxicity has been successfully applied to fluorescent imaging to detect Fe3+/Hg2+ in living cells. The details of the research are carefully discussed below.
2. Results and discussion
2.1. Synthesis and characterization
The synthetic pathways are shown in Scheme S1.† Synthetic procedures involving air-sensitive reagents were performed under an argon atmosphere. The intermediate M1, M2 and M3 were synthesized according to a previously reported method.40 All compounds were purified in the silica column. Characterizations including 1H NMR, 13C NMR, and HRMS spectroscopy techniques were performed to confirm the chemical structure of DCI-RDA. All the protons and carbon atoms (Fig. S1 and S2†) were unambiguously assigned.2.2. Selectivity and specificity of the sensor DCI-RDA towards Hg2+/Fe3+ ions
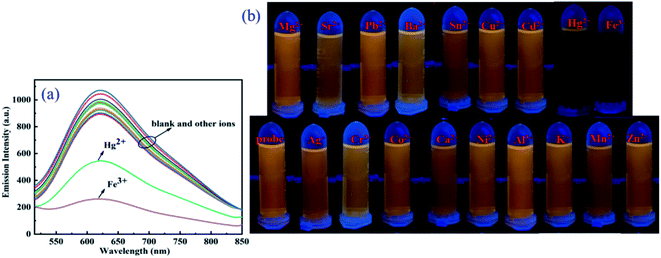
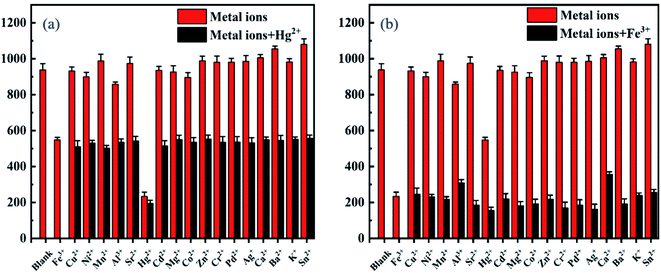
The fluorescence experiments were first performed to test the selectivity of probe DCI-RDA (20 μM) for Hg2+/Fe3+, with various competitive metal ions including Ni2+, Mn2+, Al3+, Sr2+, Hg2+, Cd2+, Mg2+, Zn2+, Co2+, Cr3+, Pb2+, Fe3+, Ag+, Ca2+, Ba2+, K+, Sn2+, and Cu2+ (280 μM) in ethanol solution, respectively. As displayed in Fig. 2a, the addition of Fe3+ or Hg2+ to the solution of sensor DCI-RDA resulted in a strong fluorescence quenching effect with the excitation wavelength of 460 nm, particularly Fe3+. However, the other metal ions displayed no obvious changes in the fluorescence intensity. The fluorescence photographs shown in Fig. 2b also demonstrated that only Fe3+ and Hg2+ can cause a significant fluorescence quenching phenomenon. This effect can be ascribed to the formation of a coordinate complex between Fe3+/Hg2+ and the O/S atoms of the DCI-RDA sensor, while other metal ions failed to coordinate with the DCI-RDA sensor because of their unsuitable ionic radii, different configurations of extra-nuclear electron and insufficient binding capacity.In order to examine the specificity of the probe DCI-RDA towards Hg2+/Fe3+ ions, competition experiments were conducted with the addition of relevant analytes Ni2+, Mn2+, Al3+, Sr2+, Cd2+, Mg2+, Zn2+, Co2+, Cr3+, Pb2+, Ag+, Ca2+, Ba2+, K+, Sn2+, and Cu2+ (280 μM) to the probe solution (20 μM) in the presence of Hg2+/Fe3+ ions. As depicted in Fig. 3, the fluorescence intensity of the DCI-RDA sensor reduced by 70% after the addition of Fe3+ and reduced by 45% after the addition of Hg2+, whereas the competitive metal ions showed almost negligible interference to the fluorescence intensity of DCI-RDA. The above-mentioned results clearly indicated that the presence of competitive metal ions show little effect on the specific detection of Hg2+/Fe3+.
2.3. Determination of Hg2+ and Fe3+
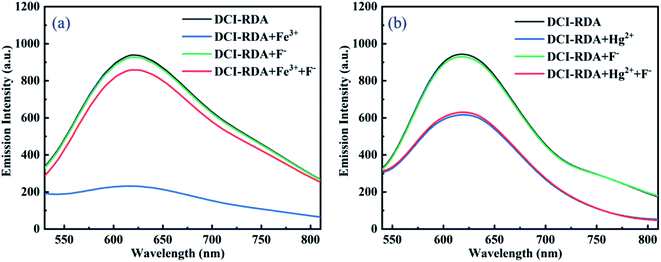
In case of the coexistence of Hg2+ and Fe3+, the current detection conditions cannot distinguish Fe3+ from Hg2+. It is more meaningful to distinguish Fe3+ from Hg2+ when both of them coexist in the solution. Through a series of experiments, we found that F− can be used to distinguish Fe3+ from Hg2+. As shown in Fig. 4a, the fluorescence intensity of the DCI-RDA solution is quenched with the addition of Fe3+, but it would restore close to the original intensity of the free sensor DCI-RDA after the addition of F−. In addition, the addition of F− to the free probe DCI-RDA solutions has no influence on the fluorescence intensity. Nevertheless, there is no change in the fluorescence intensity of DCI-RDA-Hg2+ solutions with the addition of F− (Fig. 4b). This is because the added F− reacts with the Fe3+ of the Fe3+-DCI-RDA complex and releases the sensor DCI-RDA, which indicates that the binding affinity between Fe3+ and F− is more powerful than that of Fe3+ and sensor DCI-RDA. However, F− failed to compete with DCI-RDA for Hg2+ because F− is not a good chelating ligand of Hg2+. Therefore, the sensor can be used for the separate detection of Hg2+ and Fe3+ with the addition of F− when Hg2+ and Fe3+ coexist in the sample.2.4. Sensitivity of the sensor DCI-RDA towards Hg2+/Fe3+ ions
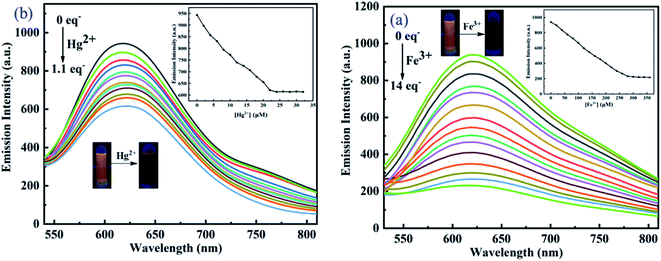
To demonstrate the sensitivity of the sensor DCI-RDA towards Hg2+ and Fe3+ ions, fluorescence titration experiments were carried out with various concentrations of Fe3+ and Hg2+ in ethanol solution. As shown in Fig. 5, the fluorescence titration was carried out with Hg2+ (0–1.1 equiv.) and Fe3+ (0–14 equiv.) addition and showed a subsequent gradual weakening in the fluorescence intensity with the increase in the ion concentration. Hg2+ and Fe3+ could lead to the stable weakening of the fluorescence intensity, and a plateau was formed upon the addition of 22 μM and 280 μM, respectively. It is also observed that the fluorescence color changed from yellow to faint yellow (Fig. 5a inset). The above-mentioned phenomenon showed that the probe DCI-RDA provided a fluorescence quenched behavior for the selective detection of Hg2+ and Fe3+. Importantly, a linear relationship between fluorescence intensity and Hg2+ concentrations is obtained with R2 = 0.992 in the range of 0–22 μM (Fig. S3A†). The limit of detection (LOD) of the sensor DCI-RDA was calculated to be 0.305 μM for Hg2+ from the respective calibration curve based on the formula shown in Calculation S3.1 (see ESI S3.1†). Also, there is a linear relationship between the fluorescence intensity and Fe3+ concentrations from 0 to 225 μM with R2 = 0.998 (Fig. S3B†). The LOD of Fe3+ was calculated to be 1.468 μM, which is lower than the limit of Fe3+ in drinking water (5.357 μM) set by U.S. Environmental Protection Agency.10 These results indicate that the fluorescent probe has potential application in the detection of Hg2+ and Fe3+. On the other hand, the binding constant of the DCI-RDA sensor with Hg2+ and Fe3+ were determined to be 4.095 × 10⁴ M−1 and 3.297 × 10³ M−1, respectively, from the corresponding slope of the linear (Fig. S4†) following the formula shown in S3.2 (see ESI S3.2†).The advantage of quick response of the probe is very important for practical applications. Therefore, the response time of DCI-RDA to Fe3+ and Hg2+ was also detected. At first, the fluorescence intensity of DCI-RDA (20 μM) was extremely strong and constant. However, after adding Fe3+ (280 μM) or Hg2+ (22 μM) in the DCI-RDA solution, DCI-RDA could quickly respond to Fe3+/Hg2+. The fluorescence intensity decreased dramatically and reached fluorescence quenching within 30 s (Fig. S5†), which means that the probe can be used for real-time detection.
2.5. The binding analysis
To better understand the binding process, the stoichiometry of the DCI-RDA sensor and Hg2+/Fe3+ was investigated by the Job's plot analysis based on the fluorescence test (Fig. S6†). From the results, we can clearly see a turning point at 0.5 M fraction of Hg2+/Fe3+ ions, indicating a stoichiometric ratio of 1![[thin space (1/6-em)]](https://www.rsc.org/images/entities/char_2009.gif) :
:![[thin space (1/6-em)]](https://www.rsc.org/images/entities/char_2009.gif) 1 for both DCI-RDA-Hg2+ and DCI-RDA-Fe3+ complexes. Thus, it is predicted that there was only one binding site in the DCI-RD sensor A for both Hg2+ and Fe3+.
1 for both DCI-RDA-Hg2+ and DCI-RDA-Fe3+ complexes. Thus, it is predicted that there was only one binding site in the DCI-RD sensor A for both Hg2+ and Fe3+.
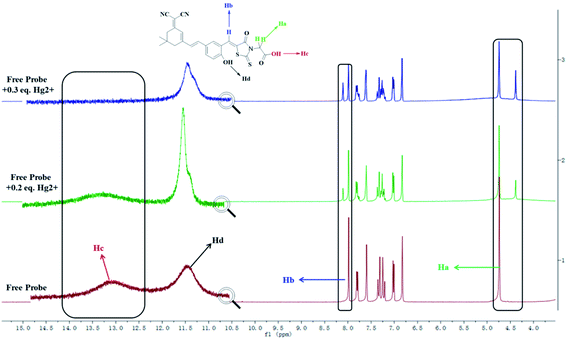
In addition, 1H NMR titration experiments were carried out in DMSO-d6 to clarify the binding interactions between the DCI-RDA sensor and Hg2+. As shown in Fig. 6, DCI-RDA shows two characteristic peaks at δ 4.74 ppm (Ha) and δ 7.98 ppm (Hb), which are assigned to the methylene proton of acetic acid and attached to C![[double bond, length as m-dash]](https://www.rsc.org/images/entities/char_e001.gif) C, respectively. The proton signals of Ha and Hb had a more apparent change with the new peak appearing at δ 4.38 ppm and δ 8.10 ppm, and became gradually intensified with 0.3 equiv. Hg2+ addition due to their location in the vicinity of the Hg2+ binding site. On the other hand, the proton signals of Hc, which is assigned to the carboxyl proton of acetic acid slowly weakened and disappeared with 0.3 equiv. Hg2+ addition. Nevertheless, the proton signals of Hd, which is assigned to Ph-OH, showed no change, except the change in the peak shape (Table S1†). These results indicated that S1 and O1 acted as electron donors for coordination to Hg2+. Unfortunately, it is difficult to carry out the 1H NMR titration experiments for DCI-RDA toward Fe3+ due to the paramagnetic property of Fe3+.
C, respectively. The proton signals of Ha and Hb had a more apparent change with the new peak appearing at δ 4.38 ppm and δ 8.10 ppm, and became gradually intensified with 0.3 equiv. Hg2+ addition due to their location in the vicinity of the Hg2+ binding site. On the other hand, the proton signals of Hc, which is assigned to the carboxyl proton of acetic acid slowly weakened and disappeared with 0.3 equiv. Hg2+ addition. Nevertheless, the proton signals of Hd, which is assigned to Ph-OH, showed no change, except the change in the peak shape (Table S1†). These results indicated that S1 and O1 acted as electron donors for coordination to Hg2+. Unfortunately, it is difficult to carry out the 1H NMR titration experiments for DCI-RDA toward Fe3+ due to the paramagnetic property of Fe3+.
2.6. Theoretic calculations
To further demonstrate the sensing mechanism of the DCI-RDA sensor toward Hg2+ and Fe3+ ions, density functional theory (DFT) calculations were carried out to provide reasonable theoretical explanations on the coordinate interaction. All calculations were carried out using the Gaussian 09 software.41 The geometry of all studied structures were calculated in the gas phase by using the wB97XD level since this function contains the dispersion interaction term and is more appropriate for calculating the optimized structures of compounds and the non-covalent interactions between compounds,42 together with vibrational frequency calculation at the same level of theory to ensure that all optimized structures are true energy minima without imaginary frequency. The C, H, O and N atoms were described by the 6-31G(d,p) basis set, and the LANL2DZ43,44 was employed for the Fe and Hg atoms with effective core potentials (ECPs) for its core electrons. As shown in Fig. 7, the molecular structure of the DCI-RDA sensor suffers changes after interacting with Hg2+and Fe3+. The oxygen atom (O1) of COOH and sulfur atom (S1) of C![[double bond, length as m-dash]](https://www.rsc.org/images/entities/char_e001.gif) S in the DCI-RDA sensor coordinated with Hg2+/Fe3+ ions to form DCI-RDA-Hg2+ and DCI-RDA-Fe3+ complexes. The complexes revealed a 1
S in the DCI-RDA sensor coordinated with Hg2+/Fe3+ ions to form DCI-RDA-Hg2+ and DCI-RDA-Fe3+ complexes. The complexes revealed a 1![[thin space (1/6-em)]](https://www.rsc.org/images/entities/char_2009.gif) :
:![[thin space (1/6-em)]](https://www.rsc.org/images/entities/char_2009.gif) 1 stoichiometric ratio for the sensor and Hg2+/Fe3+, which is in conformity with the results obtained from the Job's plots analysis and 1H NMR titration experiments. From the geometry of the sensor DCI-RDA-Hg2+ complex, we can clearly see the bond length of Hg–O1 and Hg–S1 is 2.1424 Å and 2.5516 Å, respectively, indicating that the coordination between Hg2+ and O1 atom is stronger. Similar results can be obtained in the DCI-RDA-Fe3+ complex. Compared with the DCI-RDA-Hg2+ complex, the interaction between Fe3+ and the sensor is stronger due to the shorter bond length of Fe–O1 and Fe–S1.
1 stoichiometric ratio for the sensor and Hg2+/Fe3+, which is in conformity with the results obtained from the Job's plots analysis and 1H NMR titration experiments. From the geometry of the sensor DCI-RDA-Hg2+ complex, we can clearly see the bond length of Hg–O1 and Hg–S1 is 2.1424 Å and 2.5516 Å, respectively, indicating that the coordination between Hg2+ and O1 atom is stronger. Similar results can be obtained in the DCI-RDA-Fe3+ complex. Compared with the DCI-RDA-Hg2+ complex, the interaction between Fe3+ and the sensor is stronger due to the shorter bond length of Fe–O1 and Fe–S1.
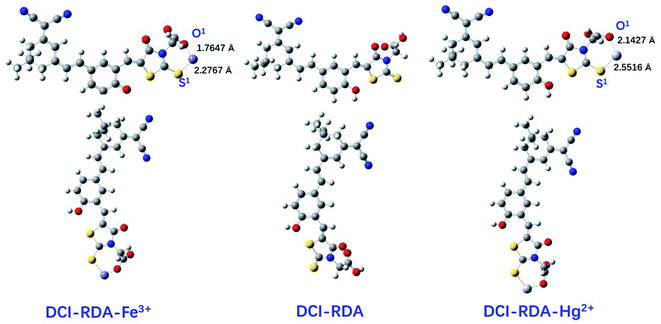 | ||
| Fig. 7 The optimized geometric structures based on wB97XD and PCM salvation model for DCI-RDA and DCI-RDA-Hg2+/Fe3+ in the gas phase. Here, both top views and side views are shown. | ||
The orbital energy levels of probe DCI-RDA and DCI-RDA-Fe3+/Hg2+, including LUMO and HOMO energy levels, are shown in Fig. S7.† On the LUMO and HOMO of the DCI-RDA probe, the electron density was mainly distributed on the DCI and benzene ring part. However, after Hg2+ coordinated with the O1 atom and S1 atom of DCI-RDA, on the HOMO of DCI-RDA-Hg2+ complex, the electron density was still focused on the DCI and benzene ring part, while the distribution of LUMO in the DCI-RDA-Hg2+ complex was changed to the RDA moiety. Completely opposing results were obtained in the DCI-RDA-Fe3+ complex, that is, the HOMO of the DCI-RDA-Fe3+ complex was focused on the RDA moiety, while the distribution of LUMO was changed to the DCI and benzene ring part. The above phenomenon indicated a clear ICT in both DCI-RDA-Hg2+ and DCI-RDA-Fe3+ complexes.
Furthermore, the HOMO and LUMO energy gap of DCI-RDA was calculated to be 6.65 eV, while it was 5.61 eV for DCI-RDA-Hg2+ and 3.79 eV for DCI-RDA-Fe3+. After the combination of DCI-RDA and Hg2+/Fe3+, the HOMO and LUMO bandgaps were reduced from 6.65 to 5.61 eV and 3.79 eV, respectively. The decrease in the calculated energy gap between HOMO and LUMO, after DCI-RDA adducting with Hg2+/Fe3+, indicated the strong binding of Hg2+/Fe3+ to the probe. These calculated results further support our experimental observation based on spectrophotometric experiments.
2.7. Fluorescence imaging for living cells and zebrafish
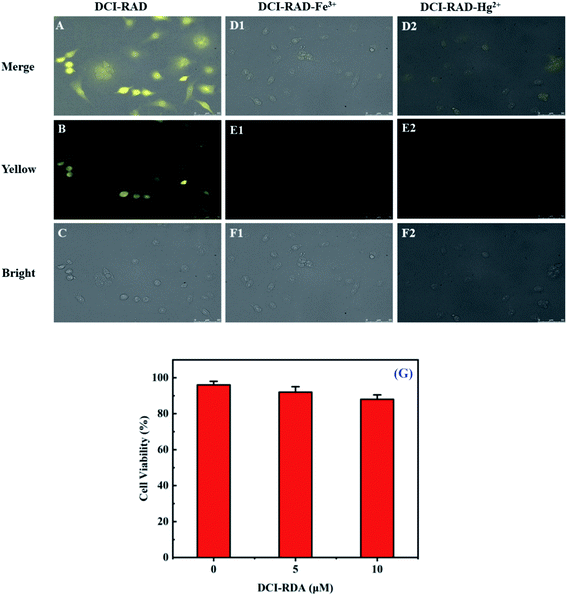
Herein, the practical application of the DCI-RDA sensor for the determination of Hg2+/Fe3+ in biological media in living cells was investigated using human HeLa cells. First, the cell cytotoxicity of the DCI-RDA sensor against HeLa cells was studied by the MTT assay.45 The result revealed that the free sensor DCI-RDA has negligible toxicity on HeLa cells and more than 88% survival after 24 h (Fig. 8G), indicating that the DCI-RDA sensor has low cytotoxicity and great biocompatibility in biological systems.Furthermore, the cell imaging of the DCI-RDA sensor in HeLa cells was studied (Fig. 8), a bright fluorescence signal (Fig. 8B) was observed after the incubation of HeLa cells with the DCI-RDA sensor (10 μM) for 30 min. Due to the large Stokes shift (162 nm) of the DCI-RDA sensor, it can effectually reduce interferences resulting from self-absorption. Amazingly, very low dim fluorescence (Fig. 8E1 and E2) in the intracellular region can be observed, followed by the treatment with Hg2+/Fe3+ (100 μM) incubating for another 30 min. This phenomenon confirmed that the probe DCI-RDA could penetrate into the cells and can be used to track Hg2+/Fe3+ in living cells by fluorescent imaging.
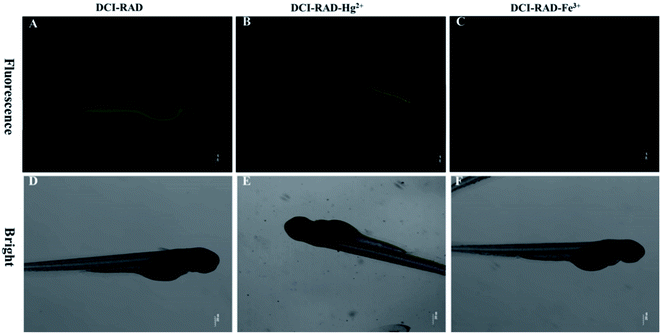
To demonstrate the further applications of probe DCI-RDA in living organisms, fluorescence imaging was carried out in zebrafish, which have optical transparency and similar genetic properties to humans. As shown in Fig. 9, when the zebrafish was cultivated with DCI-RDA for 1 h, the strong yellow fluorescence in the digestive system of the zebrafish larvae is clearly visible (Fig. 9A). However, in the presence of Hg2+, yellow fluorescent evidently weakened (Fig. 9B) after washing three times in the surface of zebrafish with PBS buffer. Nevertheless, in the presence of Fe3+, the yellow fluorescent basically disappeared (Fig. 9C). These results clearly indicate that DCI-RDA is organism-permeable and is significantly sensitive for detecting Hg2+ and Fe3+ in the living body.
3. Conclusions
In summary, a new dual-functional fluorescent sensor DCI-RDA was constructed for the simultaneous sensing of Fe3+ and Hg2+, by using a DCI-based push–pull dye as the fluorophore and RDA as the recognition moiety. The favorable attributes of the probe DCI-RDA include a remarkably large Stokes shift (162 nm), rapid response, high selectivity and sensitivity, and effective detection of Hg2+/Fe3+. The detection limits for Fe3+ and Hg2+ ions were 1.468 μM and 0.305 μM, respectively. The LOD of Fe3+ is lower than the limit of Fe3+ in drinking water (5.357 μM) set by U.S. Environmental Protection Agency, and the LOD of Hg2+ is lower compared with the reported work (Table S2†). Furthermore, the stoichiometry of the complexes between DCI-RDA and Hg2+/Fe3+ was determined by the Job's method and 1H NMR titration experiments and found to have a 1![[thin space (1/6-em)]](https://www.rsc.org/images/entities/char_2009.gif) :
:![[thin space (1/6-em)]](https://www.rsc.org/images/entities/char_2009.gif) 1 ratio. DFT studies were carried out to verify the experimental data. Importantly, DCI-RDA exhibited low cytotoxicity against HeLa cells by the MTT assay. The fluorescence imaging in HeLa cells and zebrafish showed that DCI-RDA could be used as an efficient intracellular probe for the detection of Fe3+ and Hg2+. These results indicated that DCI-RDA can be utilized as a selective, sensitive and safe probe for the sensing of Fe3+ and Hg2+ ions in living systems.
1 ratio. DFT studies were carried out to verify the experimental data. Importantly, DCI-RDA exhibited low cytotoxicity against HeLa cells by the MTT assay. The fluorescence imaging in HeLa cells and zebrafish showed that DCI-RDA could be used as an efficient intracellular probe for the detection of Fe3+ and Hg2+. These results indicated that DCI-RDA can be utilized as a selective, sensitive and safe probe for the sensing of Fe3+ and Hg2+ ions in living systems.
Conflicts of interest
There are no conflicts to declare.Acknowledgements
This work was financially supported by the National Natural Science Foundation of China (21867011); Doctor start foundation project of Jiangxi Normal University of Science and Technology (2019BSQD003); The Jiangxi Normal University of Science and Technology youth talent program (2020QNBJRC003); Innovation and entrepreneurship of college students (202011318014).Notes and references
- S. O. Tümay, J. Lumin., 2021, 231, 117813 CrossRef.
- X. Y. Meng, L. You, S. Y. Li, Q. Sun, X. G. Luo, H. F. He, J. L. Wang and F. Zhao, RSC Adv., 2020, 10, 37735 RSC.
- S. O. Tümay, M. H. Irani-Nezhad and A. Khataee, Spectrochim. Acta, Part A, 2021, 248, 119250 CrossRef PubMed.
- A. Uslu, E. Özcan, S. O. Tümay, H. H. Kazan and S. Yeşilot, J. Photochem. Photobiol., A, 2020, 392, 112411 CrossRef CAS.
- L. Wang, Y. Q. Fan, X. W. Guan, W. J. Qu, Q. Lin, H. Yao, T. B. Wei and Y. M. Zhang, Tetrahedron, 2018, 74, 4005–4012 CrossRef CAS.
- Y. Li, H. T. Zhou, W. Chen, G. C. Sun, L. Sun and J. H. Su, Tetrahedron, 2016, 72, 5620–5625 CrossRef CAS.
- S. O. Tumay, V. Sanko, A. Senocak and E. Demirbas, New J. Chem., 2021, 45, 14495 RSC.
- W. Y. Lin, X. W. Cao, Y. D. Ding, L. Yuan and L. L. Long, Chem. Commun., 2010, 46, 3529–3531 RSC.
- H. Y. Qi, X. N. Sun, T. Jing, J. L. Li and J. Li, RSC Adv., 2022, 12, 1989 RSC.
- S. O. Tümay, M. H. Irani-nezhad and A. Khataee, Spectrochim. Acta, Part A, 2021, 261, 120017 CrossRef PubMed.
- J. Y. Cabon, P. Giamarchi and A. Le Bihan, Anal. Chim. Acta, 2010, 664, 114–120 CrossRef CAS PubMed.
- Y. Liu, J. Zou, B. Luo, H. Yu, Z. Zhao and H. Xia, Microchem. J., 2021, 169, 106547 CrossRef CAS.
- E. Bakkaus, R. N. Collins, J. L. Morel and B. Gouget, J. Chromatogr. A, 2006, 1129, 208–215 CrossRef CAS PubMed.
- P. Ugo, L. Moretto, A. De Boni, P. Scopece and G. Mazzocchin, Anal. Chim. Acta, 2002, 474, 147–160 CrossRef CAS.
- X. Bao, Q. Cao, X. Wu, H. Shu, B. Zhou, Y. Geng and J. Zhu, Tetrahedron Lett., 2016, 57, 942–948 CrossRef CAS.
- L. Zhang, Z. Tang, L. Hou, Y. Qu, Y. Deng, C. Zhang, C. Xie and Z. Wu, Analyst, 2020, 145, 1641–1645 RSC.
- M. Zhu, Z. Zhao, X. Liu, P. Chen, F. Fan, X. Wu, R. Hua and Y. Wang, J. Hazard. Mater., 2021, 406, 124767 CrossRef CAS PubMed.
- Y. Zhu, Q. Sun, J. Shi, H. Xia, J. Wang, H. Chen, H. He, L. Shen, F. Zhao and J. Zhong, J. Photochem. Photobiol., A, 2020, 389, 112244 CrossRef CAS.
- M. Saleem and K. H. Lee, RSC Adv., 2015, 5, 72150 RSC.
- M. C. Ŕıos, N. F. Bravo, C. C. Sanchez and J. Portilla, RSC Adv., 2021, 11, 34206 RSC.
- Z. Q. Yan, M. F. Yuen, L. Hu, P. Sun and C. S. Lee, RSC Adv., 2014, 4, 48373–48388 RSC.
- C. T. Shi, Z. Y. Huang, A. B. Wu, Y. X. Hu, N. C. Wang, Y. Zhang, W. M. Shu and W. C. Yu, RSC Adv., 2021, 11, 29632–29660 RSC.
- L. Huang, W. L. Sheng, L. Z. Wang, X. Meng, H. D. Duan and L. Q. Chi, RSC Adv., 2021, 11, 23597 RSC.
- W. Yao, Y. C. Hua, Z. H. Yan, C. X. Wu, F. Y. Zhou and Y. Liu, RSC Adv., 2021, 11, 36310 RSC.
- Z. Y. Yin, J. H. Hu, K. Gui, Q. Q. Fu, Y. Yao, F. L. Zhou, L. L. Ma and Z. P. Zhang, J. Photochem. Photobiol., A, 2020, 396, 112542 CrossRef CAS.
- Z. G. Gao, C. Kan, H. B. Liu, J. Zhu and X. F. Bao, Tetrahedron, 2019, 75, 1223–1230 CrossRef CAS.
- S. Erdemir, O. Alici, D. Aydin and O. Kocyigit, J. Mol. Liq., 2021, 337, 116471 CrossRef CAS.
- B. X. Shen and Y. Qian, Sens. Actuators, B, 2018, 260, 666–675 CrossRef CAS.
- A. L. Li, Z. L. Wang, W. Y. Wang, Q. S. Liu, Y. Sun, S. F. Wang and W. Gu, Microchem. J., 2021, 160, 105682 CrossRef CAS.
- Z. E. Chen, X. F. Zang and H. Zhang, Spectrochim. Acta, Part A, 2021, 260, 119955 CrossRef CAS PubMed.
- T. Savran, S. N. K. Elmas, D. A. S. Arslan, F. N. Arslan and I. Yilmaz, Res. Chem. Intermed., 2022, 48, 1003 CrossRef CAS.
- S. N. K. Elmas, Z. E. Dincer, A. S. Erturk, A. Bostanci, A. Karagoz, M. Koca, G. Sadi and I. Yilmaz, Spectrochim. Acta, Part A, 2020, 224, 117402 CrossRef PubMed.
- S. Chen, P. Hou, B. Zhou, X. Song, J. Wu, H. Zhang and J. W. Foley, RSC Adv., 2013, 3, 11543–11546 RSC.
- L. Yuan, W. Lin, K. Zheng, L. He and W. Huang, Chem. Soc. Rev., 2013, 42, 622–661 RSC.
- X. Wei, M. Hao, X. X. Hu, Z. Song, Y. Wang, R. Sun, J. Zhang, M. Yan, B. Ding and J. Yu, Sens. Actuators, B, 2021, 326, 128849 CrossRef CAS.
- Z. Gao, X. Zhang, M. Zheng and Y. Chen, Dyes Pigm., 2015, 120, 37–43 CrossRef CAS.
- Y. Zhang, Y. Hao, X. Ma, S. Chen and M. Xu, Environ. Pollut., 2020, 265, 114958 CrossRef CAS PubMed.
- M. M. Jadhav, D. Patil and N. Sekar, J. Photochem. Photobiol., A, 2018, 363, 13–22 CrossRef CAS.
- X. Meng, J. Wang, X. Li, Q. Sun, Q. Tu, X. Liu, H. He and F. Zhao, Microchem. J., 2021, 169, 106551 CrossRef CAS.
- M. Qian, L. Zhang, Z. Pu, J. Xia, L. Chen, Y. Xia, H. Cui, J. Wang and X. Peng, J. Mater. Chem. B., 2018, 6, 7916–7925 RSC.
- M. J. Frisch, G. W. Trucks, H. B. Schlegel, G. E. Scuseria, M. A. Robb, J. R. Cheeseman, et al., Gaussian 09, revision A. 01, Gaussian, Inc., Wallingford, CT, 2009 Search PubMed.
- https://gaussian.com/dft/.
- W. R. Wadt and P. J. Hay, J. Chem. Phys., 1985, 82, 284–298 CrossRef CAS.
- T. Dunning Jr, P. Hay, P. J. Hay and W. R. Wadt, J. Chem. Phys., 1985, 82, 299–310 CrossRef.
- C. Huang, J. Qu, J. Qi, M. Yan and G. Xu, Org. Lett., 2011, 13, 1462–1465 CrossRef CAS PubMed.
Footnote |
| † Electronic supplementary information (ESI) available. See https://doi.org/10.1039/d2ra01357f |
| This journal is © The Royal Society of Chemistry 2022 |

