 Open Access Article
A curcumin-based AIEE-active fluorescent probe for Cu2+ detection in aqueous solution†
Yang Lin,
Ao Yu,
Jinjing Wang,
Derui Kong,
Hongtao Liu*,
Jianwei Li * and
Chunman Jia
 *
*
Hainan Provincial Key Lab of Fine Chem, School of Chemical Engineering and Technology, Hainan University, Haikou 570228, China. E-mail: jiachunman@hainanu.edu.cn; jianwei.li@utu.fi; liuhongtao@hainanu.edu.cn
First published on 7th June 2022
Abstract
Curcuminoids have been extensively investigated as metal ion probes, but the intrinsic aggregation-caused-quenching (ACQ) characteristic of curcumin would hinder their applications in aqueous solution. Fortunately, tetraphenylethylene (TPE) could endow the compounds with aggregation-induced emission (AIE)/aggregation-induced enhanced emission (AIEE) characteristics to eliminate the ACQ effect. According to this strategy, a series of TPE-modified curcumin derivatives L1–4 were prepared and studied for their AIEE properties. Among the four TPE-curcumin analogues, only L1 particles have been successfully used as an on-off fluorescence probe for detecting Cu2+ in aqueous solution. The fluorescence titration experiment determined its detection limit of 1.49 × 10⁻⁷ mol L−1, and the binding ratio between L1 and Cu2+ was estimated as 2![[thin space (1/6-em)]](https://www.rsc.org/images/entities/char_2009.gif) :
:![[thin space (1/6-em)]](https://www.rsc.org/images/entities/char_2009.gif) 1, which was in agreement with the results of high resolution mass spectrum and Job's plot. In addition, the binding constant was evaluated as 6.77 × 10² M−1 using a Benesi–Hildebrand plot. Finally, the obtained L1-based indicator paper showed significant fluorescence response to Cu2+ aqueous solution. This TPE-modified strategy improves the detection capability of curcumin probe in aqueous solution and provides a feasible way to obtain other probes with ACQ characteristics.
1, which was in agreement with the results of high resolution mass spectrum and Job's plot. In addition, the binding constant was evaluated as 6.77 × 10² M−1 using a Benesi–Hildebrand plot. Finally, the obtained L1-based indicator paper showed significant fluorescence response to Cu2+ aqueous solution. This TPE-modified strategy improves the detection capability of curcumin probe in aqueous solution and provides a feasible way to obtain other probes with ACQ characteristics.
1 Introduction
Curcumin is a natural yellow pigment extracted from the dried rhizomes of turmeric, which has low cytotoxicity, high photostability, and large two-photon absorption cross section.1 In recent years, some curcumin-like fluorescent probes have been prepared and used to detect soluble/insoluble amyloids,2 intracranial reactive oxygen species,3 cysteine,4 cancer cells,5 and so on. From the point of view of its structure, the α,β-unsaturated β-diketone moiety can coordinate with a variety of metal ions, and many curcumin–metal complexes have been adopted as therapeutic agents for cancer, arthritis, osteoporosis, neurological disorders, and others.6 Therefore, curcumin has great potential as a metal ion probe. However, curcumin and its derivatives usually have poor water-solubility, and their photophysical properties are strongly influenced by solvent, water, and pH. For example, Ali et al. have revealed that water could quench the fluorescence of curcumin in acetone by forming non-fluorescent stable charge-transfer complexes.7 Bong has reported that the increased concentration of water could decrease the fluorescence intensity of curcumin.8 This may be attributed to the non-radiative decay resulting from π–π stacking in the aggregation state, which is often named the aggregation-caused quenching (ACQ) effect. In order to overcome this problem, Patil and coworkers prepared J-aggregated curcumin nanoparticles (CURNPs) by the reprecipitation method with the surfactant Tween-80 in aqueous solution, which could retain the fluorescence properties of the curcumin monomer due to the separated molecule and no aggregation by lateral π-bonds.9 The CURNPs had an on-off fluorescence response for Cu2+ with a low detection limit. However, it is essential to resolve this problem intrinsically by optimizing the molecular structure.Encouragingly, two novel photoluminescence (PL) processes, namely aggregation-induced emission (AIE) and aggregation-induced emission enhancement (AIEE), can alleviate the ACQ effect by modifying the molecular structure with AIE/AIEE-gens.10–12 The AIE/AIEE molecules usually have negligible/low-intensity fluorescence in good solvents but enhanced emission intensity in nano aggregated states. To date, there have been prepared many varieties of AIE/AIEE-based nanoparticles as fluorescent probes for biological imaging and chemical sensing in water or high water content environments.13–16 These probes exhibit bright emission with high fluorescent quantum yields in aggregated states. As one of the typical AIEgens, the highly twisted tetraphenylethylene (TPE) will limit the non-radiative energy transfer by hampering the intermolecular π–π stacking in aggregated states. Therefore, the TPE-based fluorescent probes have outstanding fluorescent response and recognition capability in aqueous solutions.17–19
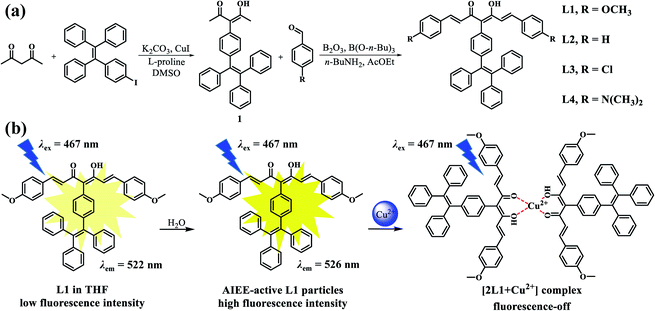
Inspired by the above, herein we tried to synthesize AIE/AIEE-active curcumin derivatives by introducing the TPE-moiety. As shown in Scheme 1, four TPE-curcumin analogues are prepared by using different substituents on the curcumin moieties, namely TPE-C-OMe (L1), TPE-C-H (L2), TPE-C-Cl (L3), and TPE-C-N(Me)2 (L4). According to the experimental results, L1–3 all possess notable AIEE properties in the THF/water mixtures with different water fractions (fws), but only L1 has the potential to be a fluorescent probe for Cu2+ detection. In addition, L1 particles were prepared by using a simple reprecipitation method without any surfactant and displayed high Cu2+ fluorescent response with good anti-interference capability, low detection limit, and fast response time. Finally, we adopted L1 to prepare a fluorescent indicator paper and verified its application potential for the rapid and effective detection of Cu2+ in water.
2 Experimental
2.1 Materials and instruments
All reagents were purchased from commercial sources and used without further purification unless otherwise stated. All experimental water used was deionized water.1H and 13C NMR spectra were recorded on a Bruker AV 400 NMR spectrometer (Bruker, Switzerland) by using deuterated chloroform as solvent and tetramethylsilane as internal standard. High resolution mass spectrometry (HRMS) were obtained on a LCMS-IT-TOF high resolution mass spectrometer (Shimadzu, Japan). Fluorescence spectra were recorded on a HORIBA Fluorolog-3 high-sensitivity fluorescence spectrometer (HORIBA, Japan). Single crystal X-ray diffraction data were performed on a Bruker APEX-II CCD diffractometer. During the data collection process, the crystals was kept at 150 K.
2.2 Synthesises of the compounds
2.3 Preparation of stock solution
L1–4 were dissolved in THF to prepare a stock solution with a concentration of 1.0 mmol L−1, respectively. Various metal ion and anion compounds were dissolved in deionized water to prepare a stock solution with a concentration of 10.0 mmol L−1 respectively, including KCl, NaCl, MgSO4, MnSO4, ZnCl2, CaCl2, FeCl2, FeCl3·6H2O, CoSO4, CuCl2·2H2O, Pb(CH3COO)2·2H2O, AgNO3, Al(NO3)3·9H2O, Ni(CH3COO)2, Pb(CH3COO)2·2H2O, NaF, Na2CO3, Na2S, Na2SO3, NaHSO3, NaCl, Na2SO4, NaNO3, NaNO2, and NaBr.2.4 Determination of the binding constant
The binding constant (KB) was evaluated using modified Benesi–Hildebrand equation given below.9where Imax is the maximum fluorescence intensity of L1 in presence of Cu2+, and I0 and I in absence and in the presence of Cu2+ ion solution respectively. [Cu2+] represents the concentration of Cu2+, and “n” is the number of Cu2+ bound per [2L1+Cu2+] complex. For Cu2+, “n” is taken 0.5. The double-reciprocal plot of 1/(I − I0) against 1/[Cu2+]0.5 shown in Fig. S23.†
2.5 Determination of the detection limit
Based on the fluorescence titration experiment, the detection limit (DL) was determined by calculation.21 Under constant conditions, the fluorescence intensity of 10 groups of fluorescent probe L1 (1.00 × 10⁻⁵ mol L−1) without the addition of Cu2+ at a wavelength of 525 nm was tested as a blank experiment and the standard deviation (SD) was calculated. Then, using the results of fluorescence titration experiment, the fluorescence intensity of probe L1 after adding different concentrations of Cu2+ was plotted as the vertical coordinate and the concentration of Cu2+ was plotted as the horizontal coordinate, and the linear equation y = kx + b was plotted by taking the point with better linearity, and finally, according to the formula: DL = 3SD/k, from which the DL of fluorescent probe L1 for Cu2+ could be calculated.2.6 Parameters of fluorescence test
All samples were tested after dripping the stock solution into the solvent for one minute. The slit width of L2 and L3 was 1.2/1.2 nm when measured both fluorescence spectra in different water/THF solutions (Fig. 3), and the slit width of other tests was 2.5/2.5 nm. All fluorescence intensities are expressed by dividing the original data by 10![[thin space (1/6-em)]](https://www.rsc.org/images/entities/char_2009.gif) 000. The recognition capability (Fig. 4b) and anti-interference capability (Fig. 5) of L1 were tested for four times, and the standard deviation was calculated according to four sets of experiments.
000. The recognition capability (Fig. 4b) and anti-interference capability (Fig. 5) of L1 were tested for four times, and the standard deviation was calculated according to four sets of experiments.
3 Results and discussion
3.1 Synthesis and structural characterization
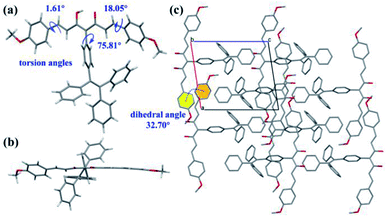
As shown as in Fig. 1a, the intermediate 1 was synthesized by the CuI-catalyzed coupling reaction of 1-iodo-4-(1,2,2-triphenylethenyl)benzene and acetylacetone, and then the Adol reaction took place between intermediate 1 and benzaldehyde analogues with different para-substituents to obtain L1–4. All compounds were characterized by 1H NMR, 13C NMR, and HRMS. Detailed syntheses and characterizations are presented in Scheme 1a and Fig. S1–S16 in the ESI.† Furthermore, the single crystal of L1 was successfully obtained by slow evaporation in the mixed solvent system (dichloromethane/methanol). According to the results of single crystal X-ray diffraction, the L1 crystal is triclinic crystal system with P![[1 with combining macron]](https://www.rsc.org/images/entities/char_0031_0304.gif) space group (Table S1, CCDC 2167438).† Compared with the curcumin analogue without TPE moiety,22 L1 has a large torsion angle of 75.81° between the curcumin skeleton and the TPE moiety (Fig. 1a and b). As shown as in Fig. 1c, there is no effective π–π stacking in the extended-crystal structure of L1, which may be attributed to the twist molecular structure of TPE, and two phenyls of adjacent L1 molecules possess a dihedral angle of 32.70°. In addition, two adjacent parallel L1 molecules in b-axis direction exhibit large stacking distances of 12.0 Å and 12.9 Å which are measured according to phenyls of curcumin skeleton (Fig. S17b and c).† As a result, the introduction of TPE in L1 hinders the π–π stacking of phenyl in curcumin, which is beneficial to eliminate the ACQ effect.
space group (Table S1, CCDC 2167438).† Compared with the curcumin analogue without TPE moiety,22 L1 has a large torsion angle of 75.81° between the curcumin skeleton and the TPE moiety (Fig. 1a and b). As shown as in Fig. 1c, there is no effective π–π stacking in the extended-crystal structure of L1, which may be attributed to the twist molecular structure of TPE, and two phenyls of adjacent L1 molecules possess a dihedral angle of 32.70°. In addition, two adjacent parallel L1 molecules in b-axis direction exhibit large stacking distances of 12.0 Å and 12.9 Å which are measured according to phenyls of curcumin skeleton (Fig. S17b and c).† As a result, the introduction of TPE in L1 hinders the π–π stacking of phenyl in curcumin, which is beneficial to eliminate the ACQ effect.
3.2 Photophysical properties
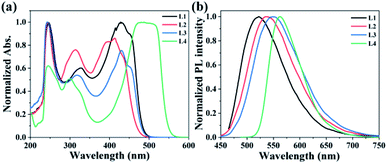
The UV-vis absorption and fluorescence spectra of L1–4 were measured in THF, and the detail optical data are shown in Table 1. As shown in Fig. 2a, L1–4 have respective three inherent absorption bands. According to the literature, TPE has strong absorption in the range of 200–400 nm,23 and curcumin has a max absorption peak of 390 nm in THF.24 The introduction of TPE has red-shifted the absorption peak of curcumin from 390 to 413 nm (L2), which may be attributed to the electron-donating capability and the large conjugated structure of TPE. Furthermore, the substituents of methyl, chlorine, and dimethylamino also can make the same absorption peak red-shift, including 428 nm (L1), 430 nm (L3), and 487 nm (L4). However, the fluorescence spectra of L1–4 in THF peaked at 522, 536, 548, and 562 nm, respectively. At the same time, the curcumin derivatives also showed large Stokes shift (Table 1), especially the shift values of L2 and L3 reached 123 and 118 nm, respectively, which could be attributed to their twist curcumin skeletons with greater photoinduced geometric changes.25,26| Probe | λabs (nm) | λex (nm) | λem (nm) | Stokes shift (nm) |
|---|---|---|---|---|
| L1 | 247, 327, 428 | 467 | 522 | 94 |
| L2 | 244, 314, 413 | 419 | 536 | 123 |
| L3 | 243, 318, 430 | 419 | 548 | 118 |
| L4 | 245, 300, 487 | 467 | 562 | 75 |
3.3 AIEE properties
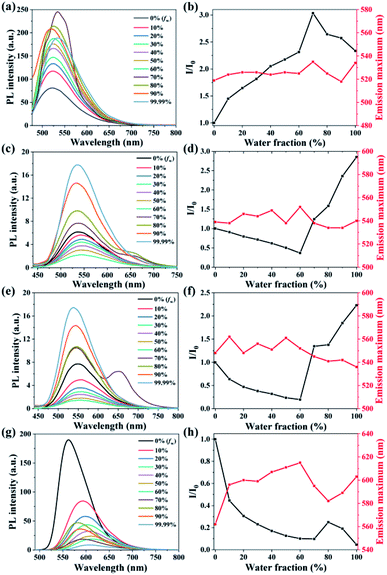
L1–4 have good solubilities in dichloromethane and THF but are insoluble in methanol and water. Since TPE is the classical AIEE-group, the AIEE properties of L1–4 were investigated by testing their fluorescence spectra in THF/water mixtures with different fws. As shown as in Fig. 3a, the fluorescence intensity of L1 is intensified with the fw and reaches a maximum value with a red-shifted maximum emission peak (≈12 nm) at a fw of 70%. This suggests that the aggregates of L1 was formed in the solution with the increased fw, which suppress the non-radiation energy loss. Thereafter, the higher fw (≥80%) maybe induce worse molecular stacking which reduce the emission intensity due to the decreased AIEE effect. On the contrary, L2 and L3 (Fig. 3c and d) both have a decreased fluorescence intensity by increasing the fw from 0% to 60%, which is attributed to the contribution of increased solvent polarity to twisted intramolecular charge transfer (TICT).27 When the fw increased from 60% to 99.99%, their emission intensity shows a sharp increase due to the AIEE effect. However, L4 exhibits the bathochromic-shifted emission peak and the decreased fluorescence intensity with the gradual addition of water aside from fw ≥ 80%. The stronger electron-donating capability of dimethylamine may increase the intramolecular charge transfer (ICT) which leading to the occurrence of fluorescence quenching.3.4 Selectivity study
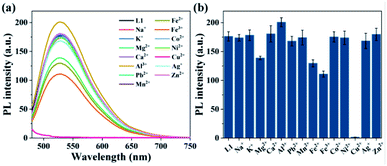
It has been reported that curcumin derivatives usually have good coordination capability with Cu2+.28 In the experimental process, only L1 has rapid fluorescence response to Cu2+ in L1–4. The fluorescence intensity of L1 in different THF/water mixtures was tested before and after adding one equivalent of Cu2+. According to the experimental results shown in Fig. S18,† the L1 solution (Vwater/VTHF = 4/1) with higher fluorescence intensity is highly sensitive to Cu2+, therefore the solution system (fw = 80%) was adopted in the following experiments. At the same time, the average aggregate size of L1 was determined to 342 nm by dynamic light scattering (DLS) experiment as shown in Fig. S19.† Moreover, L1 has a longer fluorescence lifetime (0.136 ns) in the THF/water solution (fw = 80%) than that (0.034 ns) in pristine THF, and the addition of Cu2+ significantly decrease the fluorescence lifetime to 0.030 ns. This illustrates that the formation of particles is favourable to enlarge the fluorescence lifetime of L1.In order to determine the recognition capability of L1 for various ions, the aqueous fluorescence spectra of L1 were measured in the presence of one equivalent of different metal ions, including Na+, K+, Mg2+, Ca2+, Al3+, Pb2+, Mn2+, Fe2+, Fe3+, Co2+, Ni2+, Cu2+, Ag+, and Zn2+. As seen from Fig. 4, when adding one equivalent of metal cation into the L1 aqueous solution (1 × 10⁻⁵ mol L−1), a fluorescence quenching phenomenon with a quenching efficiency of 99% is only observed after the addition of Cu2+, and other metal cations cause a slight decreased emission intensity but Al3+ marginally intensify the emission intensity about 14%. The electron-donating capability of methoxy enhances the binding ability of β-dicarbonyl in L1 with metal ions through the conjugated effect, and the paramagnetic Cu2+ with underfilling 3d orbit combined with L1 makes the energy or electron of fluorophore transfer, which leading to quenched fluorescence.29 However, the substituents H and Cl have no effect on the combination between β-dicarbonyl and Cu2+, and L4 has no obvious phenomenon in the reaction with Cu2+ due to its low fluorescence intensity in aqueous solution. Therefore, only L1 possesses both AIEE feature and good selectivity for Cu2+ and can be used as a Cu2+ fluorescent probe in aqueous solution.
3.5 Anti-interference studies
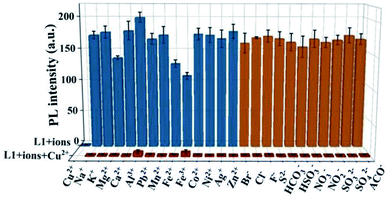
The anti-interference capability of probe L1 was tested by the competition experiments, which were carried out by adding one equivalent of Cu2+ into the L1 solutions with ten equivalents of different competing ions. The used ions included metal cations (Cu2+, Na+, K+, Mg2+, Ca2+, Al3+, Pb2+, Mn2+, Fe2+, Fe3+, Co2+, Ni2+, Ag+, Zn2+) and anions (Br−, Cl−, F−, S2−, HCO3−, HSO3−, NO3−, NO2−, SO32−, SO42−, AcO−). As shown in Fig. 5, the L1 solutions with different competing ions all exhibit significant fluorescences which are quenched after the addition of Cu2+. These results also demonstrate that L1-probe has excellent selectivity and specificity to Cu2+. Especially, compared with the existing curcumin-based Cu2+ fluorescent probe,9,22 L1 also shows outstanding anti-interference capability to S2−.3.6 Influence of pH on probe L1
Curcumin is usually stable in acidity and unstable in neutrality and alkalinity,30 it could degrade to produce vanillin, acetone, feruloylmethane, and ferulic acid in alkaline medium by hydrolytic splitting.29 Therefore, it is essential to examine the detection capability of L1 in response to Cu2+ at different pH. The solutions (Vwater/VTHF = 4/1) with pH values in the range of 2–13 were prepared by slowly adding a small amount of 1 M hydrochloric acid or sodium hydroxide solution with the detection of a pH meter. As shown in Fig. S20,† the fluorescence intensity of probe L1 remains stable at pH 2–10 and gradually decreases at pH 11–13. The decreased emission intensity could be attributed to the degraded molecular structure of L1. Then, the fluorescence intensity of L1 solution was quenched by adding Cu2+ at pH 5–11. As a result, the optimum pH-range is 5–10 for the application of probe L1.3.7 Fluorescence titration experiment
The fluorescence titration experiment was carried out to determine the quantitative relationship between probe L1 and Cu2+. As shown in Fig. 6a, the fluorescence emission peak at 525 nm decreases continuously with the gradual addition of Cu2+, and the fluorescence has been completely quenched after adding a half equivalent of Cu2+. Therefore, the binding ratio between probe L1 and Cu2+ can be determined as 2![[thin space (1/6-em)]](https://www.rsc.org/images/entities/char_2009.gif) :
:![[thin space (1/6-em)]](https://www.rsc.org/images/entities/char_2009.gif) 1, which is in agreement with the result of the high resolution mass spectrum (Fig. S16†) and Job's plot (Fig. S22†). The mass spectrum peak of 1395.4503 ([M − H]+, m/z) is belong to the complex [2L1+Cu2+] (calculated for C94H75CuO8+, m/z: 1395.4786), and the peak of Job's plot is at 0.66. According to the Benesi–Hildebrand equation, the binding constant was calculated as 6.77 × 10² M−1 (Fig. S23†). In addition, the DL was calculated based on the fluorescence titration experiment (Fig. S24†) by using the IUPAC method. Ten sets of blank experiments were performed in the absence of Cu2+, and the fluorescence emission intensity at 525 nm was adopted to calculate the SD to be 0.086. Based on the equation DL = 3SD/k, k is the slope of the calibration curve, L1 has a DL of 1.49 × 10⁻⁷ mol L−1 for the detection of Cu2+, which is decently low in comparison with other values of related works (Table S2†).
1, which is in agreement with the result of the high resolution mass spectrum (Fig. S16†) and Job's plot (Fig. S22†). The mass spectrum peak of 1395.4503 ([M − H]+, m/z) is belong to the complex [2L1+Cu2+] (calculated for C94H75CuO8+, m/z: 1395.4786), and the peak of Job's plot is at 0.66. According to the Benesi–Hildebrand equation, the binding constant was calculated as 6.77 × 10² M−1 (Fig. S23†). In addition, the DL was calculated based on the fluorescence titration experiment (Fig. S24†) by using the IUPAC method. Ten sets of blank experiments were performed in the absence of Cu2+, and the fluorescence emission intensity at 525 nm was adopted to calculate the SD to be 0.086. Based on the equation DL = 3SD/k, k is the slope of the calibration curve, L1 has a DL of 1.49 × 10⁻⁷ mol L−1 for the detection of Cu2+, which is decently low in comparison with other values of related works (Table S2†).
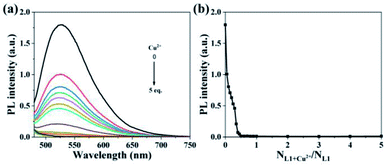 | ||
| Fig. 6 (a) Fluorescence spectra and (b) fluorescence intensity plot at 525 nm of L1 (1.00 × 10⁻⁵ mol L−1) in the solution (Vwater/VTHF = 4/1) with the continuous addition of Cu2+ (0–5 eq.). | ||
3.8 Cu2+ indicator paper
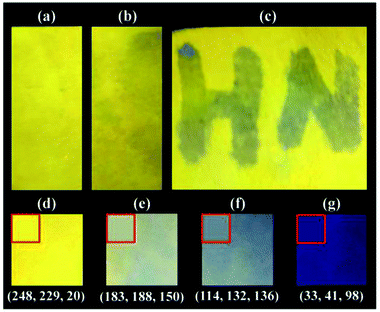
In order to explore the practical application potential of L1, a filter paper was soaked in THF solution containing L1 (1 mM) for 5 s and dried in air to obtain a simple Cu2+ fluorescent indicator paper (Fig. 7a). Under the UV light of 365 nm, the indicator paper has no significant change after moistening with water (Fig. 7b), and the Cu2+ aqueous can effectively quench its fluorescence (Fig. 7c), for example, the word “HN” written with 0.01 mM Cu2+ aqueous solution on the indicator paper shows quenched fluorescence. Furthermore, the fluorescence responses of indicator paper to different concentration of Cu2+ aqueous solution were also investigated, and the fluorescence photographs and their fluorescence intensities are shown in Fig. 7d–g and S25,† respectively. After soaking in 0.01 mM Cu2+ aqueous solution for 10 s, the fluorescence intensity of obtained indicator paper has a sharp decline by 79.2% in comparison to that soaking in water. And the fluorescence intensities of indicator papers soaked in 0.1 mM and 1 mM Cu2+ aqueous solution maintain 14.4% and 10.9% of initial values, respectively. Additionally, the average color of indicator papers was also simulated, and the relative RGB values are shown in Fig. 7.4 Conclusions
In summary, a series of TPE-modified curcuminoids named L1–4 have been designed and synthesized to improve the detection capability of curcumin-based fluorescent probe in aqueous solution. According to experimental results, different substituents on the curcumin moiety have different effects on the AIEE properties and Cu2+ recognition capability, and only methoxy-substituted L1 has met both requirements simultaneously. The on-off fluorescent probe based on the L1 particles possesses high selectivity, good anti-interference capability and rapid fluorescence recognition for Cu2+ detection, and its detection limit is as low as 149 nM. At the same time, a simple Cu2+ fluorescent indicator paper was prepared with L1 and displayed effective and rapid detection for Cu2+ aqueous solution. This work demonstrates that the introduction of TPE is an effective strategy to enhance the fluorescent intensity and maintain the recognition capability of probe in aqueous solution, and it is necessary to optimize the molecular structure reasonably for achieving the optimal performance of probe.Author contributions
Yang Lin: conceptualization, investigation, methodology, data curation, formal analysis, and writing – original draft. Ao Yu: investigation, methodology. Jinjing Wang: investigation, methodology. Derui Kong: investigation, data curation. Hongtao Liu: conceptualization, formal analysis, validation, and writing – review & editing. Jianwei Li: conceptualization, resources, funding acquisition, supervision, and writing – review & editing. Chunman Jia: conceptualization, resources, funding acquisition, supervision, project administration, and writing – review & editing. All authors contributed to discussions about the results and the manuscript.Conflicts of interest
There are no conflicts to declare.Acknowledgements
We are grateful for the financial support from the National Natural Science Foundation of China (22161017, 22161016) and the Start-up Research Foundation of Hainan University (KYQD(ZR)1852, KYQD(ZR)22034).References
- G. Xu, D. Wei, J. Wang, B. Jiang, M. Wang, X. Xue, S. Zhou, B. Wu and M. Jiang, Dyes Pigm., 2014, 101, 312–317 CrossRef CAS.
- C. Ran, X. Xu, S. B. Raymond, B. J. Ferrara, K. Neal, B. J. Bacskai, Z. Medarova and A. Moore, J. Am. Chem. Soc., 2009, 131, 15257–15261 CrossRef CAS PubMed.
- J. Yang, X. Zhang, P. Yuan, J. Yang, Y. Xu, J. Grutzendler, Y. Shao, A. Moore and C. Ran, Proc. Natl. Acad. Sci. U. S. A., 2017, 114, 12384–12389 CrossRef CAS PubMed.
- L. Pang, Y. Zhou, W. Gao, J. Zhang, H. Song, X. Wang, Y. Wang and X. Peng, Ind. Eng. Chem. Res., 2017, 56, 7650–7655 CrossRef CAS.
- Z. Pi, J. Wang, B. Jiang, G. Cheng and S. Zhou, Mater. Sci. Eng., C, 2015, 46, 565–571 CrossRef CAS PubMed.
- S. Prasad, D. DuBourdieu, A. Srivastava, P. Kumar and R. Lall, Int. J. Mol. Sci., 2021, 22, 7094 CrossRef CAS PubMed.
- F. Jasim and F. Ali, Microchem. J., 1992, 46, 209–214 CrossRef CAS.
- P. H. Bong, Bull. Korean Chem. Soc., 2000, 21, 81–86 CAS.
- D. P. Bhopate, P. G. Mahajan, K. M. Garadkar, G. B. Kolekar and S. R. Patil, New J. Chem., 2015, 39, 7086–7096 RSC.
- J. Mei, N. L. Leung, R. T. Kwok, J. W. Lam and B. Z. Tang, Chem. Rev., 2015, 115, 11718–11940 CrossRef CAS PubMed.
- B.-K. An, J. Gierschner and S. Y. Park, Acc. Chem. Res., 2012, 45, 544–554 CrossRef CAS PubMed.
- H. Li, H. Kim, J. Han, V. N. Nguyen, X. Peng and J. Yoon, Aggregate, 2021, 2, e51 Search PubMed.
- H. Wan, Q. Xu, P. Gu, H. Li, D. Chen, N. Li, J. He and J. Lu, J. Hazard. Mater., 2021, 403, 123656 CrossRef CAS PubMed.
- L. Biesen and T. J. J. Müller, Aggregate, 2021, 2, e105 CrossRef.
- Q. Lai, S. Si, T. Qin, B. Li, H. Wu, B. Liu, H. Xu and C. Zhao, Sens. Actuators, B, 2020, 307, 127640 CrossRef.
- Z. Luo, T. Lv, K. Zhu, Y. Li, L. Wang, J. J. Gooding, G. Liu and B. Liu, Angew. Chem., Int. Ed., 2020, 59, 3131–3136 CrossRef CAS PubMed.
- Y. Chen, W. Zhang, Y. Cai, R. T. K. Kwok, Y. Hu, J. W. Y. Lam, X. Gu, Z. He, Z. Zhao, X. Zheng, B. Chen, C. Gui and B. Z. Tang, Chem. Sci., 2017, 8, 2047–2055 RSC.
- H.-F. Xie, C.-J. Yu, Y.-L. Huang, H. Xu, Q.-L. Zhang, X.-H. Sun, X. Feng and C. Redshaw, Mater. Chem. Front., 2020, 4, 1500–1506 RSC.
- H. Wan, S. Zhou, P. Gu, F. Zhou, D. Lyu, Q. Xu, A. Wang, H. Shi, Q. Xu and J. Lu, Poly. Chem., 2020, 11, 1033–1042 RSC.
- C. Y. K. Chan, J. W. Y. Lam, C. Deng, X. Chen, K. S. Wong and B. Z. Tang, Macromolecules, 2015, 48, 1038–1047 CrossRef CAS.
- Y. Qian, L. Cao, C. Jia, P. O. Boamah, Q. Yang, C. Liu, Y. Huang and Q. Zhang, RSC Adv., 2015, 5, 77965–77972 RSC.
- G. Xu, J. Wang, G. Si, M. Wang, X. Xue, B. Wu and S. Zhou, Sens. Actuators, B, 2016, 230, 684–689 CrossRef CAS.
- L. Ding, L. Lin, C. Liu, H. Li, A. Qin, Y. Liu, L. Song, H. Zhang, B. Z. Tang and Y. Zhao, New J. Chem., 2011, 35, 1781–1786 RSC.
- M. F. Raduly, V. Raditoiu, A. Raditoiu, L. E. Wagner and A. G. Liliana, Rev. Chim., 2018, 69, 1327–1331 CrossRef CAS.
- X. Liu, Z. Xu and J. M. Cole, J. Phys. Chem. C, 2013, 117, 16584–16595 CrossRef CAS.
- V. A. Stepanova, A. Guerrero, C. Schull, J. Christensen, C. Trudeau, J. Cook, K. Wolmutt, J. Blochwitz, A. Ismail, J. K. West, A. M. Wheaton, I. A. Guzei, B. Yao and A. Kubatova, ACS Omega, 2022, 7, 7257–7277 CrossRef CAS PubMed.
- J. Qi, C. Sun, A. Zebibula, H. Zhang, R. T. K. Kwok, X. Zhao, W. Xi, J. W. Y. Lam, J. Qian and B. Z. Tang, Adv. Mater., 2018, 30, 1706856 CrossRef PubMed.
- T. Naghdi, S. Faham, T. Mahmoudi, N. Pourreza, R. Ghavami and H. Golmohammadi, ACS Sens., 2020, 5, 3770–3805 CrossRef CAS PubMed.
- G. Tamil Selvan, C. Varadaraju, R. Tamil Selvan, I. Enoch and P. Mosae Selvakumar, ACS Omega, 2018, 3, 7985–7992 CrossRef CAS PubMed.
- Y.-J. Wang, M.-H. Pan, A.-L. Cheng, L.-I. Lin, Y.-S. Ho, C.-Y. Hsieh and J.-K. Lin, J. Pharm. Biomed. Anal., 1997, 15, 1867–1876 CrossRef CAS PubMed.
Footnote |
| † Electronic supplementary information (ESI) available. CCDC 2167438. For ESI and crystallographic data in CIF or other electronic format see https://doi.org/10.1039/d2ra02595g |
| This journal is © The Royal Society of Chemistry 2022 |

