 Open Access Article
N-doped pinecone-based carbon with a hierarchical porous pie-like structure: a long-cycle-life anode material for potassium-ion batteries†
Jian-Fang Lu ab,
Ke-Chun Lic,
Xiao-Yan Lvd,
Fu-Hou Leib,
Yan Mib and
Yan-Xuan Wen
 *ae
*ae
aSchool of Chemistry and Chemical Engineering, Guangxi University, Nanning 530004, Guangxi, China. E-mail: wenyanxuan@vip.163.com
bSchool of Chemistry and Chemical Engineering, Guangxi MINZU University, Nanning 530006, Guangxi, China
cSchool of Materials and Environment, Guangxi MINZU University, Nanning 530006, Guangxi, China
dThe New Rural Development Research Institute, Guangxi University, Nanning 530004, Guangxi, China
eGuangxi Key Laboratory of Processing for Non-ferrous Metallic and Featured Materials, Guangxi University, Nanning 530004, Guangxi, China
First published on 13th July 2022
Abstract
Pinecone-based biomass carbon (PC) is a potential anode material for potassium-ion batteries because it is abundant, cheap, renewable, and easy to obtain. However, because of inferior kinetics and the effects of volume expansion due to the large radius of the K+ ion, it does not meet commercial performance requirements. In this study, nitrogen-doped PC (NPC) was prepared by carbonization in molten ZnCl2 with urea as a nitrogen source. A strategy based on synergistic effects between N doping and ZnCl2 molten salt was used to produce a hierarchically porous pie-like NPC with abundant defects and active sites and an enlarged interlayer distance—properties that enhance K+ adsorption, promote K+ intercalation/diffusion, and reduce the effects of volume expansion. This NPC exhibited a high reversible capacity (283 mA h g−1 at 50 mA g−1) and superior rate performance and cyclic stability (110 mA h g−1 after 1000 cycles at 5 A g−1), demonstrating its potential for use in potassium-ion batteries.
1. Introduction
The development of renewable and pollution-free energy systems is urgent in a time of global warming.1 Energy-storage systems (ESSs) play a key role in overcoming the intermittent and variable nature of renewable energy and smoothly integrating its output into the grid.2,3 Lithium-ion batteries (LIBs) have frequently been mentioned as viable ESSs because of their high energy density and long cycle life.4,5 However, large-scale application of LIBs is restricted by resource shortages, safety issues, and high cost.6 Potassium-ion batteries (PIBs) are an attractive alternative: they are safe, made from abundant raw materials, and feature low redox potentials and excellent ionic conductivity.7–11As is well-known, the anode material is a decisive factor in determining battery performance. Many anode materials for PIBs have been developed and evaluated, including alloy-based,12,13 conversion-based,13 and Ti-based materials.14 Unfortunately, these materials suffer from poor rate performance and cyclic stability: the severe volume expansion due to repeated insertion/extraction of large-radius K+ destroys the electrode structure.7,9,13
Stable carbonaceous anode materials with high electrical conductivity have been used to overcome these problems.9,10 These materials are categorized as either synthetic carbon or biomass-derived carbon (BC). Synthetic-carbon sources include polymers,15,16 organics,17 and metallorganics.18 However, synthetic carbon is costly and toxic, and the synthesis process is complex and pollutes the environment. Consequently, the large-scale application of synthetic carbon in PIBs is limited.
By contrast, BC is inexpensive, environment-friendly, and made from abundant resources.10,11 Several biomass precursors have been used to prepare carbon anodes for PIBs, including porous dandelion seeds,10 Ganoderma lucidum spores,11 soybeans,19 loofahs,20 tremellas,21 and walnut septa.22 Previous studies have shown that the electrochemical performance of BC anodes depends strongly on their source;4,9 therefore, finding new biomass precursors is of great importance.
In this study, we consider pinecone-based carbon (PC) as a PIB anode material. Pinecones are the fruit of pine plants. Although a small number are used to produce pine nuts and extract active components,23,24 most pinecones are discarded or burned. The use of pinecones as biomass precursors for BC offers the possibility of extracting economic value from a material that now goes to waste.
Despite intensive research, the specific capacity, rate performance, and cycle stability of BC still cannot meet the requirements of PIBs.19,20 Among the various strategies have been devised to improve the electrochemical performance of BC is the introduction of heteroatoms (e.g. nitrogen atoms15–17,22) into the carbon framework; this method has been shown to be effective for improving BC performance.10,11,19 For example, N-doped 2D tremella-derived carbon nanosheets exhibit an excellent long cycle (122.9 mA h g−1 after 1000 cycles at 1 A g−1).21 N-doped cage-like porous carbon (CPC) prepared by carbonizing Ganoderma lucidum spores possess an excellent rate performance and long-term cyclability (124.6 mA h g−1 after 700 cycles at 1 A g−1).11 The enhanced performance can be attributed to structural alterations caused by heteroatom doping.
Carbonization in molten salt is a simple method of preparing BC, with the molten salt playing a key role in determining the BC microstructure.25,26 We speculate that there could also be a synergistic effect between N doping and molten salt. To investigate this, we used carbonization to synthesize two N-doped pinecone-based carbons with and without molten ZnCl2, respectively, which are named as NPC and nPC. We compared the results of NPC, nPC and PC without N doping and confirmed that synergistic effects between N doping and molten ZnCl2 can optimize the performance of the NPC.
2. Experimental
2.1 Preparation of material
To prepare NPC, pinecone powder (Masson pine, Shishan Park, Nanning, China) was mixed with urea and ZnCl2 in the mass proportions 1![[thin space (1/6-em)]](https://www.rsc.org/images/entities/char_2009.gif) :
:![[thin space (1/6-em)]](https://www.rsc.org/images/entities/char_2009.gif) 0.5
0.5![[thin space (1/6-em)]](https://www.rsc.org/images/entities/char_2009.gif) :
:![[thin space (1/6-em)]](https://www.rsc.org/images/entities/char_2009.gif) 4. The mixture was heated to 600 °C at a heating rate of 5 °C min−1 and then calcined for 5 h under a nitrogen atmosphere. NPC was obtained by washing the calcined product with 30% hydrochloric acid and distilled water to remove excess ZnCl2 and residual impurities. For comparison, PC was also synthesized without urea.
4. The mixture was heated to 600 °C at a heating rate of 5 °C min−1 and then calcined for 5 h under a nitrogen atmosphere. NPC was obtained by washing the calcined product with 30% hydrochloric acid and distilled water to remove excess ZnCl2 and residual impurities. For comparison, PC was also synthesized without urea.
2.2 Microstructural analysis
X-ray diffraction (XRD, BRUKER D8 Advance, Germany) was used to determine the structure of the samples. Raman spectroscopy (HORIBA JY LabRAM HR Evolution, France) was performed at a laser wavelength of 532 nm. Defects were analyzed by electron paramagnetic resonance (EPR; SE/X-type X-band spectrometer, Poland) at a microwave frequency of 9.06 GHz. The morphologies were observed using field-emission scanning electron microscopy (FESEM; SUPRA 55 Sapphire, Zeiss, Germany) and high-resolution transmission electron microscopy (HRTEM; FEI Tecnai G2 F20s-twin 200 kV, USA). A TriStar II 3020 surface-area and porosity analyzer (Micromeritics, Georgia, USA) was used to perform N2 adsorption–desorption experiments. The specific surface area was calculated using the BET method. The microporous specific surface area (Smic) and micropore volume (Vmic) were calculated by the t-plot method. Pore size distributions (PSDs) were determined by density functional theory (DFT). The element composition and content of as-prepared carbon materials were analyzed with an element analyzer (Vario EL cube, Germany).The electrode sheet after full charge/discharge was washed with dimethyl carbonate (DMC) before ex situ testing. Ex situ X-ray photoelectron spectroscopy (XPS) was carried out after the electrode material was etched 10, 50, 100 and 150 nm, respectively.
2.3 Electrochemical tests
The electrochemical performance of the samples was evaluated using standard CR2032-type coin half-cells assembled in a glovebox in a dry, high-purity argon atmosphere. Each CR2032-type coin comprised a working electrode, potassium-foil anode, glass-fiber separator (Whatman, GF/B), and electrolyte (0.8 M KPF6/ethylene carbonate (EC)/diethyl carbonate (DEC), 1![[thin space (1/6-em)]](https://www.rsc.org/images/entities/char_2009.gif) :
:![[thin space (1/6-em)]](https://www.rsc.org/images/entities/char_2009.gif) 1 by volume).
1 by volume).
The working electrode was prepared as follows: the prepared sample, acetylene black, and polyvinylidene fluoride (PVDF) binder were mixed with mass proportions 80![[thin space (1/6-em)]](https://www.rsc.org/images/entities/char_2009.gif) :
:![[thin space (1/6-em)]](https://www.rsc.org/images/entities/char_2009.gif) 10
10![[thin space (1/6-em)]](https://www.rsc.org/images/entities/char_2009.gif) :
:![[thin space (1/6-em)]](https://www.rsc.org/images/entities/char_2009.gif) 10 in N-methyl pyrrolidone (NMP). The mixed slurry was coated on a Cu foil and dried under vacuum at 120 °C overnight. Then, the working electrodes were punched out and weighed. The amount of active substance is about 1.5–2.0 mg cm2.
10 in N-methyl pyrrolidone (NMP). The mixed slurry was coated on a Cu foil and dried under vacuum at 120 °C overnight. Then, the working electrodes were punched out and weighed. The amount of active substance is about 1.5–2.0 mg cm2.
Galvanostatic charge–discharge tests were performed on a BTS 4000 battery cycler (Shenzhen NEWARE Electronics Co. Ltd., Shenzhen, China) at 25 °C in the potential range 0.01–3 V (vs. K/K+). The current density and specific capacity of the sample were calculated according to the mass of carbon prepared in the working electrode. An electrochemical workstation (Interface 1010E, Gamry Instruments, Warminster, USA) was used to perform cyclic voltammetry (CV) over the potential range 0.01–3.0 V, as well as electrochemical impedance spectroscopy (EIS) over the frequency range 105–10−3 Hz at 25 °C.
3. Results and discussion
3.1 Structural and morphological characterization
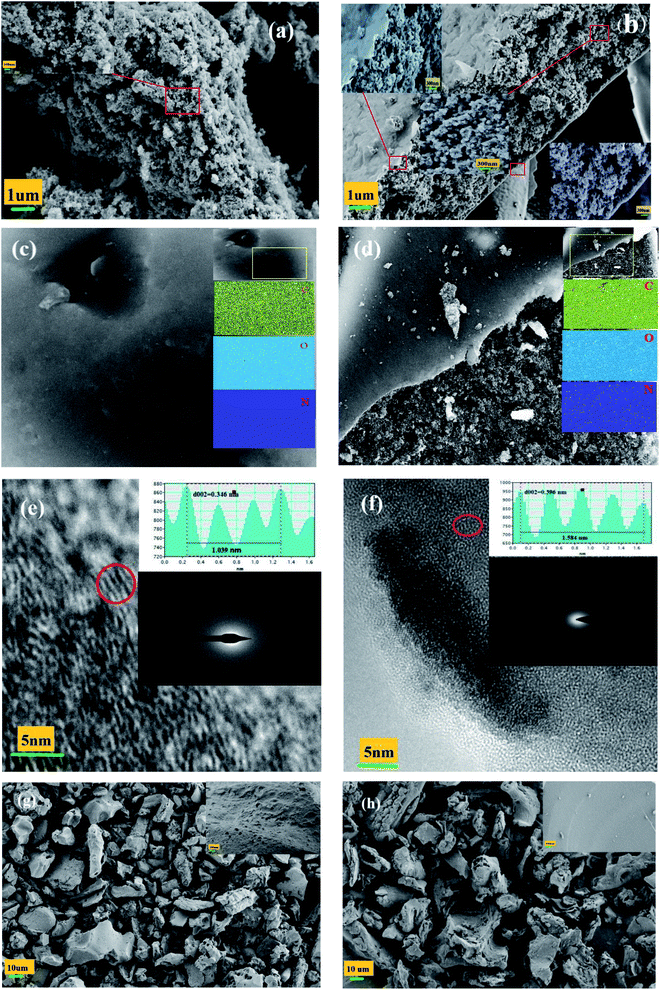
Fig. 1 shows the effects of N doping on PC morphology. The pure PC in Fig. 1(a) is simply a mass of accumulated particles. By contrast, the NPC in Fig. 1(b) is an approximately 3–5 μm thick layer with a pie-like structure: many accumulated particles in the interior and a crooked and wrinkled crust or membrane on the exterior surface. This membrane was formed by blowing gas from the decomposition of urea and catalysis of ZnCl2.27–29 As shown in Fig. 1(c, d) and S1(a),† the nitrogen signals of NPC and nPC were evenly spread throughout the carbon matrix; the N content of NPC and nPC measured by elemental analysis was 7.89% and 3.26% (Table 1), indicating that nitrogen was successfully doped into the carbon skeleton and evenly distributed. All NPC, nPC and PC are amorphous structures, as confirmed by the diffuse diffraction ring shown in the insert of Fig. 1(e, f) and S1(b).† Compared to PC and nPC (Fig. 1(e) and S1(b)),† NPC has a more disordered framework region, and a wider locally-stacked-graphite layer distance (0.396 nm).30–33 As seen in Fig. 1(g), the sample prepared without ZnCl2 exhibited irregular thick blocks with an uneven surface and a few irregular holes; the sample prepared with neither urea nor ZnCl2 (Fig. 1(h)) presented irregular thick blocks with a relatively smooth surface and no obvious holes. Comparing the morphology of the four samples, it is found that they are obviously different. These results confirm that the synergistic effect of N doping and ZnCl2 molten salt is largely responsible for the morphology of NPC.| Sample | SBET (m2 g−1) | Smicroa (m2 g−1) | Db (nm) | Vtotc (cm3 g−1) | Vmicrod (cm3 g−1) | Vmicro/Vtot (%) | Elemental content (%) | |||
|---|---|---|---|---|---|---|---|---|---|---|
| C | N | O | H | |||||||
| a Micropore surface area.b Mean pore size.c Total pore volume.d Micropore volume. | ||||||||||
| PC | 1703 | 197 | 4.74 | 1.86 | 0.18 | 9.92 | 68.10 | 0.05 | 26.83 | 3.24 |
| NPC | 1358 | 434 | 3.67 | 0.98 | 0.19 | 19.39 | 58.16 | 7.89 | 29.76 | 2.37 |
| nPC | 817 | 662 | 1.82 | 0.43 | 0.30 | 69.77 | 65.32 | 3.26 | 30.24 | 1.18 |
N2 adsorption/desorption isotherms were obtained to investigate further the pore structures of PC, NPC and nPC. Fig. 2 and Table 1 present the isothermal adsorption/desorption curves and the corresponding pore-size distributions, specific surface areas, and pore structure parameters. As seen in Fig. 2, nPC had type-I isotherm corresponding to a typical microporous structure. PC displayed type-IV isotherm, and NPC showed type-II isotherm. The hysteresis loops between the relative pressures of 0.4 and 1.0 indicate the existence of mesopores,30,32 and the sharp adsorptions at a relative pressure of less than 0.05 indicate micropores.19,20 In addition, the slow upward trend between 0.9 and 1.0 for NPC implies the existence of macropores.34,35 As shown in the insert of Fig. 2(a–c), the pore size distributions of PC, NPC and nPC estimated by DFT were multimodal. These results reveal that NPC and PC are mainly hierarchical porous structure composed of micropores and mesopores, and nPC is mainly microporous structure. As listed in Table 1, the micropore surface areas, micropore volume (Vmicro), and Vmicro/Vtot ratio were larger for NPC and nPC than PC, indicating that N doping produces more abundant micropores. The above results testify synergistic effects of N doping and ZnCl2 molten salt are responsible for pore structure of NPC. The zinc chloride acted as a dehydrating agent that removed hydrogen and oxygen atoms from the pinecone through cycloaddition and degradation reactions.36,37 The hydrogen and oxygen atoms escaped in the form of water molecules, producing a microporous structure. In addition, ZnCl2 acted as a “salt template” to form mesoporous and macroporous structures.36,38 However, the decomposition of urea can also produce large amounts of small-molecule gases and thus of abundant micropores.27,39,40
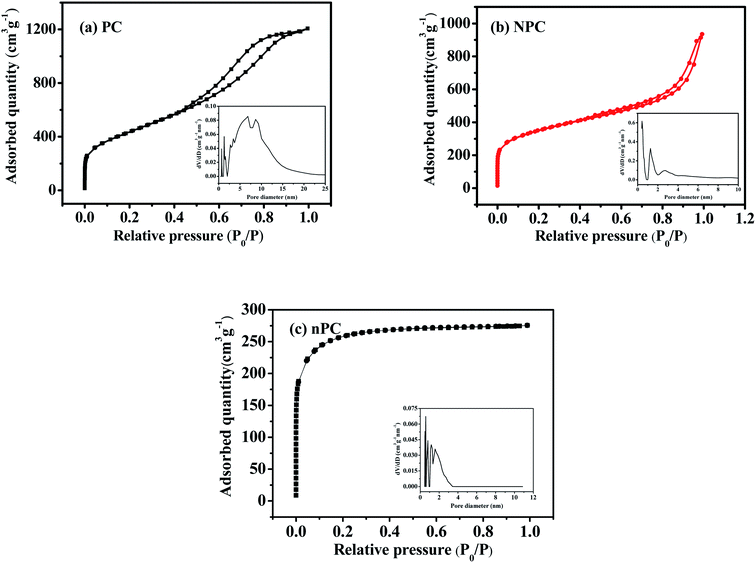 | ||
| Fig. 2 N2 adsorption/desorption isotherms and corresponding pore-size distributions in (a) undoped, (b) nitrogen-doped and (c) nitrogen-doped without ZnCl2 pinecone-based carbon. | ||
The structures of NPC, nPC and PC were characterized by XRD and Raman spectroscopy. As shown in Fig. 3(a), both carbons exhibited an intense broad (002) diffraction peak at 24° and a weak broad (100) diffraction peak at 42°, suggesting amorphous features.33,41 N doping caused the (002) peaks of NPC and nPC to shift to a lower angle than that of PC.10,17,31,32
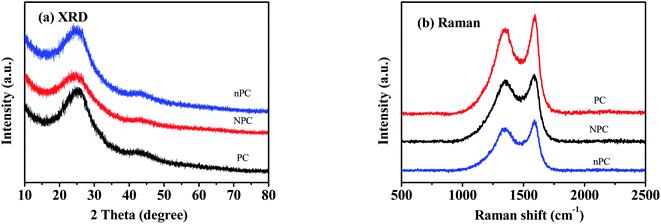 | ||
| Fig. 3 Spectra of undoped (PC), nitrogen-doped (NPC) and nitrogen-doped without ZnCl2 (nPC) pinecone-based carbon: (a) XRD; (b) Raman. | ||
The interlayer distances (d002) of carbon materials can be calculated by the Bragg equation (2d![[thin space (1/6-em)]](https://www.rsc.org/images/entities/char_2009.gif) sin
sin![[thin space (1/6-em)]](https://www.rsc.org/images/entities/char_2009.gif) θ = nλ).31,32 The values of d002 for NPC, nPC and PC were 0.397, 0.363 and 0.347 nm, respectively; these are consistent with HRTEM observation. The larger d002 of NPC can be attributed to nitrogen doped into the carbon framework. Nitrogen doping seriously distorts adjacent short-distance lattices, expanding the interlayer distance;33 this can favor the insertion of K+.17,33,42–46
θ = nλ).31,32 The values of d002 for NPC, nPC and PC were 0.397, 0.363 and 0.347 nm, respectively; these are consistent with HRTEM observation. The larger d002 of NPC can be attributed to nitrogen doped into the carbon framework. Nitrogen doping seriously distorts adjacent short-distance lattices, expanding the interlayer distance;33 this can favor the insertion of K+.17,33,42–46
The Raman spectra of NPC, nPC and PC in Fig. 3(b) exhibit two strong and broad overlapping peaks located at approximately 1356 and 1587 cm−1, corresponding to the D and G bands.19,32 The former is related to disordered or defective structure, and the latter to crystalline or ordered graphitic structure.31,47 The ratio ID/IG of D to G band intensities can be used to estimate the disorder degree of carbon materials.31,47 For NPC, nPC and PC, the calculated ratios were 1.16, 0.96 and 0.94, respectively, suggesting that N doping led to a more disordered structure and more exposed defects.48,49 When N was introduced into the carbon framework, more edges, defects, and vacancies were produced, while the graphitization of carbon was inhibited; thus, the disorder degree of the carbon increased.42,46,48,49
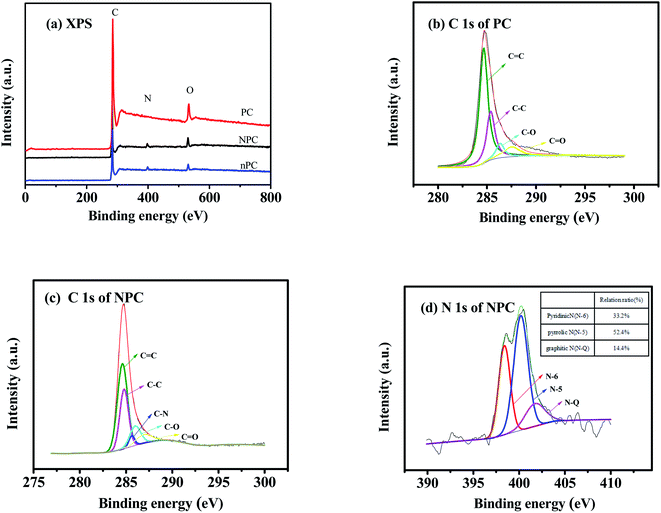
X-ray photoelectron spectroscopy (XPS) was used for further insight into the surface chemical compositions and bonding configurations. In Fig. 4(a), the intense peaks at 284 and 531 eV correspond to C 1s and O 1s, respectively; the weak peaks at 399 eV of NPC and nPC can be ascribed to N 1s.10,11,18 High-resolution spectra of the C 1s peak of PC and NPC are given in Fig. 4(b and c) C–C, C![[double bond, length as m-dash]](https://www.rsc.org/images/entities/char_e001.gif) C, C–O and C
C, C–O and C![[double bond, length as m-dash]](https://www.rsc.org/images/entities/char_e001.gif) O bonds can be observed in Fig. 4(b and c); they formed during the carbonization with ZnCl2 through a series of reactions such as dehydration, decarboxylation, aromatization, cycloaddition, and condensation.50–52 Unlike PC, NPC had a peak at 285.5 eV (related to C–N bonding),53–55 further confirming that nitrogen atoms were successfully doped into the carbon matrix. After N doping, the C
O bonds can be observed in Fig. 4(b and c); they formed during the carbonization with ZnCl2 through a series of reactions such as dehydration, decarboxylation, aromatization, cycloaddition, and condensation.50–52 Unlike PC, NPC had a peak at 285.5 eV (related to C–N bonding),53–55 further confirming that nitrogen atoms were successfully doped into the carbon matrix. After N doping, the C![[double bond, length as m-dash]](https://www.rsc.org/images/entities/char_e001.gif) C bond content decreased from 55.24% to 49.77%, whereas the C–C bond content increased from 26.34% to 29.91%. The reason is that N doping increased the disorder degree.
C bond content decreased from 55.24% to 49.77%, whereas the C–C bond content increased from 26.34% to 29.91%. The reason is that N doping increased the disorder degree.
The N 1s peak of NPC in Fig. 4(d) can be divided into three apparent peaks at 398.5, 400.1, and 401.8 eV, which correspond to pyridinic N (N-6), pyrrolic N (N-5), and graphitic N (N-Q), respectively.53–55 The relative ratios of N-6, N-5, and N-Q were 33.2, 52.4, and 14.4%. While the corresponding ratios of nPC were 20.4, 50.7 and 28.9% (Fig. S2†). The N-6 represents cases in which a nitrogen atom replaced a carbon atom in a defect or at the edge of the graphite plane.30 The N-5 originated when a nitrogen atom replaced a carbon atom in a five-membered ring, inducing more vacancies.30 Therefore, the higher percentages of N-5 and N-6 in NPC than that of N-Q and also higher than that of N-5 and N-6 in nPC means that N doping provides more defects and active sites for the adsorption and storage of K+; this is beneficial for the pseudo-capacitance.53,54 On the other hand, these introduced carbon–nitrogen groups can expand the interlayer spacing and weaken the attraction between the graphene-like layers of carbon, consistent with the results of HRTEM and XRD.33
Electron paramagnetic resonance (EPR) was employed to investigate the concentrations of N defects and the unpaired electrons at delocalization states at room temperature. As shown in Fig. 5, NPC and nPC have a single sharp symmetrical peak with a narrow peak-to-peak line width, whereas PC has no obvious corresponding EPR signal; this indicates that N doping creates N defects in the structure of NPC and nPC. The g values of NPC (2.0027) and nPC (2.0025) are close to that of a free electron (2.0023),56 indicating that the paramagnetic center originates from the unpaired delocalized electrons in the π-conjugated heterocycle, resulting from strongly electronegative N introduced into the sp2 C atoms.56 Pyridinic and pyrrolic nitrogen are dangling edge-nitrogen, which can provide extra defect active sites for enhancing charge storage capacity by reversibly binding potassium ions with dangling nitrogen bonds.57 Based on the N 1s XPS result, NPC and nPC show high-level of edge-nitrogen doping reaching up to 85.6% and 71.1%, respectively. Therefore, the defects of NPC and nPC are dangling nitrogen bonds. It is well known that the defect concentration is positively related to the spin density.58 The higher spin density (3.81 × 10¹⁶ spin per g) in NPC than that (3.37 × 10¹⁵ spin per g) in nPC indicates that the synergistic effect of N doping and ZnCl2 molten salt can generate more N defects, which can improve K+ storage56
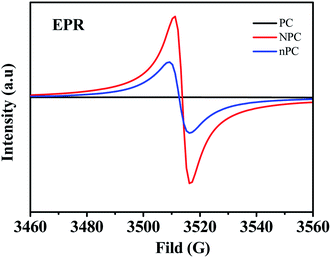 | ||
| Fig. 5 EPR spectra of undoped (PC), nitrogen-doped (NPC) and nitrogen-doped without ZnCl2 (nPC) pinecone-based carbon. | ||
3.2 Electrochemical performance in K-ion batteries
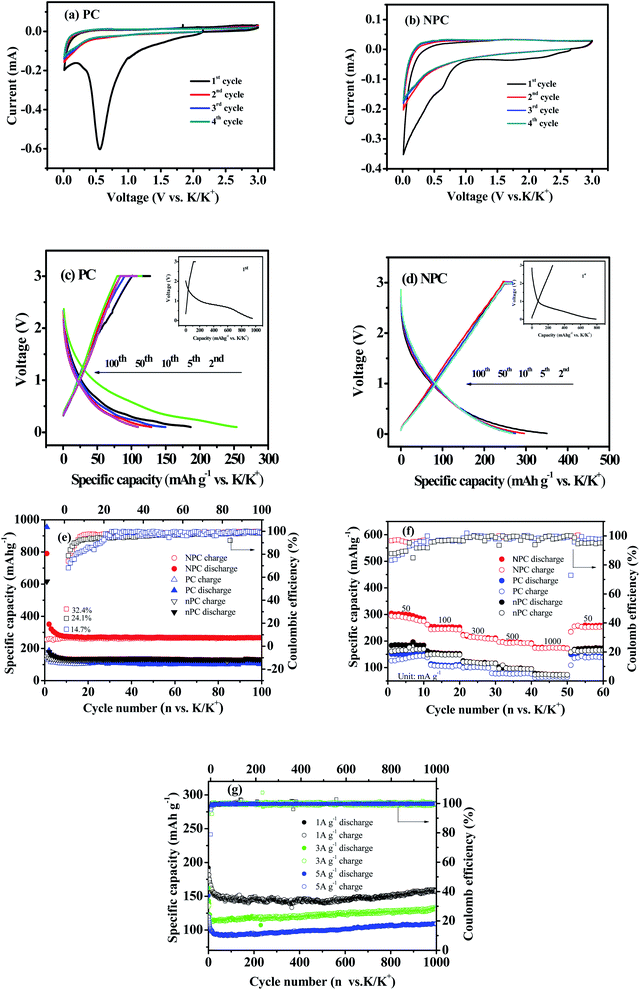
Fig. 6(a, b) and S3(a)† display CV curves of PC, NPC and nPC at 0.1 mV s−1. With exception of the first cycle, the samples display similar CV curves, suggesting that PC, NPC and nPC have similar K-ion storage mechanisms. A sharp cathodic peak at ∼0.01 V corresponds to the insertion of K ions into the graphite layers to form KCx compounds.33,59 However, the corresponding anodic peak is only a broad peak over a wide voltage window; this is ascribable to the adsorption of K+ on active and defect sites and the sluggish electrochemical reaction kinetics of large-radius K+.30,60,61 An irreversible reduction peak at about 0.6 V appears in the first cathodic scan only; it can be attributed to the formation (by electrolyte decomposition) of a solid–electrolyte interface (SEI) film on the electrode surface and to irreversible potassiation.60–62 However, this peak is much weaker for NPC (Fig. 6(b)) than for PC and nPC (Fig. 6(a) and S3(a)†), suggesting the former has a low initial discharge capacity and higher coulombic efficiency.Fig. 6(c, d) and S3(b)† exhibit the galvanostatic charge–discharge profiles of PC, NPC and nPC in different cycles. The voltage platform at approximately 0.6 V in the initial discharge corresponds to the irreversible reduction peak in the first cathodic scan in Fig. 6(a, b) and S3(a).†49,54 The initial discharge/charge capacities of PC, NPC and nPC were 954/140, 790/256 and 617/149 mA h g−1, respectively, and the corresponding initial coulombic efficiencies (ICEs) were 14.7%, 32.4% and 24.1%. The improved ICE of NPC can be attributed to the fact that the synergistic effect of N doping and ZnCl2 molten salt leads to more active sites and larger interlayer spacing, which can reduce the irreversible intercalation/adsorption of potassium ions.53,54 In addition, the charge/discharge curves of NPC almost completely overlap, indicating that NPC as a PIB anode has good reversibility and cyclic stability.63
Fig. 6(e, f) presents the cycle and rate performances of PC, NPC and nPC. After 100 cycles at 50 mA g−1, NPC delivers a reversible capacity of 267 mA h g−1, and nPC delivers 132 mA h g−1, while PC only delivers 109 mA h g−1. When charged/discharged at 50, 100, 300, 500, and 1000 mA g−1, the capacities of NPC are 283, 252, 211, 193, and 173 mA h g−1, and nPC shows 184, 153, 117, 96 and 73 mA h g−1, while those of PC are 150, 111, 100, 79, 64, and 141 mA h g−1. These results further demonstrate that both N-doping and ZnCl2 molten salt are beneficial to improve the electrochemical performance of carbon materials. Moreover, as seen in Fig. 6(g), NPC exhibits capacities of 159, 131, and 110 mA h g−1 with corresponding capacity-retention ratios of 82.3, 81.5, and 72.8% at 1, 3, and 5 A g−1 for 1000 cycles; the corresponding capacity decay is 0.03% per cycle, revealing excellent long-term cyclability. Besides, compared with commercial graphite (Shenzhen Kejingzhida Technology Co., Ltd., Shenzhen, China), NPC shows superior electrochemical performances (Fig. S4†), indicating that NPC can be used as an alternative to commercial graphite for energy storage.
Table 2 shows that NPC outperforms seven other N-doped BC anodes reported in the literature in terms of reversible capacity, cycle stability, and rate performance. The enhanced performance for NPC can be ascribed to the synergistic effect of porous structure and N doping, which generates more active sites/defects and expands the layer distance, promoting the adsorption, intercalation, and diffusion of K+ and enhancing the structural stability of carbon matrix.15,33,53,59,64–67
| Sample/precursor | Cycle stability | Rate capability | Reference |
|---|---|---|---|
| NPC/pinecone | 267 mA h g−1 at 50 mA g−1 for 100 cycles | 109 mA h g−1 at 5 A g−1 | This work |
| 132 mA h g−1 at 3 A g−1 for 1000 cycles | |||
| Hierarchical porous carbon/dandelion seed | 243 mA h g−1 at 0.05 A g−1 for 100 cycles | 126 mA h g−1 at 1 A g−1 | 10 |
| Cage-like porous carbon/Ganoderma lucidum spore | 124.6 mA h g−1 at 1 A g−1 for 700 cycles | 133 mA h g−1 at 1 A g−1 | 11 |
| Hierarchical porous carbon/soybean | 196 mA h g−1 at 50 mA g−1 for 900 cycles | 70 mA h g−1 at 0.8 A g−1 | 19 |
| 2D carbon nanosheets/tremella | 122.9 mA h g−1 at 0.5 A g−1 for 1000 cycles | 84.7 mA h g−1 at 5 A g−1 | 21 |
| Biomorphic N-doped carbon/walnut septum | 119.9 mA h g−1 at 1A g−1 for 1000 cycles | 154.5 mA h g−1 at 1 A g−1 | 22 |
| O/N-doped hard carbon/maple leaf | 141.9 mA h g−1 at 1 A g−1 for 1000 cycles | 144.8 mA h g−1 at 1 A g−1 | 53 |
| Honeycomb-like carbon/rhododendron | 87.1 mA h g−1 at 2 A g−1 for 1000 cycles | 53.5 mA h g−1 at 10 A g−1 | 61 |
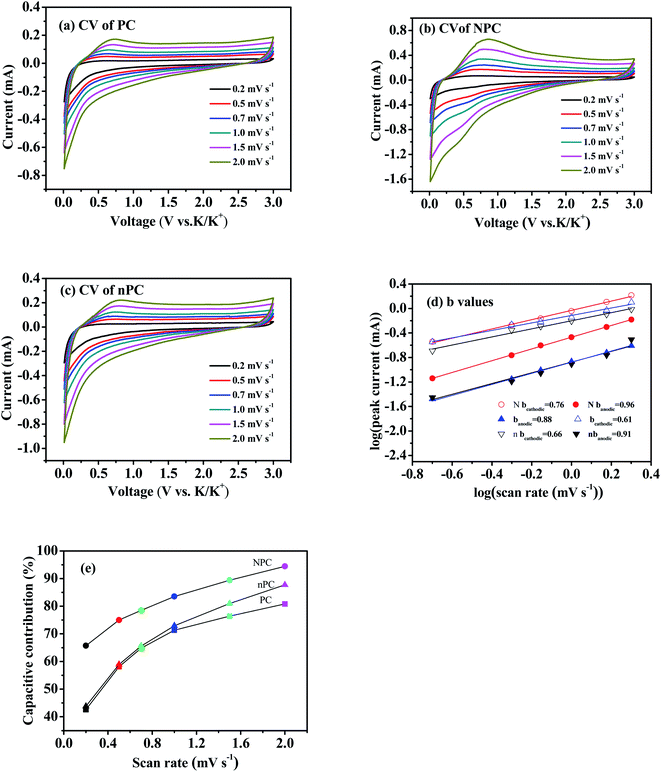
CV was also used to understand the mechanism of K+ storage. Fig. 7(a–c) shows the CV curves of PC, NPC and nPC measured in the potential-scanning-rate range 0.2–2 mV s−1. As the scanning rate increased, the shapes of all the CV curves were well maintained. The quasi-rectangular CV-curve shape of NPC indicates that the capacitive behavior was due to the large specific surface area and high defect concentration for K+ adsorption.59,68 In CV, the peak current (i) and sweep rate (ν) follow the relationship log(i) = b![[thin space (1/6-em)]](https://www.rsc.org/images/entities/char_2009.gif) log(v) + log(a),47,54,67 where a and b are semi-empirical functions. Diffusion-controlled and surface-controlled processes in electrochemical reactions correspond to b values of 0.5 and 1, respectively.54,67 For NPC, nPC and PC, the respective b values of the cathodic peaks were 0.76, 0.66 and 0.61, and those of the anodic peaks were 0.96, 0.91 and 0.88, indicating that the potassium-storage process was to some extent both diffusion-controlled and surface-controlled.47,54,60,68
log(v) + log(a),47,54,67 where a and b are semi-empirical functions. Diffusion-controlled and surface-controlled processes in electrochemical reactions correspond to b values of 0.5 and 1, respectively.54,67 For NPC, nPC and PC, the respective b values of the cathodic peaks were 0.76, 0.66 and 0.61, and those of the anodic peaks were 0.96, 0.91 and 0.88, indicating that the potassium-storage process was to some extent both diffusion-controlled and surface-controlled.47,54,60,68
The capacitive contribution can be calculated by the relationship i(ν) = k1v + k2v1/2, where k1v and k2v1/2 represent the surface-controlled and diffusion-controlled contributions, respectively.69,70 Fig. 7(e) compares the capacitive contributions of PC, NPC and nPC. All three increased with the potential scanning rate, but NPC had a higher capacitive contribution than PC and nPC. When the scanning rate increased from 0.2 to 2 mV s−1, the capacitive contribution of NPC increased from 65.7% to 94.4%. These results further verify that K+ storage behavior is largely dependent on surface-controlled (adsorption) processes.28,47,53,59,60,68 The high capacitive contribution can be attributed to the abundance of active sites of defects and edges on the surface of the NPC electrode.59,68
EIS was carried out to analyze the electrode kinetics of PC, NPC and nPC at different cycles. Fig. 8 presents the Nyquist plots and corresponding equivalent circuits of PC, NPC and nPC electrodes in the 1st, 50th, 100th, and 500th cycles at 1 A g−1. As shown in Fig. 8, all the Nyquist curves consist of a compressed semicircle in the medium–high frequency region and an oblique line in the low frequency region.20,68,71 The semicircle corresponds to the charge-transfer impedance (Rct) and the ion-transfer impedance through the SEI layer (RSEI); the oblique line is related to ion diffusion inside the active material.20,68,71 Table 3 lists the EIS parameters obtained by fitting the Nyquist curves using the equivalent circuit in Fig. 8. The K+ diffusion coefficient can be calculated from
 | (1) |
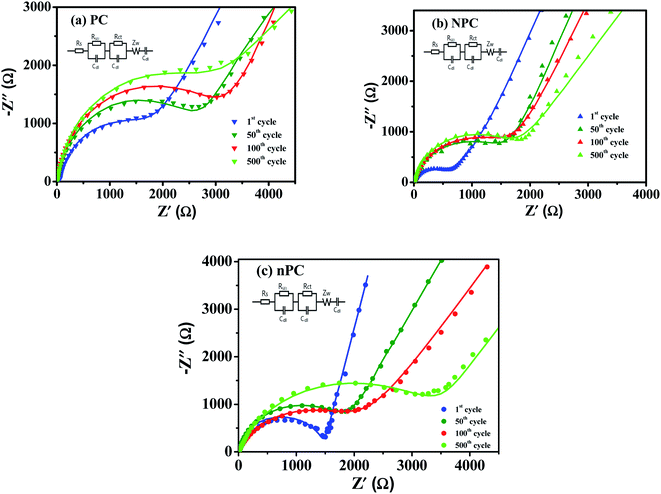 | ||
| Fig. 8 Nyquist plots at different cycles: (a) undoped and (b) nitrogen-doped and (c) nitrogen-doped without ZnCl2 pinecone-based carbon. | ||
| Cycle | Rs (Ω) | RSEI (Ω) | Rct (Ω) | DK+ (cm2 s−1) | ||||||||
|---|---|---|---|---|---|---|---|---|---|---|---|---|
| PC | NPC | nPC | PC | NPC | nPC | PC | NPC | nPC | PC | NPC | nPC | |
| 1 | 4.02 | 3.47 | 3.93 | 438 | 355 | 375 | 1149 | 623 | 1065 | 6.53 × 10⁻¹⁸ | 1.21 × 10⁻¹⁴ | 1.35 × 10⁻¹⁶ |
| 50 | 4.49 | 3.43 | 4.05 | 321 | 291 | 319 | 2273 | 1435 | 1671 | 4.97 × 10⁻¹⁸ | 6.25 × 10⁻¹⁵ | 7.89 × 10⁻¹⁷ |
| 100 | 3.98 | 4.52 | 4.64 | 303 | 285 | 300 | 2602 | 1524 | 2080 | 3.59 × 10⁻¹⁸ | 2.87 × 10⁻¹⁵ | 4.21 × 10⁻¹⁷ |
| 500 | 4.08 | 4.65 | 4.56 | 305 | 292 | 311 | 2739 | 1588 | 2646 | 2.97 × 10⁻¹⁸ | 2.36 × 10⁻¹⁵ | 2.65 × 10⁻¹⁷ |
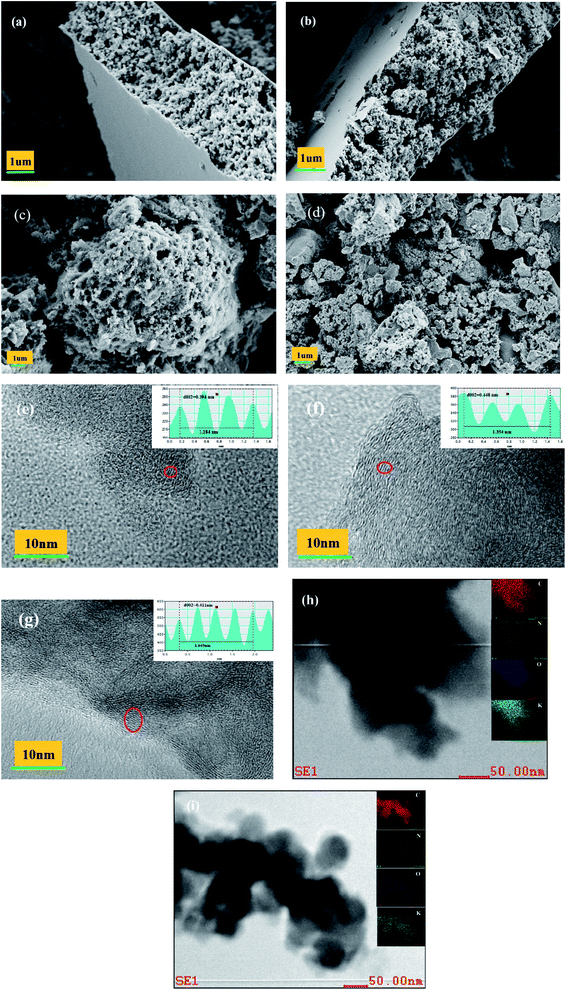
To understand more deeply the effects of N doping, ex situ SEM/TEM was used to characterize the morphology and microstructure of PC and NPC in different states. Fig. 9(a, b, c, d) and S5(a, b)† present the SEM images of NPC, PC and nPC in the fresh state and 1000th cycle, respectively. Unlike PC and nPC, NPC kept its structural integrity even after long-term cycling at high current density.
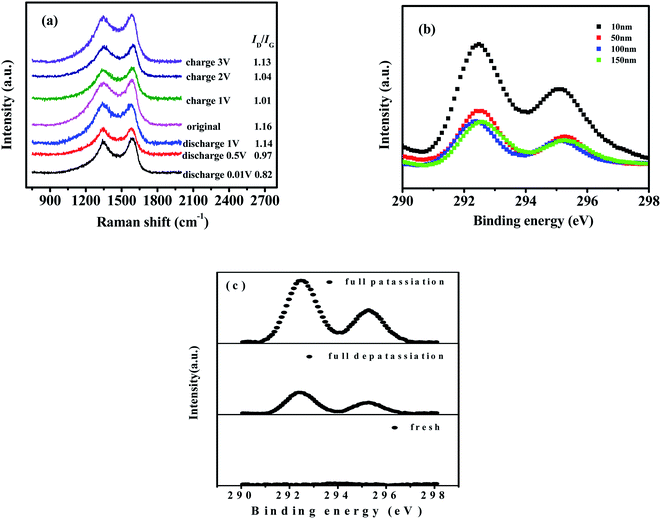
Fig. 9(e–g) shows the structure evolution of NPC in the fresh, first full-potassiation, and first full-depotassiation states, respectively. The average interlayer spacing was 0.394 nm for the fresh NPC (Fig. 9(e)); it remarkably increased to 0.448 nm after full discharge (Fig. 9(f)), indicating the successful insertion of K+ ions. The local graphite layers exhibited an improved ordered structure after the insertion of K+: as shown in Fig. 9(g), the average interlayer spacing shrank to 0.411 nm, and the ordered structure of the local graphite layers decreased after the extraction of K+. The interlayer spacing only changed 4% during the first insertion/extraction of K+, indicating excellent potassiation/depotassiation reversibility and superior structural stability. As revealed by the energy-dispersive X-ray spectrometric (EDS) mappings in Fig. 9(h and i), the K-element content changed sharply during the first charge/discharge, further demonstrating that potassium ions were successfully inserted and extracted from the carbon matrix. However, the K-element content was non-zero after the charge process, meaning K+ was incompletely deintercalated from NPC. The non-zero potassium content can be ascribed to the residual potassium in SEI films and the irreversible deintercalation or desorption of K+ in the active sites.54
Furthermore, ex situ Raman spectroscopy was performed to analyze the structural evolution of NPC in the first cycle. When the electrode was discharged to 0.01 V, the ratio of ID/IG in Fig. 10(a) gradually decreased from 1.16 to 0.82, indicating that some of the disordered carbon region was transformed into graphitic stacking owing to the insertion of K+;68,75 this is in accordance with the ex situ HRTEM observations in Fig. 9(e–g). In the subsequent charge process, ID/IG increased to 1.13, illustrating that the amorphization degree of the carbon matrix improved because of the deintercalation of K+.54,68 The ratio of ID/IG in the charge process could not recover its original value in the discharge process, because some irreversibly intercalated potassium ions remained in the graphite layers.46,54
Ex situ XPS was further applied to investigate the changing level of K inside the NPC electrode during the intercalation/deintercalation process and the fresh state. As shown in Fig. 10(b), the potassium intensity at etching depth 10 nm was higher than that at etching depths 50–150 nm, suggesting that there was more residual potassium in the SEI film than in the carbon matrix.28,54 The intensity at etching depths 50–150 nm remained relatively stable, implying that potassium was evenly distributed inside the carbon particles. Therefore, the following samples are tested after being etched at 50 nm.
As seen in Fig. 10(c), no K-signal peaks were observed in the fresh NPC electrode. However, two characteristic peaks (K 2p3/2 and K 2p1/2) were detected during the potassiation process, indicating that potassium ions were intercalated into NPC. In the subsequent depotassiation process, the K 2p peak intensity decreased as potassium ions were extracted reversibly from the carbon framework. These results were consistent with the EDS-mapping observations in Fig. 9(h and i). Thus, the good performance of NPC can be attributed to the reversible potassiation/depotassiation processes and the stable microstructure.
4. Conclusion
In summary, NPC was prepared by carbonization of pinecone precursor in ZnCl2 molten salt using urea as a nitrogen source. The synergistic effect between N doping and molten ZnCl2 produced a pie-like hierarchical porous structure with abundant defects and active sites and large interlayer spacing. This unique structure has two advantages: (1) it promotes the adsorption/desorption, intercalation/delamination, and diffusion of K+; and (2) it maintains the integrity of the electrode despite severe volume changes during the cycle. When used as a PIB anode, NPC delivers a capacity of 267 mA h g−1 for 100 cycles at 50 mA g−1 and 109 mA h g−1 after 1000 cycles at 5 A g−1, exhibiting a high reversible capacity, excellent cyclic stability, and good rate performance. Therefore, NPC is potentially applicable in PIBs. The findings in this work provide a new insight into the microstructure of PC and other BCs that should be useful in improving their performance.Conflicts of interest
There are no conflicts to declare.Acknowledgements
The authors appreciate the financial support of the National Natural Science Foundation of China (51864005 and 51564002), the Natural Science Foundation of Guangxi, China (2018GXNSFDA281014) and the Natural Science Foundation of Guangxi University for Nationalities (2019KJYB004).References
- J. Holdren, Science, 2017, 315, 737 CrossRef PubMed.
- Z. Yang, J. Zhang, M. Kintner-Meyer, X. Lu, D. Choi, J. Lemmon and J. Liu, Chem. Rev., 2011, 111, 3577–3613 CrossRef CAS PubMed.
- D. Larcher and J. Tarascon, Nat. Chem., 2015, 7, 19–29 CrossRef CAS PubMed.
- M. Li, J. Lu, Z. Chen and K. Amine, Adv. Mater., 2018, 30, 1800561 CrossRef PubMed.
- M. Miroshnikov, K. Kato, G. Babu, N. K. Thangavel, K. Mahankali, E. Hohenstein, H. Wang, S. Satapathy, K. P. Divya, H. Asare, P. M. Ajayan, L. M. R. Arava and G. John, ACS Sustainable Chem. Eng., 2019, 7, 13836–13844 CrossRef CAS.
- F. Wu, J. Maier and Y. Yu, Chem. Soc. Rev., 2020, 49, 1569–1614 RSC.
- T. Hosaka, K. Kubota, A. Hameed and S. Komaba, Chem. Rev., 2020, 120, 6358–6466 CrossRef CAS PubMed.
- Q. Yao and C. Zhu, Adv. Funct. Mater., 2020, 30, 2005209 CrossRef CAS.
- R. Rajagopalan, Y. Tang, X. Ji, C. Jia and H. Wang, Adv. Funct. Mater., 2020, 30, 1909486 CrossRef CAS.
- X. Wang, J. Zhao, D. Yao, Y. Xu, P. P. Xu, Y. Chen, Y. Chen, K. Zhu, K. Cheng, K. Ye, J. Yan, D. Cao and G. Wang, J. Electroanal. Chem., 2020, 871, 114272 CrossRef CAS.
- M. Yang, J. Dai, M. He, T. Duan and W. Yao, J. Colloid Interface Sci., 2020, 567, 256–263 CrossRef CAS PubMed.
- K. Lei, J. Wang, C. Chen, S. Li, S. Wang, S. Zheng and F. Li, Rare Met., 2020, 39, 989–1004 CrossRef CAS.
- S. Wang, P. Xiong, X. Guo, J. Zhang, X. Gao, F. Zhang, X. Tang, P. Notten and G. Wang, Adv. Funct. Mater., 2020, 30, 2001588 CrossRef CAS.
- N. Wang, C. Chu, X. Xu, Y. Du, J. Yang, Z. Bai and S. Dou, Adv. Energy Mater., 2018, 8, 1801888 CrossRef.
- Y. Sun, Y. Zhang, Z. Xing, D. Wei, Z. Ju and Q. Zhuang, Sustainable Energy Fuels, 2020, 3, 1216–1244 RSC.
- H. Wang, Y. Shao, S. Mei, Y. Lu, M. Zhang, J. Sun, K. Matyjaszewski, M. Antonietti and J. Yuan, Chem. Rev., 2020, 120, 9363–9419 CrossRef CAS PubMed.
- H. Wang, A. Artemova, G. Yang, H. Wang, L. Zhang, X. Cao, E. Arkhipova, J. Liu, Y. Huang, J. Lin and Z. Shen, J. Power Sources, 2020, 466, 228303 CrossRef CAS.
- P. Xiong, X. Zhao and Y. Xu, ChemSusChem, 2018, 11, 202–206 CrossRef CAS PubMed.
- L. Tao, L. Liu, R. Chang, H. He, P. Zhao and J. Liu, J. Power Sources, 2020, 463, 228172 CrossRef CAS.
- Z. Wu, L. Wang, J. Huang, J. Zou, S. Chen, H. Cheng, C. Jiang, P. Gao and X. Niu, Electrochim. Acta, 2019, 306, 446–453 CrossRef CAS.
- L. Zhou, Z. Zhang, H. Zhang, Y. Wang, J. Luo, J. Yu, Y. Qu and Z. Yang, Sci. China: Technol. Sci., 2021, 64, 2047–2056 CrossRef.
- C. Gao, Q. Wang, S. Luo, Z. Wang, Y. Zhang, Y. Liu, A. Hao and R. Guo, J. Power Sources, 2019, 415, 165–171 CrossRef CAS.
- S. E. Kim, A. Memon, B. Y. Kim, H. Jeon, W. K. Lee and S. K. Kang, Sci. Rep., 2020, 10, 9547–9556 CrossRef PubMed.
- C. Xin, Y. Zhang, M. Zhao, Z. Wang and C. Cheng, Arabian J. Chem., 2021, 14, 103069 CrossRef CAS.
- Q. Liu, F. Han, J. Zhou, Y. Li, L. Chen, F. Zhang, D. Zhou, C. Ye, J. Yang, X. Wu and J. Liu, ACS Appl. Mater. Interfaces, 2020, 12, 20838–20848 CrossRef CAS PubMed.
- J. Ma, Y. Li, X. Wei, Z. Li, G. Li, T. Liu, Y. Zhao, S. He, Y. Li, R. Li, C. Gu, J. Li, H. Luo, Q. Wang, K. Li and C. Liu, Chem. Eng. J., 2020, 433, 133777 CrossRef.
- X. Liu, C. Yu, Z. Chen, F. Xu, W. Liao and W. Zhong, Energy Fuels, 2021, 35, 19801–19810 CrossRef CAS.
- W. Zhang, M. Sun, J. Yin, K. Lu, U. Schwingenschlögl, X. Qiu and H. N. Alshareef, Adv. Energy Mater., 2021, 11, 2101928 CrossRef CAS.
- Y. Wang, H. Xuan, G. Lin, F. Wang, Z. Chen and X. Dong, J. Power Sources, 2016, 319, 262–270 CrossRef CAS.
- J. Ruan, X. Wu, Y. Wang, S. Zheng, D. Sun, Y. Song and M. Chen, J. Mater. Chem. A, 2019, 7, 19305–19315 RSC.
- C. Gao, Q. Wang, S. Luo, Z. Wang, Y. Zhang, Y. Liu, A. Hao and R. Guo, J. Power Sources, 2019, 415, 165–171 CrossRef CAS.
- Y. Liu, C. Yang, Q. Pan, Y. Li, G. Wang, X. Ou, F. Zheng, X. Xiong, M. Liu and Q. Zhang, J. Mater. Chem. A, 2018, 6, 15162–15169 RSC.
- Y. Zhang, R. Zhao, Y. Li, X. Zhu, B. Zhang, X. Lang, L. Zhao, B. Jin, Y. Zhu and Q. Jiang, J. Power Sources, 2021, 481, 228644 CrossRef CAS.
- G. Y. Zhong, S. Xu, J. Chao, X. Fu, W. Liao, Y. Xu, Z. Liu and Y. Cao, Ind. Eng. Chem. Res., 2020, 59, 21756–21767 CrossRef CAS.
- Y. Lin, Z. Chen, C. Yu and W. Zhong, Electrochim. Acta, 2020, 334, 135615 CrossRef CAS.
- M. Yahya, Z. Al-Qodah and C. Ngah, Renewable Sustainable Energy Rev., 2015, 46, 218–235 CrossRef CAS.
- J. Donald, Y. Ohtsuka and C. Xu, Mater. Lett., 2011, 65, 744–747 CrossRef CAS.
- X. Li, B. Guan, S. Gao and X. Lou, Energy Environ. Sci., 2019, 12, 648–655 RSC.
- J. Xu, Y. Li, S. Peng, G. Lu and S. Li, Phys. Chem. Chem. Phys., 2013, 15, 7657–7665 RSC.
- P. M. Schaber, J. Colson, S. Higgins, D. Thielen, B. Anspach and J. Brauer, Thermochim. Acta, 2004, 424, 131–142 CrossRef CAS.
- M. Zhong, H. Liu, M. Wang, Y. Zhu, X. Chen and Z. Zhang, J. Power Sources, 2019, 438, 226982 CrossRef CAS.
- Q. Deng, H. Liu, Y. Zhou, Z. Luo, Y. Wang, Z. Zhao and R. Yang, J. Electroanal. Chem., 2021, 899, 115668 CrossRef CAS.
- M. Yang, Q. Kong, W. Feng and W. Yao, Carbon, 2021, 176, 71–82 CrossRef CAS.
- X. Yuan, B. Zhu, J. Feng, C. Wang, X. Cai and R. Qin, Mater. Res. Bull., 2021, 139, 111282 CrossRef CAS.
- X. Lin, Y. Liu, H. Tan and B. Zhang, Carbon, 2020, 157, 316–323 CrossRef CAS.
- D. Zhang, Z. Chen, J. Bai, C. Yang and Q. Jiang, Batteries Supercaps, 2020, 3, 185–193 CrossRef CAS.
- J. Cao, J. Zhong, H. Xu, S. Li, H. Deng, T. Wang, L. Fan, X. Wang, L. Wang, J. Zhu, B. Lu and X. Duan, Nano Res., 2021, 15, 2040–2046 CrossRef.
- W. Zhang, Y. Yan, Z. Xie, Y. Yang, Y. Xiao, M. Zheng, H. Hu, H. Dong, Y. Liu and Y. Liang, J. Colloid Interface Sci., 2019, 561, 195–202 CrossRef PubMed.
- W. Zhao, Y. Shen, H. Zhang, Y. Wang, Y. Wu, H. Wu, M. Zou, Q. Wang, Y. Li and A. Cao, ACS Appl. Mater. Interfaces, 2020, 12, 27045–27054 CrossRef CAS PubMed.
- X. Liu, Nanoscale Adv., 2016, 1, 90–103 Search PubMed.
- X. Liu, N. Fechler and M. Antonietti, Chem. Soc. Rev., 2013, 42, 8237–8265 RSC.
- T. Ouyang, K. Cheng, F. Yang, L. Zhou, K. Zhu, K. Ye, G. Wang and D. Cao, J. Mater. Chem. A, 2017, 28, 14551–14561 RSC.
- M. Liu, D. Jing, Y. Shi and Q. Zhuang, J. Mater. Sci.: Mater. Electron., 2019, 30, 8911–8919 CrossRef CAS.
- R. Cui, B. Xu, H. Dong, C. Yang and Q. Jiang, Adv. Sci., 2020, 7, 1902547 CrossRef CAS PubMed.
- C. Liu, N. Xiao, H. Li, Q. Dong, Y. Wang, H. Li, S. Wang, X. Zhang and J. Qiu, Chem. Eng. J., 2020, 382, 121759 CrossRef CAS.
- Y. Qin, J. Lu, X. Zhao, X. Lin, Y. Hao, P. Huo, M. Meng and Y. Yan, Chem. Eng. J., 2021, 425, 131844 CrossRef CAS.
- W. Zhang, J. Ming, W. Zhao, X. Dong, M. N. Hedhili, P. M. F. J. Costa and H. N. Alshareef, Adv. Funct. Mater., 2019, 1903641 CrossRef.
- R. C. Barklie, Diamond Relat. Mater., 2001, 10, 174–181 CrossRef CAS.
- J. Li, Y. Li, X. Ma, K. Zhang, J. Hu, C. Yang and M. Liu, Chem. Eng. J., 2019, 384, 123328 CrossRef.
- H. Li, Z. Cheng, Q. Zhang, A. Natan, Y. Yang, D. Cao and H. Zhu, Nano Lett., 2018, 18, 7407–7413 CrossRef CAS PubMed.
- B. Deng, Q. Huang, W. Zhang, J. Liu, Q. Meng, Z. Zhu, W. Zhong, X. Li and Y. Zhang, J. Cleaner Prod., 2021, 309, 127391 CrossRef CAS.
- W. Cao, E. Zhang, J. Wang, Z. Liu, J. Ge, X. Yu, H. Yang and B. Lu, Electrochim. Acta, 2019, 293, 364–370 CrossRef CAS.
- S. Zhang, Z. Xu, H. Duan, A. Xu, Q. Xia, Y. Yan and S. Wu, Electrochim. Acta, 2020, 337, 135767 CrossRef CAS.
- Y. Xie, Y. Chen, L. Liu, P. Tao, M. Fan, N. Xu, X. Shen and C. Yan, Adv. Mater., 2017, 29, 1702268 CrossRef PubMed.
- J. Wang, D. Wang, K. Dong, A. Hao, S. Luo, Y. Liu, Q. Wang, Y. Zhang and Z. Wang, ChemElectroChem, 2019, 6, 3699–3704 CrossRef CAS.
- S. Li, J. Qiu, C. Lai, M. Ling, H. Zhao and S. Zhang, Nano Energy, 2015, 12, 224–230 CrossRef CAS.
- G. Xia, C. Wang, P. Jiang, J. Lu, J. Diao and Q. Chen, J. Mater. Chem. A, 2019, 7, 12317–12324 RSC.
- X. Wu, Y. Chen, Z. Xing, C. W. K. Lam, S. Pang, W. Zhang and Z. Ju, Adv. Energy Mater., 2019, 9, 1900343 CrossRef.
- X. Yang, R. Zhang, J. Zhao, Z. Wei, D. Wang, X. Bie, Y. Gao, J. Wang, F. Du and G. Chen, Adv. Energy Mater., 2017, 1701827 Search PubMed.
- R. Zhang, X. Yang, S. Xu, D. Xua and F. Du, Phys. Chem. Chem. Phys., 2019, 21, 25940–25944 RSC.
- X. Lian, Z. Sun, Q. Mei, Y. Yi, J. Zhou, M. H. Rümmeli and J. Sun, Energy Environ. Sci., 2021, 5, 344–352 Search PubMed.
- Y. He, J. Xue, M. Yang, T. Huang, X. Xia, Y. Chen and H. Liu, Chem. Eng. J., 2021, 409, 127383 CrossRef CAS.
- M. Zhang, M. Shoaib, H. Fei, T. Wang, J. Zhong, L. Fan, L. Wang, H. Luo, S. Tan, Y. Wang, J. Zhu, J. Hu and B. Lu, Adv. Energy Mater., 2019, 9, 1901663 CrossRef CAS.
- K. Kubota, S. Shimadzu, N. Yabuuchi, S. Tominaka, S. Shiraishi, M. Abreu-Sepulveda, A. Manivannan, K. Gotoh, M. Fukunishi, M. Dahbi and S. Komaba, Chem. Mater., 2020, 32, 2961–2977 CrossRef CAS.
- W. Wang, J. Zhou, Z. Wang, L. Zhao, P. Li, Y. Yang, C. Yang, H. Huang and S. Guo, Adv. Energy Mater., 2018, 8, 1701648 CrossRef.
Footnote |
| † Electronic supplementary information (ESI) available. See https://doi.org/10.1039/d2ra03205h |
| This journal is © The Royal Society of Chemistry 2022 |

