 Open Access Article
Facile preparation of 3D porous agar-based heteroatom-doped carbon aerogels for high-energy density supercapacitors†
Kaijun Xie‡
,
Kai Xia‡,
Xin Ding *,
Long Fang,
Xin Liu and
Xiaodong Zhang
 *
*
College of Chemistry and Chemical Engineering, Qingdao University, Qingdao 266071, China. E-mail: dingxin@qdu.edu.cn; zhangxdqd@hotmail.com
First published on 21st July 2022
Abstract
The fabrication of heteroatom-doped porous carbon materials with high electrical conductivity and large specific surface area via an environmentally friendly route is critical and challenging. Herein, nitrogen and oxygen co-doped agar porous carbon (APC) was developed for supercapacitors via a one-step carbonization method with agar as the raw material and ammonia as the activator and nitrogen source. APC outperformed pectin porous carbon, tamarind porous carbon, and the previously reported carbon-based supercapacitors with a high capacitance retention of 72% even from 0.5 A g−1 to 20 A g−1 and excellent cycling stability in 6 M KOH solution (retained after 10![[thin space (1/6-em)]](https://www.rsc.org/images/entities/char_2009.gif) 000 cycles) with a rate of over 98.5%. Furthermore, the APC electrode-based symmetric device exhibited an impressive energy density of 20.4 W h kg−1 and an ultra-high power density of 449 W kg−1 in 1 M Na2SO4 electrolyte together with excellent cycling stability (103.2% primary capacitance retentivity after 10
000 cycles) with a rate of over 98.5%. Furthermore, the APC electrode-based symmetric device exhibited an impressive energy density of 20.4 W h kg−1 and an ultra-high power density of 449 W kg−1 in 1 M Na2SO4 electrolyte together with excellent cycling stability (103.2% primary capacitance retentivity after 10![[thin space (1/6-em)]](https://www.rsc.org/images/entities/char_2009.gif) 000 cycles). This study offers a novel method for the synthesis of nitrogen heteroatom-doped hierarchical porous carbon materials for performance-enhanced energy storage devices.
000 cycles). This study offers a novel method for the synthesis of nitrogen heteroatom-doped hierarchical porous carbon materials for performance-enhanced energy storage devices.
1. Introduction
The excessive utilization of fossil fuels has greatly promoted rapid industrial development, while also causing environmental pollution, ecological damage, and greenhouse effect, which seriously threaten human survival and development.1,2 New alternative energy sources, such as solar energy, wind energy, tidal energy, hydrogen energy, and geothermal energy, have been developed and attract great attention.3–5 However, due to natural conditions, these intermittent energies cannot supply a stable and continuous energy supply.6 Thus, to solve the inherent discontinuity issue, supercapacitors, featuring fast charge and discharge, high power density, long cycle life, stable rate performance, excellent low-temperature performance, and environmental friendliness, are considered perfect candidates.7–9Supercapacitors use reversible electrosorption to store the electrical energy of charged species at the carbon–electrolyte interface, enabling fast energy harvesting/transfer within seconds and potential operating lifetimes surpassing one million cycles.10–13 To achieve high energy density, porous electrodes with a large specific surface area are required.14 Particularly, microporous carbons with pores smaller than 2 nm have demonstrated exceptional capacitive energy storage capabilities.15–18 In recent years, coal, pitch, polysaccharides, carbon aerogels, etc. have been studied as potential electrode materials. Among them, polysaccharides can be obtained from a wide range of sources at low prices, showing tremendous practical applications.19–21 Their phase and pores can be adjusted by tuning temperature and concentration, and activators can also be employed to change the type of pores to obtain optimized electrical properties.19–28 Generally, KOH, ZnCl2, and CaCl2 are used as activators to obtain larger specific surface area;29 however, they also result in unavoidable equipment corrosion and environmental pollution. Additionally, due to their high oxygen content and poor electrochemical performance,30 the energy storage performance of supercapacitors is usually poor.30,31 Therefore, an effective and environmentally friendly pathway is necessary to change their structures.32,33 Ammonia treatment technology accomplishes this goal in one step, where nitrogen creates abundant pores to achieve larger specific surface area and replace partial oxygen atoms in agar for higher electrical conductivity.34 Additionally, oxygen and nitrogen functional groups not only improve wettability, but also provide additional false capacitance during the charge and discharge process.35
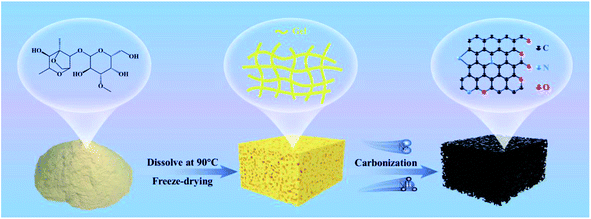
Herein, an agar porous carbon (APC) aerogel was prepared via freeze-drying and then high-temperature carbonization pathway as shown in Scheme 1. Moreover, pectin porous carbon (PPC) aerogel and tamarind porous carbon (TPC) aerogels were also synthesized using the same approach.35–37 A layered porous structure conducive to ion/electron transport and charge storage was obtained, resulting in a higher specific capacitance, rate performance and cycle stability. An ultra-high specific capacity of 272 F g−1 at a current density of 0.5 A g−1 was obtained. Moreover, even in 6 M KOH electrolyte, at the current density of 10 A g−1, a capacity of 210 F g−1 was retained, which is superior to that of PPC, TPC and nearly all reported carbon-based supercapacitors. The capacity retention rate after 10![[thin space (1/6-em)]](https://www.rsc.org/images/entities/char_2009.gif) 000 cycles was as high as 98.5%. In addition, symmetrical APC//APC supercapacitors showed a wide voltage window of 1.8 V, high energy density of 20.4 W h kg−1, and a power density of 449 W K g−1, as well as good cycle stability (103.2% retention after 10
000 cycles was as high as 98.5%. In addition, symmetrical APC//APC supercapacitors showed a wide voltage window of 1.8 V, high energy density of 20.4 W h kg−1, and a power density of 449 W K g−1, as well as good cycle stability (103.2% retention after 10![[thin space (1/6-em)]](https://www.rsc.org/images/entities/char_2009.gif) 000 cycles, in 1 M Na2SO4 aqueous electrolyte).
000 cycles, in 1 M Na2SO4 aqueous electrolyte).
2. Results and discussion
Scanning electron microscopy (SEM) and high-resolution transmission electron microscopy (HRTEM) were employed to further study the morphology of APC. As seen in SEM images in Fig. 1A–C, APC is a 3D porous structure with multiple voids and rough surfaces, which can facilitate the NH3 activation process. In addition, macropores and mesopores in carbons emerge from the phase separation between the hydrophobic carbon and water during pyrolysis. TPC and PPC (Fig. S1 and S2,† respectively) have similar shapes, which not only offer channels for good electrolyte contact, but also speed up the charge transfer by reducing diffusion paths.54 The presence of micropores (Fig. 1D) was also confirmed by HRTEM. Additionally, the conductive (yellow dotted line region) and unevenly shaped layered edges (blue dotted line area) also confirm the three-dimensional porous structure. The (002) and (101) crystal planes of carbon were assigned to two separate diffraction rings in the selected-area electron diffraction pattern, respectively. The elemental mapping pictures (Fig. 1G) demonstrate that C, O, and N were uniformly dispersed on APC, further confirming the doping of N atoms.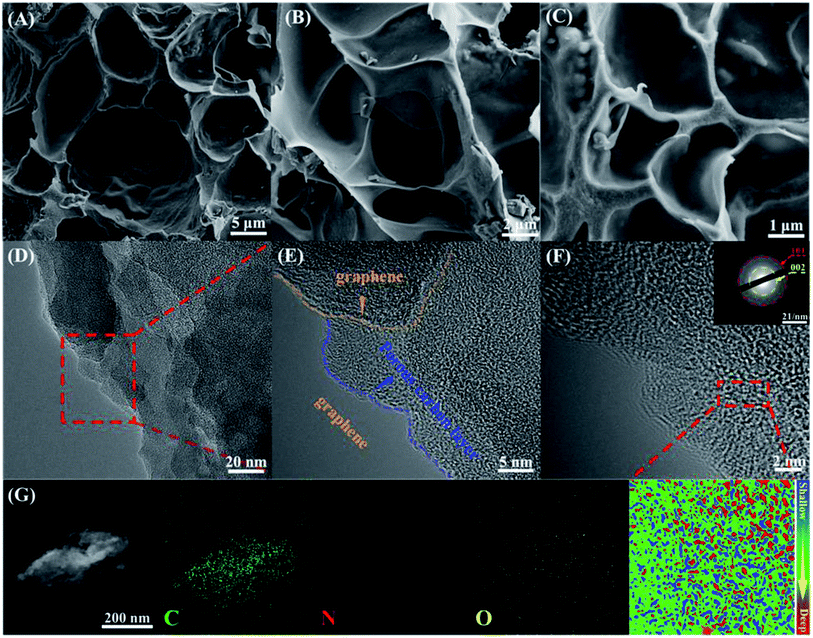 | ||
| Fig. 1 (A)–(C) SEM images of APC. (D)–(F) HR-TEM images of APC. (G) EDS elemental mapping images of C, N, and O in APC, respectively. | ||
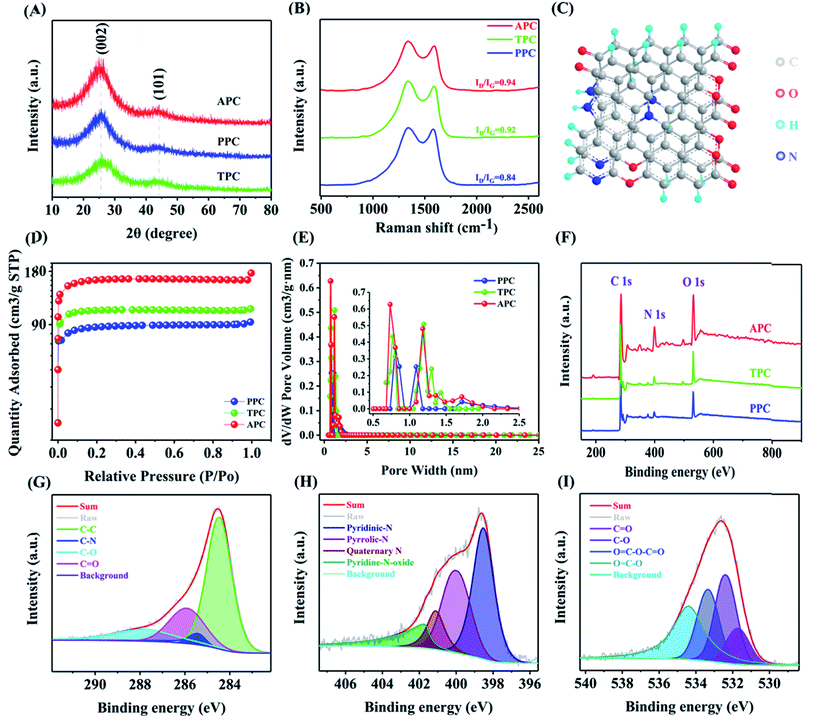
X-ray diffraction spectroscopy was used to investigate the crystal structure of the samples (Fig. 2A). The (002) and (101) carbon planes correspond to the peaks at 24° and 44°. The intensity of the peak ascribed to the (002) plane is weaker than that for PPC and TPC due to the existence of bigger pores and less graphitization. The XRD data show that during the chemical activation process, nano-graphitic structures emerged, which is consistent with HR-TEM results. The structural characteristics were investigated using Raman spectroscopy. As shown in Fig. 2B, the D peak and G peak can be observed, corresponding to the structural defects in the graphitic structure and the in-plane vibration of the graphitic lattice. After high temperature pyrolysis, the ID/IG value increased from 0.84 to 0.94, revealing the existence of more defects and disordered structures in PC materials. This phenomenon is attributed to the decrease in the average size of sp2 domains and the introduction of abundant nitrogen functional groups during the unzipping process.55,56 After low-temperature reduction, the ID/IG value decreased to 0.92 for TPC due to the removal of unstable nitrogen functional groups. Based on the above-mentioned results, we proposed the molecular model of APC, as shown in Fig. 2C. It is anticipated that this self-supporting electrode material with a distinctive 3D structure would exhibit noticeably improved electrochemical characteristics when used in aqueous SCs.
Subsequently, N2 adsorption measurements were performed to further explore the pore structure of the samples. The Barrett–Emmett–Teller (BET) method was used to determine the surface area and the Barrett–Joyner–Halenda (BJH) approach for the pore size distribution, as shown in Fig. 2D and E and Table 1S.† Type I adsorption–desorption isotherms were observed for PPC (Fig. S3†) and TPC (Fig. S4†) samples. Alternatively, the adsorption–desorption isotherms of the APC (Fig. S5†) material display a combination of type I and type IV isotherm characteristics, suggesting the creation of microporous and mesoporous structures, respectively. APC has a specific surface area of 513.33 m2 g−1, which is higher than that of PPC (278.23 m2 g−1) and TPC (342.07 m2 g−1), owing to their structural differences. Moreover, the specific surface area without NH3 treatment was only 216 m2 g−1 (Fig. S7† and Table 1S†). In the production of carbon compounds, NH3 is considered an effective porogen. The pore size distribution of APC is narrow, with the major pore size in the range of 0.5 to 2.1 nm. The abundant micropores were beneficial for the quick transport and interpenetration of electrolyte ions, reduced ion diffusion resistance, and increased area of the material.57,58
The chemical composition and binding state of APC were investigated using X-ray photoelectron spectroscopy (Fig. 2F–I). The distinct peaks at 286 eV, 401 eV, and 533 eV, as shown in Fig. 2F, are ascribed to C 1s, N 1s, and O 1s, respectively. The contents of each element in the samples are summarized in Table 2S.† The high-resolution C 1s (Fig. 2G) spectra of APC exhibit peaks corresponding to C–C (285.46 eV), C–N (285.44 eV), C![[double bond, length as m-dash]](https://www.rsc.org/images/entities/char_e001.gif) O (287.10 eV), and C–O (288.01 eV), while four peaks corresponding to N-6 (398.54 eV), N-5 (400.03 eV), N–O (401.79 eV), and N–Q (401.14 eV) appeared in the high-resolution N1s spectrum (Fig. 2H). Through redox processes, N-6 (pyridine-N) and N-5 (pyrrole-N) can not only offer function groups but also boost the conductivity and wettability of carbon materials. Pyrrole nitrogen appears as a π–π* shake-up satellite peak. The O 1s spectrum (Fig. 2I) could be fitted into four peaks centered at C
O (287.10 eV), and C–O (288.01 eV), while four peaks corresponding to N-6 (398.54 eV), N-5 (400.03 eV), N–O (401.79 eV), and N–Q (401.14 eV) appeared in the high-resolution N1s spectrum (Fig. 2H). Through redox processes, N-6 (pyridine-N) and N-5 (pyrrole-N) can not only offer function groups but also boost the conductivity and wettability of carbon materials. Pyrrole nitrogen appears as a π–π* shake-up satellite peak. The O 1s spectrum (Fig. 2I) could be fitted into four peaks centered at C![[double bond, length as m-dash]](https://www.rsc.org/images/entities/char_e001.gif) O (531.67 eV), C–O (532.42 eV), O
O (531.67 eV), C–O (532.42 eV), O![[double bond, length as m-dash]](https://www.rsc.org/images/entities/char_e001.gif) C–O–C
C–O–C![[double bond, length as m-dash]](https://www.rsc.org/images/entities/char_e001.gif) O (533.37 eV), and O
O (533.37 eV), and O![[double bond, length as m-dash]](https://www.rsc.org/images/entities/char_e001.gif) C–O (534.43 eV). Thus, based on these findings, it can be concluded that the as-prepared APC has a large specific surface area and hierarchical porous carbon, which can greatly boost the performance of supercapacitors (TPC and PPC, as shown in Fig. S8 and S9,† respectively).
C–O (534.43 eV). Thus, based on these findings, it can be concluded that the as-prepared APC has a large specific surface area and hierarchical porous carbon, which can greatly boost the performance of supercapacitors (TPC and PPC, as shown in Fig. S8 and S9,† respectively).
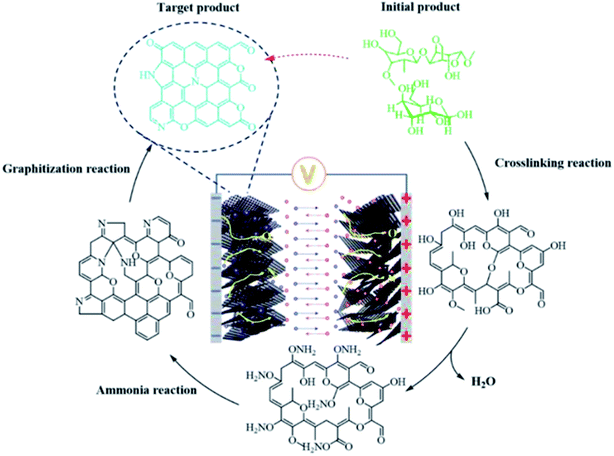
The schematic illustration of the carbonization mechanism of agar (Fig. 3) is based on aforementioned characterization, where numerous agar molecules undergo a cross-linking process when the temperature increases and ammonia gas is introduced, removing water molecules and some of the hydroxyl groups and ammonia gas.59 Subsequently, the ammonia reaction takes place. As the temperature increases, the broken long-chain free radicals agglomerate. Finally, a conductive graphene compound containing nitrogen is created. APCs have a high specific capacitance and outstanding electrochemical cycling performance because of their unique pore structure, numerous pseudocapacitive active species, and good electron/ion transport characteristics.60–63
To assess the supercapacitor performance of the produced agar porous carbon materials, equivalent electrochemical measurements were performed in a 6 M KOH solution. APC has bigger cyclic voltammetry (CV) curve regions than those of PPC and TPC, suggesting a higher specific capacitance, as illustrated in Fig. 4A.38–40 The pseudocapacitance of electrode materials is obtained from the reversible oxidation–reduction reaction of nitrogen and oxygen functional groups on their surface. The reaction equation can be expressed as follows:
 | (1) |
 | (2) |
 | (3) |
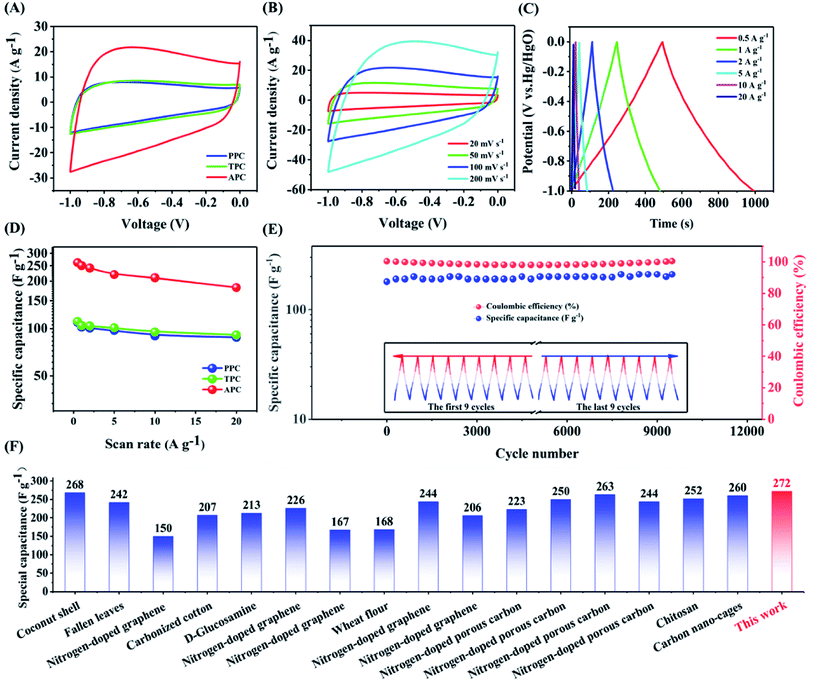 | ||
Fig. 4 (A) CV curves of PPC, TPC and APC electrodes at a scan rate of 100 mV s−1. (B) CV curves of APC at different scan rates of 20, 50, 100, and 200 mV s−1 in 6.0 M KOH aqueous solution. (C) Galvanostatic charge/discharge curves of APC at various current densities. (D) Specific capacitances of PPC, TPC, and APC at different current densities. (E) Electrochemical stability of APC for 10![[thin space (1/6-em)]](https://www.rsc.org/images/entities/char_2009.gif) 000 cycles tested at 200 mV s−1. (F) Comparison of the specific capacitance of APC with that of other sugars (Table 4S†). 000 cycles tested at 200 mV s−1. (F) Comparison of the specific capacitance of APC with that of other sugars (Table 4S†). | ||
Furthermore, the CV curve of APC exhibits a rectangle-like form at 100 mV s−1 (Fig. 4B), demonstrating its strong rate capacity. The galvanized charge–discharge curves of APC exhibit a somewhat distorted triangular form (Fig. 4C), showing that capacitance is a combination of electric double-layer and pseudocapacitance. The specific capacitance of APC, which was derived from the constant-current discharge curve (Fig. 4D) is 272 F g−1 at 0.5 A g−1 and much greater than that of PPC (216 F g−1) and TPC (219 F g−1). The APC electrode provided a specific capacitance of 196 F g−1 even at 20 A g−1. Furthermore, compared to other samples with varying precursor to KOH ratios (Fig. S10 and S11†) and other previously reported porous carbon composites, APC has a greater specific capacitance (Fig. 4F and Table 4S†). The equivalent series resistance of APC (0.64 Ω) is lower than that of TPC (0.65 Ω) and PPC (0.67 Ω), showing superior conductivity, according to the Nyquist diagram (Fig. S12†). Furthermore, the surface charge transfer resistance of the APC electrode is lower than that of other samples and its charge transfer speed is quicker. Galvanostatic charge/discharge (GCD) measurements at 25 A g−1 were also performed to assess the cycle stability of APC (Fig. 4E). After 10![[thin space (1/6-em)]](https://www.rsc.org/images/entities/char_2009.gif) 000 cycles, the specific capacity of APC retained 98.5% of its initial capacity, demonstrating exceptional electrochemical stability.
000 cycles, the specific capacity of APC retained 98.5% of its initial capacity, demonstrating exceptional electrochemical stability.
Two-electrode symmetric supercapacitors were built and tested in 1 M Na2SO4 aqueous solution to further highlight the superior electrochemical capability of APC electrodes.41–43 The CV curves of the APC//APC symmetric supercapacitors were recorded in different voltage windows at 50 mV s−1, as shown in Fig. 5A. Even at 1.8 V, the anode current did not significantly increase, demonstrating that this superstar may be cycled reversibly within a voltage window of 0–1.8 V. The symmetric superstar galvanized charge–discharge curves exhibit a slightly distorted triangular form (Fig. 5B). Moreover, the CV curves of APC//APC symmetric supercapacitors were further explored at various scan rates (Fig. 5C). The CV curve was rectangular even at 200 mV s−1, showing an excellent rate capability. At 2 mV s−1, the APC//APC symmetric supercapacitor exhibited a specific capacity of 49.6 F g−1. The specific capacitance of the symmetric superstar was also determined, as shown in Fig. 5D. Fig. 5E also shows the Ragone plot of the APC//APC symmetric superstar, which achieved a high energy density of 20.4 W h kg−1 and a power energy of 449 W K g−1, exceeding that of nearly all previously reported carbon-based symmetric supercapacitors (Table 3S†). After 10![[thin space (1/6-em)]](https://www.rsc.org/images/entities/char_2009.gif) 000 cycles, the APC//APC symmetric supercapacitor retained 103% of its initial capacity (Fig. 5F), demonstrating its good electrochemical stability. The holes in the APC material conductive paste enlarged as it became worn (Fig. S13†), allowing electrolyte ions to enter the graphene layer and store more charges. It is worth noting that three APC//APC symmetrical supercapacitor devices linked in series could light up blue commercial light-emitting diodes (LEDs), demonstrating that these electrodes have a real application value.
000 cycles, the APC//APC symmetric supercapacitor retained 103% of its initial capacity (Fig. 5F), demonstrating its good electrochemical stability. The holes in the APC material conductive paste enlarged as it became worn (Fig. S13†), allowing electrolyte ions to enter the graphene layer and store more charges. It is worth noting that three APC//APC symmetrical supercapacitor devices linked in series could light up blue commercial light-emitting diodes (LEDs), demonstrating that these electrodes have a real application value.
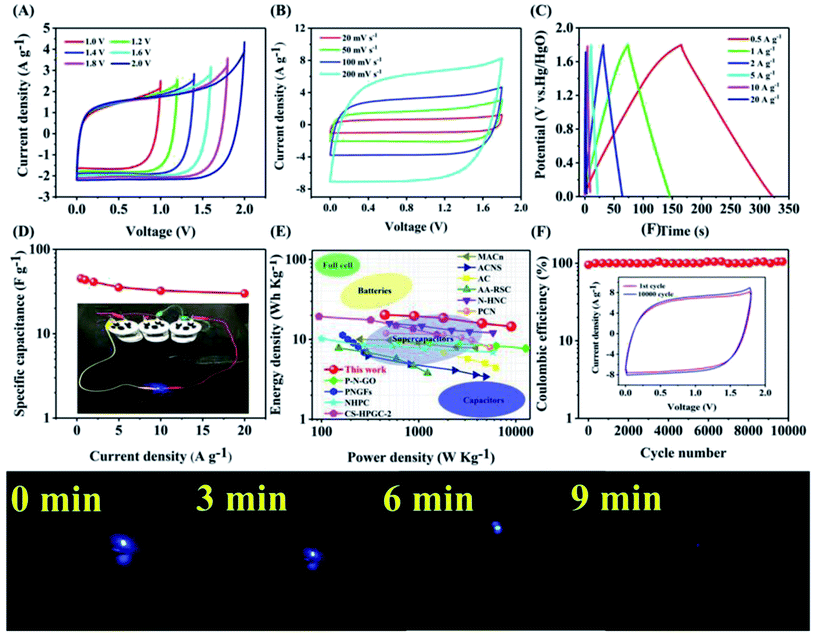 | ||
Fig. 5 (A) CV curves of the APC//APC symmetrical supercapacitor at different operation voltages at the scan rate of 50 mV s−1. (B) GCD curves of the APC//APC symmetric supercapacitor at various current densities. (C) CV curves of the APC//APC symmetrical supercapacitor at different scan rates in the voltage window of 0–1.8 V. (D) Specific capacitance of the APC symmetric supercapacitor at various scan rates. (E) Ragone plot of the APC symmetric supercapacitor.44–53 (F) Electrochemical stability of the APC symmetric supercapacitor in the 10![[thin space (1/6-em)]](https://www.rsc.org/images/entities/char_2009.gif) 000 cycle test. 000 cycle test. | ||
3. Conclusion
In conclusion, utilizing agar as a raw material, one-step carbonization produced a multilayer porous carbon material with narrow pore size distribution and co-doped nitrogen and oxygen. The electrode material possessed micropores, layered structure, and rich nitrogen–oxygen functional groups, which exhibit an outstanding specific capacitance, good rate characteristics, and ultra-long electrochemical stability. The created symmetric supercapacitors also exhibited high energy density and good electrochemical stability. At a current density of 0.5 A g−1, the ultra-high specific capacity of 272 F g−1 was achieved. At the current density of 10 A g−1, a capacity of 210 F g−1 was retained even in 6 M KOH electrolyte, outperforming almost all reported carbon-based supercapacitors. Moreover, after 10![[thin space (1/6-em)]](https://www.rsc.org/images/entities/char_2009.gif) 000 cycles, 98.5% capacity was retained. Furthermore, the symmetric APC//APC superstar had a wide voltage window of 1.8 V, high energy density of 20.4 W h kg−1 and power density of 449 W Kg−1, and good cycling stability (103.2% retention rate for 10
000 cycles, 98.5% capacity was retained. Furthermore, the symmetric APC//APC superstar had a wide voltage window of 1.8 V, high energy density of 20.4 W h kg−1 and power density of 449 W Kg−1, and good cycling stability (103.2% retention rate for 10![[thin space (1/6-em)]](https://www.rsc.org/images/entities/char_2009.gif) 000 cycles in 1 M Na2SO4 aqueous electrolyte). Thus, we presented a new and cost-effective method for the synthesis of hierarchical porous carbon composites with abundant low-cost polysaccharides for improved energy storage.
000 cycles in 1 M Na2SO4 aqueous electrolyte). Thus, we presented a new and cost-effective method for the synthesis of hierarchical porous carbon composites with abundant low-cost polysaccharides for improved energy storage.
Conflicts of interest
The authors declare no competing financial interests.Acknowledgements
This work was financially supported by the Major Science and Technology Innovation Project of Shandong (No. 2019JZZY010507), the Qingdao Municipal Science and Technology Bureau (No. 17-1-1-86-jch), the Key Technology Research and Development Program of Shandong (No. 2018GGX108005), the China Postdoctoral Science Foundation (No. 2019T120571; No. 2018M632623), Qingdao Postdoctoral Foundation (RZ2000003344).References
- G. Wang, Z. Lu, Y. Li, L. Li, H. Ji, A. Feteira, D. Zhou, D. Wang, S. Zhang and I. M. Reaney, Chem. Rev., 2021, 121(10), 6124–6172 CrossRef CAS PubMed.
- H. Peng, B. Yao, X. Wei, T. Liu, T. Kou, P. Xiao, Y. Zhang and Y. Li, Adv. Energy Mater., 2019, 9(19), 1803665 CrossRef.
- B. Kang and G. Ceder, Nature, 2009, 458(7235), 190–193 CrossRef CAS PubMed.
- M. Salanne, B. Rotenberg, K. Naoi, K. Kaneko, P. L. Taberna, C. P. Grey, B. Dunn and P. Simon, Nat. Energy, 2016, 1, 16070 CrossRef CAS.
- Z. Li, S. Gadipelli, H. Li, C. A. Howard, D. J. L. Brett, P. R. Shearing, Z. Guo, I. P. Parkin and F. Li, Nat. Energy, 2020, 5(2), 160–168 CrossRef CAS.
- Y. Zhu, S. Murali, M. D. Stoller, K. J. Ganesh, W. Cai, P. J. Ferreira, A. Pirkle, R. M. Wallace, K. A. Cychosz, M. Thommes, D. Su, E. A. Stach and R. S. Ruoff, Science, 2011, 332(6037), 1537–1541 CrossRef CAS PubMed.
- X. Peng, H. Liu, Q. Yin, J. Wu, P. Chen, G. Zhang, G. Liu, C. Wu and Y. Xie, Nat. Commun., 2016, 7, 11782 CrossRef CAS PubMed.
- P. Pachfule, D. Shinde, M. Majumder and Q. Xu, Nat. Chem., 2016, 8(7), 718–724 CrossRef CAS PubMed.
- K. P. Wang, L. F. Huang, N. Eedugurala, S. Zhang, M. A. Sabuj, N. Rai, X. D. Gu, J. D. Azoulay and T. N. Ng, Adv. Energy Mater., 2019, 9(47), 1902806 CrossRef CAS.
- S. Bellani, E. Petroni, A. E. Del Rio Castillo, N. Curreli, B. Martín-García, R. Oropesa-Nuñez, M. Prato and F. Bonaccorso, Adv. Funct. Mater., 2019, 29(14), 1807659 CrossRef.
- A. Halder, M. Ghosh, M. A. Khayum, S. Bera, M. Addicoat, H. S. Sasmal, S. Karak, S. Kurungot and R. Banerjee, J. Am. Chem. Soc., 2018, 140(35), 10941–10945 CrossRef CAS PubMed.
- D. Zhao, C. Chen, Q. Zhang, W. Chen, S. Liu, Q. Wang, Y. Liu, J. Li and H. Yu, Adv. Energy Mater., 2017, 7(18), 1700739 CrossRef.
- J. Zhou, L. Hou, S. Luan, J. Zhu, H. Gou, D. Wang and F. Gao, Small, 2018, 14(36), e1801897 CrossRef PubMed.
- Z. Song, L. Miao, L. Ruhlmann, Y. Lv, D. Zhu, L. Li, L. Gan and M. Liu, Adv. Mater., 2021, e2104148 CrossRef PubMed.
- Y. Duan, Y. Liu, Z. Chen, D. Liu, E. Yu, X. Zhang, H. Fu, J. Fu, J. Zhang and H. Du, Green Chem., 2020, 22(1), 44–53 RSC.
- P. Li, Z. Liu, Q. Li, W. Wu and Q. Liu, Ind. Eng. Chem. Res., 2014, 53(19), 7910–7916 CrossRef CAS.
- W. Li, F. Gao, X. Wang, N. Zhang and M. Ma, Angew. Chem., Int. Ed., 2016, 55(32), 9196–9201 CrossRef CAS PubMed.
- L. Zhang, M. Cong, X. Ding, Y. Jin, F. Xu, Y. Wang, L. Chen and L. Zhang, Angew. Chem., Int. Ed., 2020, 59(27), 10888–10893 CrossRef CAS PubMed.
- A. Bakandritsos, D. D. Chronopoulos, P. Jakubec, M. Pykal, K. Čépe, T. Steriotis, S. Kalytchuk, M. Petr, R. Zbořil and M. Otyepka, Adv. Funct. Mater., 2018, 28(29), 1801111 CrossRef.
- C. Choi, H. J. Sim, G. M. Spinks, X. Lepró, R. H. Baughman and S. J. Kim, Adv. Energy Mater., 2016, 6(5), 1502119 CrossRef.
- H. Jin, J. Li, Y. Yuan, J. Wang, J. Lu and S. Wang, Adv. Energy Mater., 2018, 8(23), 1801007 CrossRef.
- J. Cao, T. Huang, R. Liu, X. Xi and D. Wu, Electrochim. Acta, 2017, 230, 265–270 CrossRef CAS.
- G. Li, S. Wang, J. Zeng and J. Yu, Carbon, 2021, 171, 111–118 CrossRef CAS.
- L. Li, Q. Zhong, N. D. Kim, G. Ruan, Y. Yang, C. Gao, H. Fei, Y. Li, Y. Ji and J. M. Tour, Carbon, 2016, 105, 260–267 CrossRef CAS.
- W. Liu, J. Mei, G. Liu, Q. Kou, T. Yi and S. Xiao, ACS Sustainable Chem. Eng., 2018, 6(9), 11595–11605 CrossRef CAS.
- H. Lu, S. Liu, Y. Zhang, Y. Huang, C. Zhang and T. Liu, ACS Sustainable Chem. Eng., 2019, 7(5), 5240–5248 CrossRef CAS.
- X. Wang, Y. Ding, H. Lu, F. Chen, N. Zhang and M. Ma, Chem. Eng. J., 2018, 347, 754–762 CrossRef CAS.
- J. Wei, L. Zhong, H. Xia, Z. Lv, C. Diao, W. Zhang, X. Li, Y. Du, S. Xi, M. Salanne, X. Chen and S. Li, Adv. Mater., 2021, e2107439 Search PubMed.
- J. Lei, J. Zhou, J. Li, J. Wen, L. Su, T. Duan and W. Zhu, Electrochim. Acta, 2018, 285, 292–300 CrossRef CAS.
- Z. Shang, X. An, H. Zhang, M. Shen, F. Baker, Y. Liu, L. Liu, J. Yang, H. Cao, Q. Xu, H. Liu and Y. Ni, Carbon, 2020, 161, 62–70 CrossRef CAS.
- Y. Wen, T. E. Rufford, X. Chen, N. Li, M. Lyu, L. Dai and L. Wang, Nano Energy, 2017, 38, 368–376 CrossRef CAS.
- X. Wu, L. Jiang, C. Long and Z. Fan, Nano Energy, 2015, 13, 527–536 CrossRef CAS.
- S. Yu, N. Sun, L. Hu, L. Wang, Q. Zhu, Y. Guan and B. Xu, J. Power Sources, 2018, 405, 132–141 CrossRef CAS.
- X. Feng, Y. Bai, L. Zheng, M. Liu, Y. Li, R. Zhao, Y. Li and C. Wu, ACS Appl. Mater. Interfaces, 2021, 13(47), 56285–56295 CrossRef CAS PubMed.
- D. Guo, B. Ding, X. Hu, Y. Wang, F. Han and X. Wu, ACS Sustainable Chem. Eng., 2018, 6(9), 11441–11449 CrossRef CAS.
- Y. Wang, R. Liu, Y. Tian, Z. Sun, Z. Huang, X. Wu and B. Li, Chem. Eng. J., 2020, 384 Search PubMed.
- X. Wei, S. Wan and S. Gao, Nano Energy, 2016, 28, 206–215 CrossRef CAS.
- J. Du, A. Chen, Y. Zhang, S. Zong, H. Wu and L. Liu, J. Mater. Sci. Technol., 2020, 58, 197–204 CrossRef.
- P. Hu, D. Meng, G. Ren, R. Yan and X. Peng, Appl. Mater. Today, 2016, 5, 1–8 CrossRef.
- X.-Q. Lin, W.-D. Wang, Q.-F. Lü, Y.-Q. Jin, Q. Lin and R. Liu, J. Mater. Sci. Technol., 2017, 33(11), 1339–1345 CrossRef CAS.
- T. Liu, T. Kou, D. Bulmahn, C. Ortuno-Quintana, G. Liu, J. Q. Lu and Y. Li, ACS Appl. Energy Mater., 2018, 1(9), 5043–5053 CrossRef CAS.
- P. Wang, J. Xu, F. Xu, W. Zhao, P. Sun, Z. Zhang, M. Qian and F. Huang, Carbon, 2018, 134, 391–397 CrossRef CAS.
- X. Deng, B. Zhao, L. Zhu and Z. Shao, Carbon, 2015, 93, 48–58 CrossRef CAS.
- R. Zeng, X. Tang, B. Huang, K. Yuan and Y. Chen, ChemElectroChem, 2018, 5(3), 515–522 CrossRef CAS.
- N. Sudhan, K. Subramani, M. Karnan, N. Ilayaraja and M. Sathish, Energy Fuels, 2016, 31(1), 977–985 CrossRef.
- C. Shen, R. Li, L. Yan, Y. Shi, H. Guo, J. Zhang, Y. Lin, Z. Zhang, Y. Gong and L. Niu, Appl. Surf. Sci., 2018, 455, 841–848 CrossRef CAS.
- F. R. Maria Sundar Raj, N. V. Jaya, G. Boopathi, D. Kalpana and A. Pandurangan, Mater. Chem. Phys., 2020, 240, 122151 CrossRef CAS.
- J. Li, K. Han, D. Wang, Z. Teng, Y. Cao, J. Qi, M. Li and M. Wang, Carbon, 2020, 164, 42–50 CrossRef CAS.
- F. Han, D. Duan, W. Jing, Q. Wu, B. Tian, Z. Zhang, J. Liu, Y. Sun and Z. Jiang, Ceram. Int., 2022, 48(2), 2058–2067 CrossRef CAS.
- L. Guan, L. Pan, T. Peng, C. Gao, W. Zhao, Z. Yang, H. Hu and M. Wu, ACS Sustainable Chem. Eng., 2019, 7(9), 8405–8412 CrossRef CAS.
- Y. Gong, D. Li, Q. Fu, Y. Zhang and C. Pan, ACS Appl. Energy Mater., 2020, 3(2), 1585–1592 CrossRef CAS.
- G. Ghanashyam and H. K. Jeong, J. Energy Storage, 2019, 26, 100923 CrossRef.
- D. Dong, Y. Zhang, Y. Xiao, T. Wang, J. Wang, C. E. Romero and W. P. Pan, J. Colloid Interface Sci., 2020, 580, 77–87 CrossRef CAS PubMed.
- M. Zhang, J. Cheng, L. Zhang, Y. Li, M. Chen, Y. Chen and Z. Shen, ACS Sustainable Chem. Eng., 2020, 8, 3637–3643 CrossRef CAS.
- E. Armelin, M. M. Pérez-Madrigal, C. Alemán and D. D. Díaz, J. Mater. Chem. A, 2016, 4, 8952–8968 RSC.
- W. G. Moon, G. P. Kim, M. Lee, H. D. Song and J. Yi, ACS Appl. Mater. Interfaces, 2015, 7, 3503–3511 CrossRef CAS PubMed.
- D. Wang, Y. Xiao, X. Luo, Z. Wu, Y.-J. Wang and B. Fang, ACS Sustainable Chem. Eng., 2017, 5, 2509–2515 CrossRef CAS.
- B. Fang, A. Bonakdarpour, M.-S. Kim, J. H. Kim, D. P. Wilkinson and J.-S. Yu, Microporous Mesoporous Mater., 2013, 182, 1–7 CrossRef CAS.
- B. Fang, Y. Z. Wei, K. Suzuki and M. Kumagai, Electrochim. Acta, 2005, 50, 3616–3621 CrossRef CAS.
- D. Guo, B. Ding, X. Hu, Y. Wang, F. Han and X. Wu, ACS Sustainable Chem. Eng., 2018, 6, 11441–11449 CrossRef CAS.
- L. Wang, T. Wei, L. Sheng, L. Jiang, X. Wu, Q. Zhou, B. Yuan, J. Yue, Z. Liu and Z. Fan, Nano Energy, 2016, 30, 84–92 CrossRef CAS.
- Y. Wang, Z. Zhao, W. Song, Z. Wang and X. Wu, J. Mater. Sci., 2018, 54, 4917–4927 CrossRef.
- X. Wu, D. Yang, C. Wang, Y. Jiang, T. Wei and Z. Fan, Carbon, 2015, 92, 26–30 CrossRef CAS.
Footnotes |
| † Electronic supplementary information (ESI) available. See https://doi.org/10.1039/d2ra03685a |
| ‡ These authors contributed equally to this work. |
| This journal is © The Royal Society of Chemistry 2022 |

