 Open Access Article
Benzothiazole appended 2,2′-(1,4-phenylene)diacetonitrile for the colorimetric and fluorescence detection of cyanide ions†
Dhanapal Jothi a,
Sathishkumar Munusamyb,
Saravanakumar Manickamc,
Saravanan Enbanathan
 a,
Selin Manojkumara and
Sathiyanarayanan Kulathu Iyer
 *a
*a
aDepartment of Chemistry, School of Advanced Sciences and Vellore Institute of Technology, Vellore-632014, India. E-mail: sathiya_kuna@hotmail.com
bInstitute of Chemical Biology and Nanomedicine, State Key Laboratory of Chemo/Bio-sensing and Chemometrics, College of Chemistry and Chemical Engineering, Hunan University, Changsha 410082, P.R. China. E-mail: pra3sat@gmail.com
cSaveetha School of Engineering, Saveetha Institute of Medical and Technological Sciences, (SIMATS), Chennai-602105, Tamil Nadu, India. E-mail: solorsaravanan50@gmail.com
First published on 20th October 2022
Abstract
A benzothiazole appended 2,2′-(1,4-phenylene)diacetonitrile derivative (2Z,2′Z)-2,2′-(1,4-phenylene)bis(3-(3-(benzo[d]thiazol-2-yl)-4-hydroxyphenyl)acrylonitrile) (PDBT) has been synthesized and investigated as a novel sensor, capable of showing high selectivity and sensitivity towards CN− over a wide range of other interfering anions. After reaction with CN−, PDBT shows a new absorption peak at 451 nm with a color transformation from colorless to reddish-brown. When yellow fluorescent PDBT is exposed to CN−, it displays a significant increase in fluorescence at 445 nm, resulting in strong sky-blue fluorescence emission. The nucleophilic addition reaction of CN− plays a role in the sensing mechanism of PDBT to CN−. PDBT can distinguish between a broad variety of interfering anions and CN− with remarkable selectivity and sensitivity. Furthermore, the detection limit of the PDBT probe for CN− is 0.62 μM, which is significantly lower than the WHO standard of 1.9 μM for drinking water. Density functional theory simulations corroborated the observed fluorescence changes and the internal charge transfer process that occurs after cyanide ion addition. In addition, real-time applications of PDBT, such as cell imaging investigations and the detection of CN− in water samples, were successfully carried out.
Introduction
Since they are so prevalent, anionic species serve a critical role in a broad range of biological and chemical processes.1–6 Their inappropriate release pollutes the environment, endangering all life forms as a direct consequence.7–9 A well-known and contentious anion among the numerous anions is cyanide (CN−), which has piqued researchers' curiosity for a long time. Cyanide has applications in numerous chemical processes, including extraction of precious metals, electroplating, metallurgy, tanning, medicine and plastic manufacturing, etc.10–14 Additionally, chemical warfare agents and pesticides both employ cyanide gas as a method of extermination. Inadequate control over the usage of CN− in the environment might lead to the substance entering the body. At relatively low concentrations, CN− binds to cytochrome's ferric ions in the mitochondrial respiratory chain, inhibiting oxygen carriage and causing cell death.15,16 Water cyanide levels are limited by the World Health Organization (WHO) to 70 μM for long-term exposure and 500 μM for short-term exposure. Unfortunately, the likelihood of cyanide exposure has increased in recent years due to both accidental and intentional exposure. Thus, environmental cyanide detection has received crucial attention, pushing us to create a low-cost and robust sensor that can detect CN− in real water samples and living cells.Colorimetric and fluorescence sensors have garnered a great deal of interest because of their practicality, high sensitivity, and selectivity, as well as their ability to be detected with the “naked eye” and potential use in bioimaging.17–25 Colorimetric and fluorimetric sensors have been used in multiple studies to date to detect cyanide anion utilizing different sensing methods, such as supramolecular self-assembly, nucleophilic addition, and hydrogen bonds. Some of the most important electron-deficient sites in nucleophilic addition-based sensing probes were benzothiazole, malononitrile, and dialkyl malate.26–36 Notwithstanding, most sensors have a complicated synthesis process, a poor color response, and a low level of sensitivity. Furthermore, methods for cyanide detection employing hydrogen bonding interaction have limitations when used in conjunction with anions that are competitive, such as fluoride, acetate, and phosphate ions.
This observation led us to introduce a benzothiazole unit in 2,2′-(1,4-phenylene)diacetonitrile through a conjugated double bond, which is predicted to display strong electrophilic character and lead to the nucleophilic addition of cyanide. The synthesized receptor PDBT has expanded π-conjugation between two benzothiazole units along strong electron acceptor phenylenediacetonitrile. Therefore, the cyanide ion attack on the PDBT was predicted to disrupt the conjugation mechanism as well as the ICT procedure.37–43 A modification in intramolecular conformation in the subsequent cyanide product significantly alters receptor PDBT absorption and emission characteristics. The chemosensor PDBT shows a bright brown color over the addition of micromolar quantities of CN−, enabling it to be utilized for effective naked eye detection of CN− ion.
Experimental section
All the required chemical reagents were purchased from Alfa Aesar and sigma Aldrich, and they were utilized directly without further purification. Especially, Solvents (analytical grade) were purchased from Pure chem. NMR (Nuclear Magnetic Resonance) spectra were recorded on Bruker Ascent-400 spectrometer. Chemical shifts (δ) are represented in the measure of ppm and TMS has been fixed as an internal standard. To identify the exact mass of the compound, High-Resolution Mass Spectral (HRMS) measurements were carried out in Waters – Xevo G2 – XS – Q ToF High Resolution Mass spectrometer instrument. Furthermore, fluorescence emission and absorption spectrum were recorded by PerkinElmer LS-55 luminescence spectrometer and Shimadzu 3600 spectrophotometer respectively. To evaluate the biological interaction of PDBT with CN− ions in the living cells, fluorescent live cell images were recorded in WEXWOX fluorescence microscope 3000.Synthesis of 3-(benzo[d]thiazol-2-yl)-4-hydroxybenzaldehyde (SMD)
The compound SMD was prepared by the formylation of 2-(benzo[d]thiazol-2-yl)phenol with hexamethylenetetramine (HMTA) in acetic acid under reflux condition for 5 hours. The further procedures were followed as per the literature.44,46Synthesis of PDBT
1,4-Phenylenediacetonitrile (312.0 mg, 2.0 mmol) was dissolved in dry DMF (10 mL) and potassium tert-butoxide (220.0 mg, 2.0 mmol) was added. The resulting solution was stirred under nitrogen atmosphere at 90 °C for 20 minutes. To this reaction mixture, SMD was added (1.02 g, 4.0 mmol) and the reaction mixture was allowed to stir under N2 atmosphere at 90 °C for a further period of 3 h. The appearance of new orange fluorescence spot in TLC confirms the formation of compound (PDBT). After confirming the completion of the reaction by TLC, the reaction mixture was allowed to cool to room temperature, diluted with H2O, neutralized by adding hydrochloric acid, and extracted with ethyl acetate three times. The extracted organic layers were dried by adding anhydrous Na2SO4. Ethyl acetate was removed under reduced pressure, and the concentrated residue was purified by silica gel column chromatography. Yield 73% (280 mg). 1H NMR (400 MHz, DMSO-d6)™: δ 7.204–7.220 (d, 2H, J = 2.87), 7.382–7.406 (m, 7H, J = 2.95 Hz), 7.807–7.824 (d, 4H, J = 3.12 Hz), 8.126–8.145 (m, 8H, J = 3.24 Hz), 13.048 (s, 1H). 13C NMR (DMSO-d6, 100 MHz): δ 108.54, 119.65, 120.88, 121.06, 121.77, 122.77, 122.98, 125.40, 125.49, 125.72, 128.56, 129.28, 129.31, 129.75, 129.89, 131.39, 135.87, 136.10, 142.03, 152.24, 166.17.Results and discussion
The cyanide chemosensor PDBT was synthesized from commercially accessible materials in a single step using the Knoevenagel condensation method. As shown in Scheme 1, PDBT was synthesized in 73% yield from 3-(benzo[d]thiazol-2-yl)-4-hydroxybenzaldehyde and 2,2′-(1,4-phenylene)diacetonitrile. Having synthesized the receptor PDBT, it was characterized by NMR and mass spectroscopy analysis (Fig. S1–S3†).UV-vis and emission spectral responses of PDBT towards CN− ion
To test its sensitivity to different anions, the PDBT probe (10 μM) in CH3CN![[thin space (1/6-em)]](https://www.rsc.org/images/entities/char_2009.gif) :
:![[thin space (1/6-em)]](https://www.rsc.org/images/entities/char_2009.gif) H2O (1
H2O (1![[thin space (1/6-em)]](https://www.rsc.org/images/entities/char_2009.gif) :
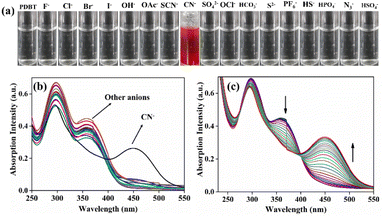
:![[thin space (1/6-em)]](https://www.rsc.org/images/entities/char_2009.gif) 1, v/v) solution was exposed to a variety of anions, including F−, Cl−, Br−, I−, OAc−, CN−, ClO4−, H2PO4−, HCO3−, HSO4−, SH−, NO3−, SCN−, S2−, and OH− and examined by the naked eye and UV-vis spectral studies. Individual electronic spectra of PDBT with various selective anions are shown in Fig. S8.† The probe (PDBT) was evaluated for selectivity with ten equivalents of different anions and only CN− showed a significant color shift from colorless to reddish-brown in the experiments (Fig. 1a). Also, UV-vis spectroscopy was used to examine spectral shifts of PDBT over the addition CN−, which confirmed that the probe was selective for the CN− ion. PDBT alone has two absorption bands in the spectra, with the higher intensity peak at 298 nm and the peak at 365 nm has low intensity (Fig. 1b). The π–π* and n–π* transitions are considered to be responsible for the formation of these bands. Adding CN− reduced the absorption at 365 nm and created a new absorption at 451 nm. However, the absorption at 298 nm was largely unaffected.
1, v/v) solution was exposed to a variety of anions, including F−, Cl−, Br−, I−, OAc−, CN−, ClO4−, H2PO4−, HCO3−, HSO4−, SH−, NO3−, SCN−, S2−, and OH− and examined by the naked eye and UV-vis spectral studies. Individual electronic spectra of PDBT with various selective anions are shown in Fig. S8.† The probe (PDBT) was evaluated for selectivity with ten equivalents of different anions and only CN− showed a significant color shift from colorless to reddish-brown in the experiments (Fig. 1a). Also, UV-vis spectroscopy was used to examine spectral shifts of PDBT over the addition CN−, which confirmed that the probe was selective for the CN− ion. PDBT alone has two absorption bands in the spectra, with the higher intensity peak at 298 nm and the peak at 365 nm has low intensity (Fig. 1b). The π–π* and n–π* transitions are considered to be responsible for the formation of these bands. Adding CN− reduced the absorption at 365 nm and created a new absorption at 451 nm. However, the absorption at 298 nm was largely unaffected.
A distinct isosbestic point at 400 nm was generated due to the absorption alterations in PDBT caused by the addition of CN− (Fig. 1c). An absorbance titration in CH3CN![[thin space (1/6-em)]](https://www.rsc.org/images/entities/char_2009.gif) :
:![[thin space (1/6-em)]](https://www.rsc.org/images/entities/char_2009.gif) H2O (v/v, 1
H2O (v/v, 1![[thin space (1/6-em)]](https://www.rsc.org/images/entities/char_2009.gif) :
:![[thin space (1/6-em)]](https://www.rsc.org/images/entities/char_2009.gif) 1) was carried out to learn more about the interaction between PDBT and CN−. The UV absorbance band centred at 365 nm reduced progressively when CN− ions were added to the probe PDBT solution, while a new, virtually wide peak gradually developed at 451 nm. It was possible to acquire an accurate linear range of 1–20 μM using UV-vis absorption titration data and a correlation coefficient R2 = 0.9933 (Fig. S4†).
1) was carried out to learn more about the interaction between PDBT and CN−. The UV absorbance band centred at 365 nm reduced progressively when CN− ions were added to the probe PDBT solution, while a new, virtually wide peak gradually developed at 451 nm. It was possible to acquire an accurate linear range of 1–20 μM using UV-vis absorption titration data and a correlation coefficient R2 = 0.9933 (Fig. S4†).
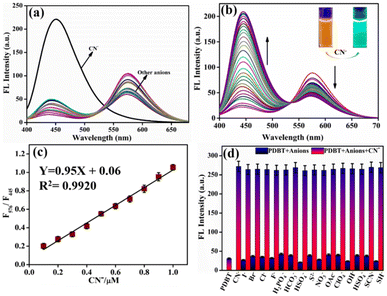
The aqueous solutions containing 5 μM of different relevant competitive analytes (as assessed in the UV-vis study) were used to investigate the PDBT's selectivity and competitivity for the identification of CN−. When the aforementioned competing species were individually added to a 1 μM PDBT solution, the probe solution showed minor fluorescence intensity change at 576 to 445 nm towards those relevant analytes, as shown in Fig. 2a. When only 2 μM CN− was added to the probe solution, nevertheless, the intensity of the fluorescence spectrum of PDBT was dramatically improved. The findings confirmed that PDBT has a high selectivity for cyanide ions. Meanwhile, the fluorescence spectra of PDBT with and without CN− ion has a marked difference. PDBT alone has a strong emission peak at 576 nm, showing orange fluorescence. In the presence of CN−, the fluorescence emission at 576 nm begins to decline, and a new emission peak at 445 nm starts to rise. Consequently, the PDBT solution's initial orange fluorescence begins to fade and is progressively replaced by an intense greenish-blue fluorescence (Fig. 2b). The observed change in the fluorescence emission of PDBT in the presence of CN− indicated the potential of quantifying CN− detection using a ratiometric response. The change in the F576/F445 ratio with increasing CN− concentration is shown graphically in Fig. 2c. When the concentration of CN− was raised from 0 to 2 μM, the fluorescence ratio F576/F445 was enhanced by approximately six-fold. It is also important to note that the F576/F445 ratio responds linearly to CN− concentrations in the range of 0.1–1 μM. A fluorescence spectrum titration was used to compute LOD (limit of detection) using the formula LOD = 3σ/K, where σ is the standard deviation of blank measurements (Fig. S9†) and K is the slope of the plot of fluorescence intensity ratio (F576/F445) versus sample concentration. As a result, a LOD of 0.62 μM was determined.
The ability to resist interference from competing analytes is a critical measure of the reliability of fluorescence sensor identification. As shown in Fig. 2d, the probe PDBT was inert to the addition of the other pertinent anions; however, the emission intensity of PDBT at 576 and 445 nm has experienced a radical transformation following the addition of CN−. These findings demonstrated that the detection of the cyanide anion by the probe PDBT was not affected by the presence of other competing anions. Overall, the findings indicated that PDBT had greater selectivity and anti-interference to CN− than other relevant analytes in this study.
Effect of pH and time
To determine the effect of pH on the detection of probe PDBT, the response of PDBT (1 μM) was evaluated in a 1![[thin space (1/6-em)]](https://www.rsc.org/images/entities/char_2009.gif) :
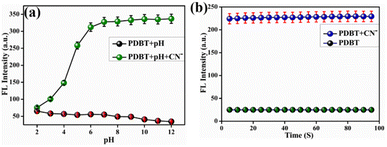
:![[thin space (1/6-em)]](https://www.rsc.org/images/entities/char_2009.gif) 1 mixture of CH3CN and H2O to CN− (2 μM) when the pH is between 2 and 12. As depicted in Fig. 3a, the intensity of PDBT without cyanide ion at 576 nm was stable at a low level within a wide pH range of 2–12. For the pH range 2 to 12, PDBT's fluorescence signal at 445 nm was found to be very weak and only minimally affected by H+ or OH−. When 2 μM CN− was added to a PDBT solution, the emission intensity at 445 nm rise significantly. It has been shown that when CN− is present at pH values between 2 and 12, the fluorescence intensity at 445 nm of the sensor PDBT rises significantly. It has also been demonstrated that the fluorescence response to CN− between 6 and 12 was practically pH-independent. In a 1
1 mixture of CH3CN and H2O to CN− (2 μM) when the pH is between 2 and 12. As depicted in Fig. 3a, the intensity of PDBT without cyanide ion at 576 nm was stable at a low level within a wide pH range of 2–12. For the pH range 2 to 12, PDBT's fluorescence signal at 445 nm was found to be very weak and only minimally affected by H+ or OH−. When 2 μM CN− was added to a PDBT solution, the emission intensity at 445 nm rise significantly. It has been shown that when CN− is present at pH values between 2 and 12, the fluorescence intensity at 445 nm of the sensor PDBT rises significantly. It has also been demonstrated that the fluorescence response to CN− between 6 and 12 was practically pH-independent. In a 1![[thin space (1/6-em)]](https://www.rsc.org/images/entities/char_2009.gif) :
:![[thin space (1/6-em)]](https://www.rsc.org/images/entities/char_2009.gif) 1 combination of CH3CN and H2O, the temporal relevance of PDBT (1 μM) on CN− (2 μM) is illustrated in Fig. 3b. In the existence of CN−, the emission intensity at 445 nm immediately increased and reached a stable value within 5 seconds of playing time, which implied that fluorescence recording of PDBT can be taken immediately over the addition of CN−. When CN− was present, the emission intensity at 445 nm surged instantly and reached a steady value after 5 seconds of recording time, indicating that fluorescence recording of PDBT could be performed immediately after the addition of CN−.
1 combination of CH3CN and H2O, the temporal relevance of PDBT (1 μM) on CN− (2 μM) is illustrated in Fig. 3b. In the existence of CN−, the emission intensity at 445 nm immediately increased and reached a stable value within 5 seconds of playing time, which implied that fluorescence recording of PDBT can be taken immediately over the addition of CN−. When CN− was present, the emission intensity at 445 nm surged instantly and reached a steady value after 5 seconds of recording time, indicating that fluorescence recording of PDBT could be performed immediately after the addition of CN−.
Investigation of sensing mechanism
The chemosensor and analyte stoichiometric ratio are critical in determining the sensing mechanism. Job's plot was used to investigate the binding stoichiometry of the chemosensor PDBT with CN− to establish the mechanism. Job's figure was created by plotting the fluorescence intensity ratio (F576/F445) as a function of the PDBT/(PDBT + CN−). According to Job's figure, the highest emission intensity of PDBT chemosensors was seen at 0.4 mol fraction of CN− ions (binding stoichiometry; 1![[thin space (1/6-em)]](https://www.rsc.org/images/entities/char_2009.gif) :
:![[thin space (1/6-em)]](https://www.rsc.org/images/entities/char_2009.gif) 2). (Fig. S5†). This 1
2). (Fig. S5†). This 1![[thin space (1/6-em)]](https://www.rsc.org/images/entities/char_2009.gif) :
:![[thin space (1/6-em)]](https://www.rsc.org/images/entities/char_2009.gif) 2 binding stoichiometry demonstrates that two molecules of CN− react with one molecule of PDBT. In addition, the HRMS results of dye PDBT at 629.0978 and probe PDBT + CN− ions show a new peak at m/z = 685.12, supporting this finding (Fig. S6†).
2 binding stoichiometry demonstrates that two molecules of CN− react with one molecule of PDBT. In addition, the HRMS results of dye PDBT at 629.0978 and probe PDBT + CN− ions show a new peak at m/z = 685.12, supporting this finding (Fig. S6†).
Furthermore, the detection mechanism of the chemosensor in the presence of CN− was investigated using a 1H NMR titration experiment in DMSO-d6 (Fig. 4). Fig. 4a shows that probe PDBT displays a characteristic peak corresponding to phenolic (–OH) proton at 12.92 ppm. The vinyl proton signals at 8.21 ppm fade after the titration with CN− to the probe, and a new signal resonates at 7.30 ppm. The aromatic proton Ha, as represented in Fig. 4, shifts to the upfield region from 7.18 ppm to 6.48 ppm. Furthermore, the aromatic proton signals have been displaced to a certain degree. The presence of a new peak at 7.30 ppm has been linked to cyano ethyl proton. It proves that CN− ions attack the vinyl group via nucleophilic addition reaction.
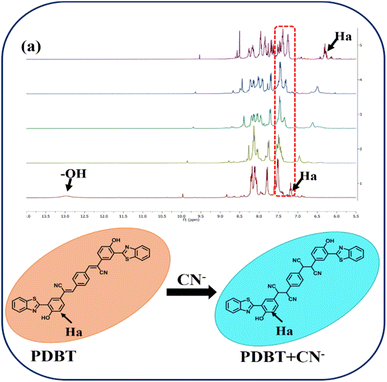 | ||
| Fig. 4 (a) 1H NMR titration of PDBT with the incremental addition of 1 equiv. of CN− ions in DMSO-d6 solvent. | ||
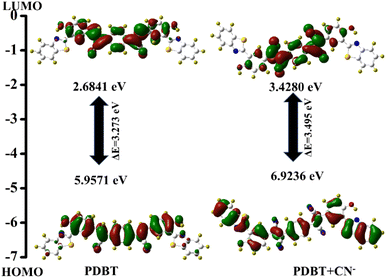
In addition, density functional theory (DFT) calculations were done using the Gaussian 09 software to ascertain the sensing mechanism's viability. The B3LYP/6-31G (d) level of theory was used to optimize the geometries and frontier molecular orbital (FMO) analyses of both chemosensors and the targeted product. Fig. S7† and 5 reveal the HOMO–LUMO surfaces of chemosensor PDBT. The transition energies and relative oscillator strengths of the probable important transitions for the PDBT and PDBT + CN−, have been found (Table S1†). The HOMO orbital was restricted to the central core of PDBT, which has the phenyl ring connected by two cyano units, whereas the LUMO orbital was diffused around the dicyanophenyl unit of PDBT, but with a higher electron density. However, in the PDBT + CN− complex, the electron density of the HOMO orbital is more distributed on the benzothiazole unit than on the dicyanophenyl unit. In LUMO orbitals, on the other hand, electrons are localized on the dicyanophenyl unit. This behaviour is attributable to the breakdown of extended conjugation of the chemosensor after the interaction of CN− with the vinyl group of PDBT. Additionally, the rupture of the π-conjugated structure leads to a significant HOMO–LUMO energy difference (3.49 eV) for sensor PDBT + CN− than for sensor PDBT (3.27 eV). As a result of these theoretical calculations, it was determined that CN− attacked the C![[double bond, length as m-dash]](https://www.rsc.org/images/entities/char_e001.gif) C link and disrupted the molecule's conjugation structure, resulting in decreased ICT in sensor PDBT + CN−.
C link and disrupted the molecule's conjugation structure, resulting in decreased ICT in sensor PDBT + CN−.
Application in natural water samples
To determine the chemosensor PDBT's suitability for practical use, spiked CN− levels in tap water samples were monitored (from the campus of Vellore Institute of Technology). As established by the fluorescence standard curve and the cyanide concentration, tap water was tested three times for the presence of cyanide (CN−).As indicated in Table 1, the chemosensor PDBT displayed great consistency in detecting CN− in water samples. The relative standard deviations (RSD.) and recoveries were computed using the relevant figures. The findings of the experiments demonstrated that the optical probe PDBT exhibited good accuracy in detecting quantitative cyanide in aqueous solutions. An exciting practical use for this technology is in monitoring cyanide in gold leach waste solutions that include cyanide and other solutions that have larger concentrations of cyanide ions.
| Spiked (μM) | Detected (μM) | Average (μM) | Recovery (%) | RSD (%) |
|---|---|---|---|---|
| 1 | 0.95 | 0.96 | 95 | 1.04 |
| 0.97 | 97 | |||
| 0.96 | 96 | |||
| 2 | 1.93 | 2.0 | 96 | 3.40 |
| 2.02 | 101 | |||
| 2.05 | 102.5 | |||
| 3 | 2.92 | 2.90 | 97 | 0.6 |
| 2.89 | 96 | |||
| 2.90 | 96 |
Cell imaging
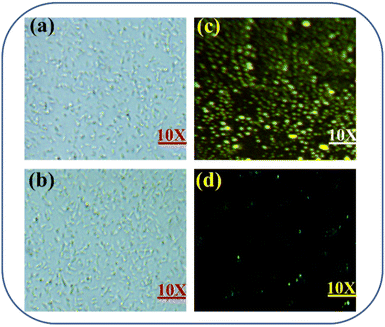
Probe PDBT was used to detect CN− in Escherichia coli cells to test the bioimaging capabilities of the probe.45 According to the bright field diagram (Fig. 6a), it is clear that healthy cell morphology was seen in the experiment, showing that the probe was biocompatible and cytotoxicity-free. When fluorescence microscopy was used to examine the cell area, it revealed a significant bright yellow fluorescence inside the cells, and the probe has good cell membrane permeability. Furthermore, the cells showed a blue-green fluorescence after being treated with probe PDBT (2 μM) and subsequently treated with CN− (5 μM). Based on these findings, it is obvious that the probe PDBT may be employed to detect the presence of exogenous CN− in live cells.Conclusion
In conclusion, by coupling 3-(benzo[d]thiazol-2-yl)-4-hydroxybenzaldehyde on either side of 2,2′-(1,4-phenylene)diacetonitrile, an efficient and straightforward colorimetric and ratiometric chemosensor PDBT has been effectively achieved. The interaction of PDBT with anions was investigated using UV-vis and fluorescence techniques. The chemosensor PDBT demonstrated great sensitivity and a sole reaction to CN− with a LOD of 0.62 μM. Spectral experiments and theoretical calculations have shown that the nucleophilic addition of CN− to the sensor PDBT causes an interruption in the conjugated structure of the molecule, resulting in the inhibition of ICT and, therefore, the optical changes. Finally, PDBT was successfully proven in real-time samples for practical applications and live-cell imaging, indicating that PDBT may function as a qualitative and a quantitative sensor for the detection of CN− ions.Conflicts of interest
There are no conflicts to declare.Acknowledgements
Dhanapal J. sincerely thanks Vellore Institute of Technology for providing a Teaching Cum Research Assistant (Project No: VIT/HR/2019/12732) for the financial support. The DST-FIST NMR facility at VIT University is duly acknowledged. The authors thank Dr S. Meenakshi, SSL-VIT for language editing.References
- L. K. Macreadie, A. M. Gilchrist, D. A. McNaughton, W. G. Ryder, M. Fares and P. A. Gale, Chem, 2022, 8, 46–118 CAS.
- J. Yang, W. Tai, F. Wu, K. Shi, T. Jia, Y. Su, T. Liu, P. Mocilac, X. Hou and X. Chen, Chemosphere, 2022, 292, 133401 CrossRef CAS PubMed.
- X. Huang, L. Huang, S. R. B. Arulmani, J. Yan, Q. Li, J. Tang, K. Wan, H. Zhang, T. Xiao and M. Shao, Environ. Res., 2022, 204, 112381 CrossRef CAS PubMed.
- N. Chen and Y. M. Lee, Trends Chem., 2022 DOI:10.1016/j.trechm.2021.12.009.
- Á. J. Patiño-Agudelo and F. H. Quina, J. Colloid Interface Sci., 2022, 611, 39–45 CrossRef PubMed.
- Z. Jie, J. Liu, M. Shu, Y. Ying and H. Yang, Talanta, 2022, 236, 122892 CrossRef CAS PubMed.
- J. Wu, C. Li, Q. Chen and J. Zhao, Dyes Pigm., 2021, 195, 109709 CrossRef CAS.
- V. P. Reddy, E. Sinn and N. Hosmane, J. Organomet. Chem., 2015, 798, 5–12 CrossRef CAS.
- P. Molina, F. Zapata and A. Caballero, Rev, 2017, 117, 9907 CAS.
- D. T. Thompson, Gold Bull., 2001, 34, 133 CrossRef.
- K. Matsubara, A. Akane, C. Maseda and H. Shiono, Forensic Sci. Int., 1990, 46, 203–208 CrossRef CAS.
- S. Chakraborty, S. Paul, P. Roy and S. Rayalu, Inorg. Chem. Commun., 2021, 128, 108562 CrossRef CAS.
- D. Udhayakumari, Sens. Actuators, B, 2018, 259, 1022–1057 CrossRef CAS.
- H. Wan, Q. Xu, P. Gu, H. Li, D. Chen, N. Li, J. He and J. Lu, J. Hazard. Mater., 2021, 403, 123656 CrossRef CAS PubMed.
- D. Shan, C. Mousty and S. Cosnier, Anal. Chem., 2004, 76, 178–183 CrossRef CAS PubMed.
- G. Balamurugan, P. Venkatesan, S. P. Wu and S. Velmathi, RSC Adv., 2016, 6, 24229–24235 RSC.
- P. J. R. de Rivera, M. R. de Rivera, F. Socorro and M. R. de Rivera, Measurement, 2021, 186, 110134 CrossRef.
- H. Tavallali, G. Deilamy-Rad, A. Parhami, R. Zebarjadi, A. Najafi-Nejad and N. Mosallanejad, Anal. Biochem., 2022, 637, 114475 CrossRef CAS PubMed.
- H. Battula, S. Muduli, S. P. Bandi, S. Kapoor, S. Mishra, H. Aggarwal, V. V. krishna Venuganti and S. Jayanty, J. Photochem. Photobiol., A, 2022, 426, 113748 CrossRef CAS.
- T. S. Aysha, M. B. I. Mohamed, M. S. El-Sedik and Y. A. Youssef, Dyes Pigm., 2021, 196, 109795 CrossRef CAS.
- S. Sawminathan, S. Munusamy, S. Manickam, D. Jothi and S. KulathuIyer, Dyes Pigm., 2021, 196, 109755 CrossRef CAS.
- D. Jothi and S. K. Iyer, J. Photochem. Photobiol., A, 2022, 113802 CrossRef CAS.
- D. Jothi, S. Munusamy and S. K. Iyer, J. Photochem. Photobiol., A, 2021, 420, 113491 CrossRef CAS.
- S. Munusamy, V. P. Muralidharan and S. K. Iyer, Sens. Actuators, B, 2017, 250, 244–249 CrossRef CAS.
- R. Chandra, A. Ghorai and G. K. Patra, Sens. Actuators, B, 2018, 255, 701–711 CrossRef CAS.
- H. S. Jung, J. H. Han, Z. H. Kim, C. Kang and J. S. Kim, Org. Lett., 2011, 13, 5056–5059 CrossRef CAS PubMed.
- M. T. Gabr and F. C. Pigge, Dalton Trans., 2018, 47, 2079–2085 RSC.
- P. Anzenbacher, D. S. Tyson, K. Jursíková and F. N. Castellano, J. Am. Chem. Soc., 2002, 124, 6232–6233 CrossRef CAS PubMed.
- S. Kim, J. Y. Noh, S. J. Park, Y. J. Na, I. H. Hwang, J. Min, C. Kim and J. Kim, RSC Adv., 2014, 4, 18094–18099 RSC.
- C. Zhang, C. Liu, B. Li, J. Chen, H. Zhang, Z. Hu and F. Yi, New J. Chem., 2015, 39, 1968–1973 RSC.
- P. M. Reddy, S.-R. Hsieh, C.-J. Chang and J.-Y. Kang, J. Hazard. Mater., 2017, 334, 93–103 CrossRef CAS PubMed.
- Q. Niu, T. Sun, T. Li, Z. Guo and H. Pang, Sens. Actuators, B, 2018, 266, 730–743 CrossRef CAS.
- A. Mouradzadegun and F. Abadast, Chem. Commun., 2014, 50, 15983–15986 RSC.
- P. Jayasudha, R. Manivannan and K. P. Elango, Sens. Actuators, B, 2015, 221, 1441–1448 CrossRef CAS.
- N. Niamnont, A. Khumsri, A. Promchat, G. Tumcharern and M. Sukwattanasinitt, J. Hazard. Mater., 2014, 280, 458–463 CrossRef CAS PubMed.
- D. Jothi, S. Munusamy, S. Enbanathan and S. K. Iyer, RSC Adv., 2022, 12, 8570–8577 RSC.
- P. G. Rao, B. Saritha and T. S. Rao, J. Photochem. Photobiol., A, 2019, 372, 177–185 CrossRef CAS.
- S. Erdemir and S. Malkondu, Talanta, 2021, 231, 122385 CrossRef CAS PubMed.
- R. Shanmugapriya, P. S. Kumar, S. Ponkarpagam, C. Nandhini, K. Vennila, A. G. Al-Sehemi, M. Pannipara and K. P. Elango, J. Mol. Struct., 2022, 1251, 132081 CrossRef CAS.
- J. Li, Z. Chang, X. Pan, W. Dong and A.-Q. Jia, Dyes Pigm., 2019, 168, 175–179 CrossRef CAS.
- N. Mergu, J. H. Moon, H. Kim, G. Heo and Y.-A. Son, Sens. Actuators, B, 2018, 273, 143–152 CrossRef CAS.
- F. Huo, J. Kang, C. Yin, J. Chao and Y. Zhang, Sens. Actuators, B, 2015, 215, 93–98 CrossRef CAS.
- J. Li, W. Wei, X. Qi, G. Zuo, J. Fang and W. Dong, Sens. Actuators, B, 2016, 228, 330–334 CrossRef CAS.
- D. Jothi, S. Munusamy, S. Enbanathan and S. K. Iyer, RSC Adv., 2022, 12, 8570–8577 RSC.
- S. Enbanathan, S. Manickam, S. Munusamy, D. Jothi, S. M. Kumar and S. K. Iyer, New J. Chem., 2022, 46(14), 6570–6576 RSC.
- D. Jothi, S. Munusamy, S. Enbanathan and S. K. Iyer, J. Photochem. Photobiol., A, 2022, 114269 Search PubMed.
Footnote |
| † Electronic supplementary information (ESI) available. See https://doi.org/10.1039/d2ra03702e |
| This journal is © The Royal Society of Chemistry 2022 |


