 Open Access Article
Simple synthesis of a hierarchical LiMn0.8Fe0.2PO4/C cathode by investigation of iron sources for lithium-ion batteries†
Yuanchao Li *ab,
Baoyan Xingb,
Huishuang Zhanga,
Mengjie Wangb,
Li Yangb,
Guangri Xu
 b and
Shuting Yang
 *a
*a
aPostdoctoral Research Base, School of Chemistry and Chemical Engineering, Henan Normal University, Xinxiang, Henan 453007, PR China. E-mail: liyuanchaozzu@126.com; shutingyang@foxmail.com; Fax: +86-0373-3040148
bPostdoctoral Station, School of Chemistry and Chemical Engineering, Henan Institute of Science and Technology, Xinxiang, Henan 453003, PR China
First published on 15th September 2022
Abstract
Iron (Fe) substitution is an effective strategy for improving the electrochemical performance of LiMnPO4 which has poor conductivity. Herein, we focus on investigating the effect of substitution of Mn with different iron sources, on the structure and electrochemical performances of the LiMnPO4 materials. The Fe-substituted LiMnPO4/C composites were synthesized via a simple and rational solid-state method, and will be of benefit for engineering applications. The characterization of the materials shows an obvious influence of the iron sources on structure and morphology. The N-LMFP material prepared using soluble FeNO3 as iron sources exhibits an excellent rate capacity of 122 mA h g−1 at 5C, and superior cyclability with a capacity retention of 98.9% after 400 cycles at 2C. The enhanced rate capability and cycling stability of N-LMFP are the result of the lowered electron/ion resistance and the improved reversibility of the reaction, that originates from the homogeneous fine particles and hierarchical structure with large mesopores. This research provides significant guidelines for designing an LiMnPO4 cathode with a high performance.
1. Introduction
Lithium-ion batteries have been widely used in portable devices and electric vehicles in recent years, however, its energy density has not satisfied the ever-increasing demand. Thus, the development of lithium-ion batteries with high energy density has become one of the research hotspots.1 Lithium manganese phosphate (LiMnPO4) exhibits 20% higher theoretical energy density than lithium iron phosphate (LiFePO4) because of the enhanced 0.5 V working voltage platform, and is considered to be a great potential cathode material with a high energy density.2–6 Unfortunately, LiMnPO4 exhibits poor electrochemical performance due to its low electronic/ionic conductivity and the Jahn–Teller distortion of Mn3+, thereby limiting its commercial applications.7–10 Because of extensive research by researchers, effective strategies to resolve the previous issues for use of LiMnPO4 materials include metal doping,11–17 surface coating18–21 and reducing the particle size.22–27 Despite the fact that attractive electrochemical performances of LiMnPO4 have been obtained, it is behind the LiFePO4 materials in terms of its use in commercial applications. Therefore, it is essential, if LiMnPO4 is to be used in practical applications, to further improve the rate capability and the cycling stability of the material by a simple and effective strategy.Many investigations have shown that a simple and effective method for the improvement of rate capability is to replace the Mn with Fe for the formation of LiMn1−xFexPO4.28–31 However, much substitution of Mn2+ with Fe2+ results in a serious reduction in the energy density of the LiMnPO4 materials. Previous research has indicated that the energy density is maximized in conjunction with rising rate capability as x approaches 0.2.32–34 Furthermore, the Fe substitution often enters the lattice of the LiMnPO4 materials, not to effectively prevent the reaction of the Mn ions with the electrolyte, although it does improve the electronic conductivity of the LiMnPO4 materials. Recently, Luo and co-workers prepared a 3D LiAlO2-coated LiMnPO4/C with a core shell using a sol–gel method, which significantly improved the cyclic stability of the LiMnPO4 materials due to the prevention of the reaction of Mn ions with the electrolyte. The as-prepared 3D LiMnPO4/C@LiAlO2 composites gave a specific discharge capacity of 105 mA h g−1 and a capacity retention of 98.4% at 10C after 100 cycles.35 Next, another hierarchical LiMnPO4 with a double shell consisting of NaTi2(PO4)3 and 3D graphene was fabricated via a solvothermal route, which showed a interested rate performance with a specific discharge capacity at 116 mA h g−1 at 10C and a high cyclic stability of 93.3% retention for 600 cycles at 2C.36 As demonstrated, this was effective for the improved electrochemical performances to construct a hierarchical architecture.37,38 Nevertheless, the construction of the hierarchical architecture reported, often required complex process steps, not suitable for large-scale manufacture.39,40 Based on this, it is expected that a Fe-substituted LiMnPO4/C material with a hierarchical structure can be constructed via a simple strategy, which will be beneficial for engineering applications by preventing the annoying interfacial reactions of Mn ions with the electrolyte.
Based on the previous considerations, a hierarchical porous LiMn0.8Fe0.2PO4/C material was synthesized by optimization of Fe sources with a rational solid-state method. The influence of the substitution of various iron sources for Mn, on the structural properties and electrochemical performances of LiMnPO4 is discussed for the first time. The use of soluble FeNO3 and insoluble MnO as raw materials leads to the formation of the hierarchical LiMn0.8Fe0.2PO4/C with a mesoporous structure. The benefits from the mesoporous structure mean that a superior rate performance and long cycle life is obtained in the N-LMFP sample.
2. Experimental section
2.1. Synthesis procedure
The Fe-substituted LiMnPO4/C precursors were synthesized using a rational solid-state approach. Initially, 2 mmol of sucrose (C12H22O11, AR, 99.0%), and 15 mmol of lithium dihydrogen phosphate (LiH2PO4, ACS, 98.0%, Aladdin) were dissolved 10 ml of deionized water under continuous stirring. Then 12 mmol of manganese oxide (MnO, Aladdin, AR, 99.0%) and 3 mmol of iron salt were gradually added to the previously mentioned solution while stirring vigorously, followed by ball milling for 5 h to form a uniform slurry. Subsequently, the homogeneous slurry was freeze dried for 48 h to eliminate any remaining water. Finally, the dried slurry was sintered at 700 °C for 10 h under an Ar atmosphere to yield a black LiMn0.8Fe0.2PO4/C powder, denoted as N-LMFP. To determine the influence of the iron sources on the LiMnPO4/C composites, the Fe-substituted LiMnPO4/C materials were prepared using FeC2O4 and Fe2O3 as Fe sources using the same synthetic route, denoted as C-LMFP and O-LMFP, respectively. In addition, the pure LiMnPO4/C (LMP/C) was prepared using the same method but without adding the Fe sources for comparison.2.2. Materials characterization
The X-ray diffraction (XRD) was measured on an X-ray powder diffractometer (Bruker D8 Advance) to characterize the crystal structure. Rietveld refinements of the obtained diffraction patterns were performed using the FullProf software. The morphology and energy dispersive X-ray EDS mapping of the materials were carried out using field-emission scanning electron microscopy (FESEM, Hitachi SU8010), and electron microscopy (Jeol JEM-2100) equipped for EDS spectroscopy. The BET measurement of the materials was carried out on a surface area analyzer (BeiShiDe Instrument Technology) at liquid nitrogen temperature (77 K). The X-ray photoelectron spectroscopy (XPS) data were collected using a scanning photoelectron spectrometer microprobe (NNCI PHI Quantera SXM). The carbon content of the materials was confirmed by elemental analysis (Thermo Scientific Flash EA1112).2.3. Electrochemical measurements
The CR2016 type coin cells were assembled in an Ar-filled glove box and used to investigate the electrochemical performances. The assembled CR2016 type coin cells were measured on a battery tester (Neware CT-4008, China) between 4.5 and 2.0 V. The cathode electrode consisted of 80 wt% of LMFP/C active material, 10 wt% of poly(propylene fluoride) and 10 wt% of acetylene black. The electrodes were dried at 110 °C for 12 h under vacuum, and then compressed at a given pressure before being cut into disks with a diameter of 1.4 cm. The mass loading density of the active materials was approximately 2.5 mg cm−2. A Celgard 2502 membrane was used as a separator, lithium metal was used as the anode, and a 1 M LiPF6 solution (ethylene carbonate (EC) + diethyl carbonate (DEC) + dimethyl carbonate (DMC), 1![[thin space (1/6-em)]](https://www.rsc.org/images/entities/char_2009.gif) :
:![[thin space (1/6-em)]](https://www.rsc.org/images/entities/char_2009.gif) 1
1![[thin space (1/6-em)]](https://www.rsc.org/images/entities/char_2009.gif) :
:![[thin space (1/6-em)]](https://www.rsc.org/images/entities/char_2009.gif) 1 v/v) as the electrolyte. The cyclic voltammetry (CV) measurements were conducted on a electrochemical work station (CH Instruments CHI660E, Chenhua, China) between 2.5 and 4.5 V with a scan rate of 0.05 mV s−1. The electrochemical impedance spectroscopy (EIS) tests were carried out on a electrochemical work station (CH Instruments CHI660E, Chenhua, China) over frequency ranges from 105 to 10−1 Hz with an amplitude voltage of 5 mV before the charge/discharge test. The cells after the charge/discharge cycle were disassembled in the glove box, and the electrodes were taken out, and then washed with DMC and dried.
1 v/v) as the electrolyte. The cyclic voltammetry (CV) measurements were conducted on a electrochemical work station (CH Instruments CHI660E, Chenhua, China) between 2.5 and 4.5 V with a scan rate of 0.05 mV s−1. The electrochemical impedance spectroscopy (EIS) tests were carried out on a electrochemical work station (CH Instruments CHI660E, Chenhua, China) over frequency ranges from 105 to 10−1 Hz with an amplitude voltage of 5 mV before the charge/discharge test. The cells after the charge/discharge cycle were disassembled in the glove box, and the electrodes were taken out, and then washed with DMC and dried.
3. Results and discussion
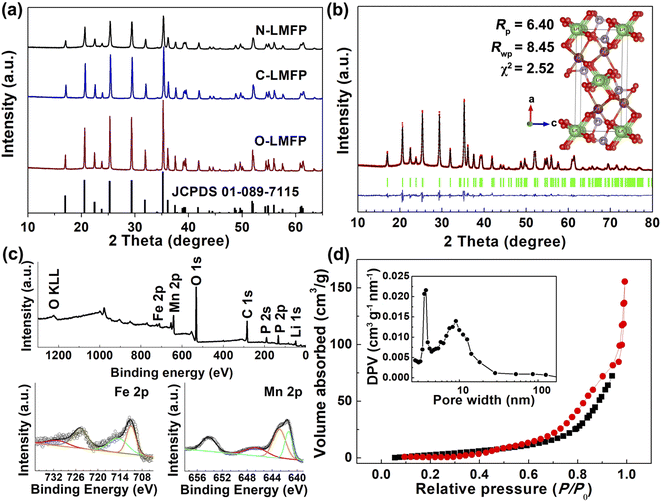
The XRD patterns and Rietveld refinements of the N-LMFP, C-LMFP and O-LMFP are shown in Fig. 1. In Fig. 1a, all the diffraction peaks of the three samples could be indexed well with the olivine-type LiMnPO4 with a Pnma space group (JCPDS 089-7115), which indicated the high purity of the three as-prepared samples. However, no typical peaks for the carbon coating were observed in the three samples, which implied an amorphous feature or a low content of the carbon coating. The carbon coating contents of N-LMFP, C-LMFP and O-LMFP were found to be 6.32, 7.12 and 6.35 wt%, respectively. In addition, the N-LMFP showed lower diffraction peaks than C-LMFP and O-LMFP, which demonstrated that the N-LMFP sample had low crystallinity and fine particles. This may be because the soluble Fe(NO3)3 coated on the surface of the MnO limited the increase of the LiMnPO4 particles. To further understand the structure and properties of the prepared samples from different iron sources, the Rietveld refinements were carried out, and the results are shown in Fig. 1b and S1 (ESI).† The calculated patterns of the three samples obtained by the Rietveld refinement fit well with the observed profile. The refinement results in Table S1 (ESI†) show the fitting factors Rp and Rwp were less than 10, which indicated that the refined result was in a reasonable range. The cell volumes of 300.42, 300.04 and 300.10 Å for the N-LMFP, C-LMFP and O-LMFP samples, respectively, lie between those of LiFePO4 (291.47 Å) and LiMnPO4 (302.70 Å), and this indicated that the Fe ions had entered the lattice of LiMnPO4. In addition, the cell parameters of the N-LMFP sample were larger than those of the C-LMFP and O-LMFP samples. Thus, it was found that a small amount of Fe ions in the N-LMFP sample do not enter the LiMnPO4 lattice, but that they may form an LiFePO4 phase coated on the surface of the LiMnPO4 phase (LiMn0.8Fe0.2−xPO4@(LiFePO4)x/C).The XPS spectrum was obtained and used to verify the elemental compositions and chemical states, shown in Fig. 1c and S2 (ESI).† The XPS survey spectra of the N-LMFP, C-LMFP and O-LMFP samples showed the typical peaks for Mn 2p, Fe 2p, C 1s, P 1s and O 1s. In the high-resolution spectra of the Fe 2p and Mn 2p, no significant difference was observed for the three samples. The major peaks of Mn 2p3/2 and Mn 2p1/2 were located at ∼641 and 653 eV, respectively, with a shoulder or satellite peak, which is characteristic for Mn2+.41 The spectrum of Fe 2p presents two peaks located at about 711 and 724 eV, which matching with Fe 2p3/2 and Fe 2p1/2, respectively, which may be ascribed to the Fe(II) state. The peaks for C 1s observed at 284.7 and 286.2 eV in Fig. S2d (ESI),† correspond to the sp2 C![[double bond, length as m-dash]](https://www.rsc.org/images/entities/char_e001.gif) C and C–O bonds, respectively, and show the presence of the carbon coating.
C and C–O bonds, respectively, and show the presence of the carbon coating.
The specific surface areas and pore structure of the three samples were investigated using a nitrogen adsorption–desorption experiment, and the results are given in Fig. 1d and S3 (ESI).† It was found that the N-LMFP sample displayed a more obvious type-IV hysteresis loop in the middle, and a high relative pressure range (P/P0 = 0.4–0.9) than the C-LMFP and O-LMFP samples, which indicated the presence of the abundant mesopores of the N-LMFP. The main pore size distribution of the N-LMFP, C-LMFP and O-LMFP composites was approximately 4 nm, whereas N-LMFP has a broad pore size distribution at the position of 9 nm, which could be formed by the oxidation of sucrose with the nearby Fe3+, generating gas products such as CO2 and CO.42,43 Furthermore, the N-LMFP showed a larger specific surface area of 55.3 m2 g−1 than that of the C-LMFP (32.3 m2 g−1) and O-LMFP (19.9 m2 g−1), which confirmed the presence of the large mesopores in the N-LMFP sample. The presence of larger mesopores in a hierarchical nanostructured material not only provides a high specific surface area with abundant active sites, but also facilitates fast mass transport, resulting in the improved electrochemical performance of the N-LFMP sample.44–46
The SEM images of the three samples, and the EDS mapping of the N-LMFP sample are shown in Fig. 2. It can be easily seen that different morphologies are found in the three samples. The N-LMFP exhibits a uniformly spherical morphology, whereas the C-LMFP shows a rod-like shape with particle aggregation, and O-LMFP displays a rough flake-like shape with some floc morphology on its surface. In addition, the N-LMFP sample prepared using FeNO3 shows the particles with a diameter of about 200 nm, which was relatively smaller than those of other two samples (approximately 500 nm). The homogeneous particle distribution of the N-LMFP may be related to its strong oxidizability which is due to the LiH2PO4 and Fe(NO3) raw materials, which gives a more homogeneous mix of MnO with the Fe3+ ion and carbon sources. The EDS results for N-LMFP in Fig. 2d show that the C, Fe, Mn, O, and P are uniformly distributed in the N-LMFP sample.
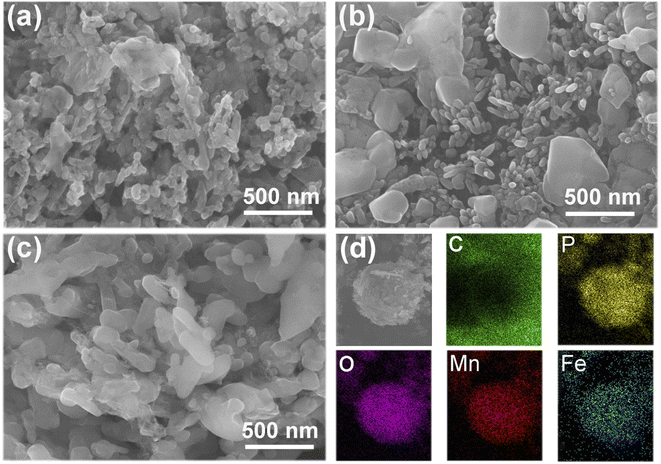 | ||
| Fig. 2 The SEM images of (a) N-LMFP/C, (b) C-LMFP/C and (c) O-LMFP/C as well as (d) EDS images of N-LMFP/C. | ||
Fig. 3 displays the TEM images of the N-LMFP sample. It is evident that a similar morphology was detected in the TEM image of the N-LMFP sample (Fig. 3a). In Fig. 3b, a layer of carbon coating on the surface of the N-LMFP particles was observed, which increases the conductivity of the material. In order to determine if there was a thin layer of LiFePO4 coating the surface of LMFP particles, scanning transmission electron microscopy (STEM), and EDS mapping measurement were performed. In Fig. 3c, the shape of the Mn, O, P elements was observed to be identical to those in the STEM image, which indicating a high uniformity of the elements. The Fe signal peculiar to the LFP was well distributed over all scope of STEM image in the same manner as the signal of the amorphous C coating on the surface of LMFP. This implied that the LiFePO4 phase could be coated on the surface of the LMFP particles. Moreover, Fig. 3b shows two lattice fringe spacings of 0.282 and 0.262 nm (Fig. 3d and e), which corresponded to the (301) crystal planes of LiFe0.33Mn0.77PO4 (JCPDS #089-7115), and the (401) crystal plane of LiFePO4 (JCPDS #083-2092), respectively. This result also demonstrated that the LiFePO4 phase was coated on the surface of LMFP particles, indicating the formation of the hierarchical structure.
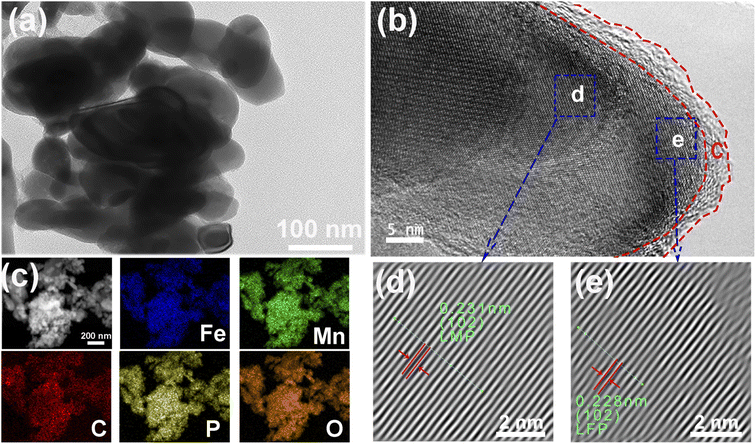 | ||
| Fig. 3 (a) The TEM, (b) HRTEM images, (c) EDS mapping, and (d, e) enlarged versions of the blue rectangles representing the phase areas of the N-LMFP/C in (b). | ||
The galvanostatic charge–discharge curves of the LiMn0.8Fe0.2PO4/C with diverse Fe sources were measured at various rates, and the results are shown in Fig. 4a–c. It should be noted that the rate performance was evaluated using a constant current and constant voltage model (CC–CV) at the identical charge and discharge rates when cycled at 0.1, 0.2, 0.5, 1, 2, 5C. Two flat discharge plateaus can be observed in the three samples. The discharge plateau at about 4.0 V corresponded to the redox process between the Mn3+/Mn2+ redox couple, whereas that at approximately 3.4 V was in agreement with that of the Fe3+/Fe2+ redox couple. It was found that the specific capacities of the as-prepared samples were influenced remarkedly by using different Fe sources. The N-LMFP exhibited the highest initial discharge capacity of 136 mA h g−1 at 0.1C, when compared with C-LMFP (126 mA h g−1) and O-LMFP (120 mA h g−1). More strikingly, a discharge capacity of 122 at 5C was obtained for the N-LMFP, whereas it was 104, and 75 mA h g−1 for C-LMFP and O-LMFP, respectively. The rate capability of the N-LMFP sample was comparable with those for other Fe-substituted lithium manganese phosphate (LMP) cathode materials, especially at a high rate of 5C (Table S2, ESI†). Moreover, the N-LMFP sample possessed a higher discharge platform at high rates, which indicated its small polarization and transfer resistance. The results proved that the substitution of soluble Fe sources for Mn in the LiMnPO4/C materials contributed to the improved rate performance of materials due to the small particle size and the hierarchical structure. Nevertheless, the specific capacity of the N-LMFP was lower than that of the already reported LMP materials, which may be due to the low purity of the doped Fe(NO3)3·9H2O raw materials (Fig. S4, ESI†). To investigate the effect of Fe doping on alleviating the Jahn–Teller effect of Mn, the pure LMP material was prepared in the same way as the N-LMFP, except no Fe raw materials were added. As shown in Fig. S5 (ESI†), the pure LMP yielded a lower specific capacity of 122 mA h g−1 than the doped N-LMFP, and the Fe doping leading to the alleviated Jahn–Teller effect was responsible for this (Table S3, ESI†). It should be noted that the alleviated Jahn–Teller effect was based on the smaller change of the lattice parameter c in the N-LMFP after the discharge/charge process.47
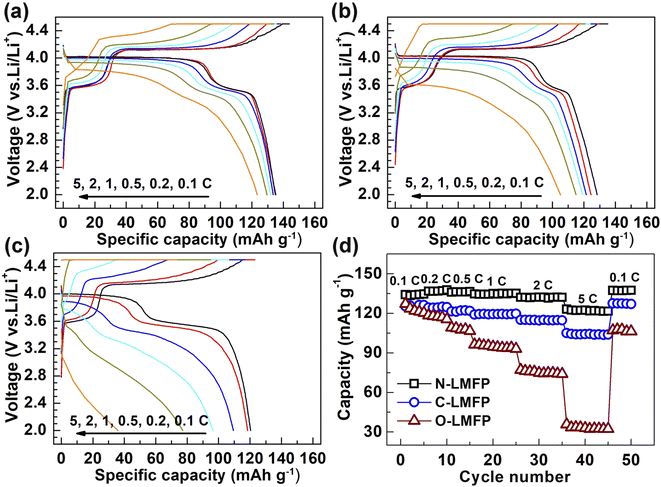 | ||
| Fig. 4 The charge/discharge curves for (a) N-LMFP/C, (b) C-LMFP/C, (c) O-LMFP/C and (d) their rate capabilities. | ||
The CV was measured to investigate the reversibility of the electrochemical reaction, as shown in Fig. 5a. It was observed that two pairs of sharp anodic and cathodic peaks at about 3.5 and 4.0 V corresponded to the redox reactions of the Fe2+/Fe3+ and Mn2+/Mn3, respectively, which was in agreement with the voltage platform in the charge/discharge curve. In addition, the N-LMFP showed the sharpest peak and the smallest potential difference with 0.30 V between the anodic and cathodic peaks when compared with C-LMFP (0.34 V), and O-LMFP (0.38 V), which indicated that there was fast Li+ diffusion and high reversibility of the N-LMFP. The fast kinetics and high reversibility gave the N-LMFP a superior cycling stability.48 As expected, the cycling performance shown in Fig. 5b showed a higher reversible capacity and better cycling stability of N-LMFP. The N-LMFP retained a specific capacity of 129 mA h g−1 with a capacity retention of 98.9% after 400 cycles at 2C, indicating its good cyclic stability. In comparison, the C-LMFP and O-LMFP showed deteriorating reversible capacity and capacity retention, and in particular the O-LMFP just retained 54 mA h g−1 with a capacity retention of 55.1% after 400 cycles.
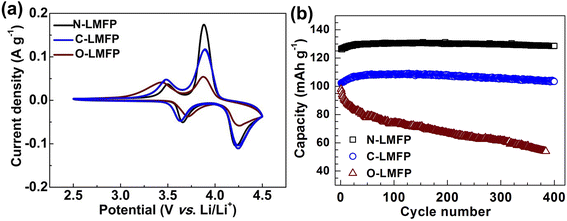 | ||
| Fig. 5 (a) The CV curves at a scan rate of 0.1 mV s−1 for the as-prepared samples, and (b) their cycling performances at 2C for 400 cycles. | ||
As is well known, it is difficult for the Fe2O3 to be reduced by carbon in the temperatures less than 700 °C, resulting in the low specific capacity of the LiFePO4 materials prepared with Fe2O3 as a raw material.49 Therefore, it was speculated that the deteriorating capacity of the O-LMFP may mainly be caused by the incomplete reduction of Fe2O3. In order to understand the origin for the improved rate performance and cycling stability of N-LMFP, the SEM and EDS analyses on the N-LMFP were performed after 200 cycles. In Fig. 6, the spherical morphology of the N-LMFP sample was almost maintained after the cycling, whereas the as-prepared pure LiMnPO4 (LMP/C) showed some agglomerates in the cross section of the powder after 200 cycles. A comparison of the EDS analyses (Fig. S6 and S7, ESI†) showed that the reduction of Mn content in the N-LMFP samples after recycling was lower than that of the LMP/C material, which indicating that the Fe doping can hinder the Mn ion dissolution in the electrolyte. In addition, it was observed that there was the emergence of a second phase MnPO4 after 200 cycles (Fig. S8, ESI†), and this was identified, by XRD analysis, to be MnPO4 (JCPDS no. 017-0838). The emergence of the MnPO4 may be attributed to no lithiation of a trace amount of MnPO4 caused by the resulting polarization at a high discharge rate of 2C. This result validates that the LiMnPO4 electrodes operates by a two-phase insertion/de-insertion process. Therefore, the higher reversible capacity and better cycling stability of N-LMFP could be attributed to the reduced Mn ion dissolution in the electrolyte.50,51
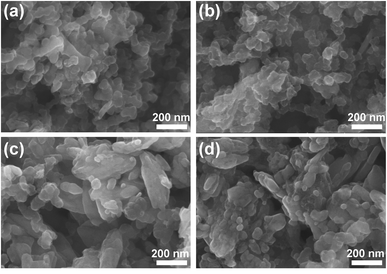 | ||
| Fig. 6 The SEM images of (a, b) N-LMFP/C and (c, d) LMP/C, (a, c) are before, and (b, d) are after 200 cycles at 2C. | ||
The EIS measurement was performed and the results are shown in Fig. 7 and S9 (ESI).† All the spectra consist of a semicircle in the high-to-medium frequency range and an angled line in the low frequency range (Ro), presenting a similar profile. The semicircle represents the interfacial charge transfer process (Rct), whereas the angled line denotes the Warburg impedance (Wo) which is related to the diffusion of lithium ions in the electrode.52 The corresponding parameters of these samples, recorded in Tables S4 and S5 (ESI),† were calculated according to the equation: DLi+ = R2T2/(2A2n4F4C2σ2) and Z′ = Rs + Rct + σω−1/2, where R, T, A, n, F, and C represent the gas constant, the temperature, the surface area of the electrodes, the number of electrons per molecule, the Faraday constant and the bulk concentration of lithium ions, respectively. The Warburg factor (σ) associated with Z′ can be determined by the linear fitting results of Z′ against ω−1/2 in the oblique line region. The Rct were 123.0, 150.7 and 279.7 Ω for N-LMFP, C-LMFP and O-LMFP samples, respectively, measured before the charge/discharge test. After 100 cycles, the N-LMFP merely yielded a Rct of 111.1 Ω, which was lower than those of the O-LMFP (150.1 Ω) and the C-LMFP (358.8 Ω), and indicated the better electronic conductivity of the N-LMFP. In addition, the N-LMFP had a DLi+ value of 9.54 × 10⁻¹³ cm2 s−1 after the 100th cycle, which was higher than those of O-LMFP (8.29 × 10⁻¹³ cm2 s−1) and C-LMFP (2.02 × 10⁻¹⁴ cm2 s−1), which was consistent with the results of the electrochemical performances.
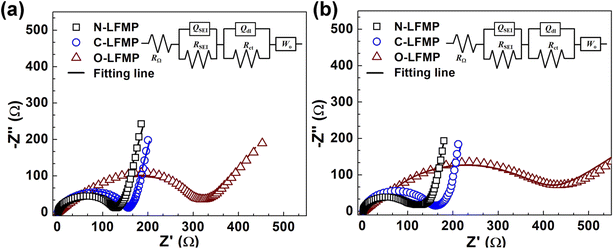 | ||
| Fig. 7 The electrochemical impedance spectroscopy of the as-prepared samples (a) before, and (b) after 100 cycles. | ||
4. Conclusions
In conclusion, an LiMn0.8Fe0.2PO4/C cathode material with a hierarchical structure was prepared by a rational solid-state method using soluble FeNO3 as the iron source. The results show that different iron sources markedly influence the structure and electrochemical performances of the LiMn0.8Fe0.2PO4/C material. The N-LMFP sample prepared using soluble FeNO3 as the iron source possesses an excellent rate performance of 122 mA h g−1 at 5C and maintains a higher specific capacity of 129 mA h g−1 for 400 cycles at 2C without any obvious capacity decay when compared with the C-LMFP and O-LMFP samples. This is attributed to the homogeneous fine particle dispersion and hierarchical structure, which alleviates the dissolution of Mn ions in the electrolyte in the repeated charge/discharge process. The strategy reported here provides a simple method for the boosted electrochemical performances of LiMnPO4 materials, and it could be extended as a strategy for other electrode materials.Conflicts of interest
The authors declare no conflict of interest.Acknowledgements
This work was supported by the Key Scientific and Technological Project of Henan Province (Grant No. 202102210215 and 222102240094), the Henan Postdoctoral Science Foundation (Grant No. 001802032), the Key Project of Science and Technology of Henan Educational Department (Grant No. 21B480003), and the Xinxiang Science and Technology Project (Grant No. GG2019011).References
- C. Masquelier and L. Croguennec, Chem. Rev., 2013, 113, 6552–6591 CrossRef CAS PubMed.
- V. Aravindan, J. Gnanaraj, Y. S. Lee and S. Madhavi, J. Mater. Chem. A, 2013, 1, 3518–3539 RSC.
- A. K. Padhi, K. S. Nanjundaswamy and J. B. Goodenough, J. Electrochem. Soc., 1997, 144, 1188–1194 CrossRef CAS.
- X. Cao, A. Pan, Y. Zhang, J. Li, Z. Luo, X. Yang, S. Liang and G. Cao, ACS Appl. Mater. Interfaces, 2016, 8, 27632–27641 CrossRef CAS PubMed.
- D. Di Lecce, R. Brescia, A. Scarpellini, M. Prato and J. Hassoun, ChemSusChem, 2016, 9, 223–230 CrossRef CAS PubMed.
- S.-N. Li, S.-H. Luo, L. Yang, Q. Wang, Y.-H. Zhang and X. Liu, Rare Met., 2021, 40, 3477–3484 CrossRef CAS.
- M. Zhao, Y. Fu, N. Xu, G. Li, M. Wu and X. Gao, J. Mater. Chem. A, 2014, 2, 15070–15077 RSC.
- H. Guo, C. Wu, L. Liao, J. Xie and S. Zhang, Inorg. Chem., 2015, 54, 667–674 CrossRef CAS PubMed.
- J. Moskon, M. Pivko, I. Jerman, E. Tchernychova, N. Z. Logar, M. Zorko, V. S. Selih, R. Dominko and M. Gaberscek, J. Power Sources, 2016, 303, 97–108 CrossRef CAS.
- W. Huang, J. Hu, L. Yang, W. Zhao, Z. Wang, H. Wang, Z. Guo, Y. Li, J. Liu and K. Yang, ACS Appl. Mater. Interfaces, 2018, 11, 957–962 CrossRef PubMed.
- H. Fang, H. Yi, C. Hu, B. Yang, Y. Yao, W. Ma and Y. Dai, Electrochim. Acta, 2012, 71, 266–269 CrossRef CAS.
- Y. Wang, H. Yang, C.-Y. Wu and J.-G. Duh, J. Mater. Chem. A, 2017, 5, 18674–18683 RSC.
- X.-Y. Lv, Q.-Y. Huang, Z. Wu, J. Su, Y.-F. Long and Y.-X. Wen, J. Solid State Electrochem., 2017, 21, 1499–1507 CrossRef CAS.
- R. Li, C. L. Fan, W. H. Zhang, M. C. Tan, T. T. Zeng and S. C. Han, Ceram. Int., 2019, 45, 10501–10510 CrossRef CAS.
- R. El Khalfaouy, S. Turan, K. B. Dermenci, U. Savaci, A. Addaou, A. Laajeb and A. Lahsini, Ceram. Int., 2019, 45, 17688–17695 CrossRef CAS.
- F. A. Vasquez and J. A. Calderon, Electrochim. Acta, 2019, 325, 134930–134939 CrossRef CAS.
- R. J. Wang, J. Y. Zheng, X. M. Feng, G. Yao, H. T. Niu, Q. Y. Liu and W. H. Chen, J. Solid State Electrochem., 2020, 24, 511–519 CrossRef CAS.
- J. L. Li, Y. Wang, J. H. Wu, H. Zhao and H. Liu, J. Alloys Compd., 2018, 731, 864–872 CrossRef CAS.
- L. Yang, Y. Xia, X. Fan, L. Qin, B. Qiu and Z. Liu, Electrochim. Acta, 2016, 191, 200–206 CrossRef CAS.
- L. W. An, H. Liu, Y. Y. Liu, Z. F. Li, X. Ren and G. C. Liang, J. Alloys Compd., 2018, 767, 315–322 CrossRef CAS.
- S. Liu, H. Fang, B. Yang, Y. Yao, W. Ma and Y. Dai, J. Power Sources, 2013, 230, 267–270 CrossRef CAS.
- J. Duan, Y. Cao, J. Jiang, K. Du, Z. Peng and G. Hu, J. Power Sources, 2014, 268, 146–152 CrossRef CAS.
- J. Liu, W. Liao and A. Yu, J. Alloys Compd., 2014, 587, 133–137 CrossRef CAS.
- H. Manjunatha, T. V. Venkatesha and G. S. Suresh, J. Solid State Electrochem., 2012, 16, 1941–1952 CrossRef CAS.
- D. Choi, D. Wang, I.-T. Bae, J. Xiao, Z. Nie, W. Wang, V. V. Viswanathan, Y. J. Lee, J.-G. Zhang and G. L. Graff, Nano Lett., 2010, 10, 2799–2805 CrossRef CAS PubMed.
- L. Bao, Y. Chen, G. Xu, T. Yang and Z. Ji, Eur. J. Inorg. Chem., 2018, 2018, 1533–1539 CrossRef CAS.
- J. Zhang, S. Luo, Q. Wang, Z. Wang, A. Hao, Y. Zhang, Y. Liu, Q. Xu and Y. Zhai, J. Alloys Compd., 2017, 701, 433–438 CrossRef CAS.
- L. Hu, B. Qiu, Y. Xia, Z. Qin, L. Qin, X. Zhou and Z. Liu, J. Power Sources, 2014, 248, 246–252 CrossRef CAS.
- B. Zou, R. Yu, M. Deng, Y. Zhou, J. Liao and C. Chen, RSC Adv., 2016, 6, 52271–52278 RSC.
- A. Lanjan, B. G. Choobar and S. Amjad-Iranagh, J. Solid State Electrochem., 2020, 24, 157–171 CrossRef CAS.
- J. Yang, R. Tan, D. Li, J. Ma and X. Duan, Chem.–Eur. J., 2020, 26, 5341–5346 CrossRef CAS PubMed.
- J. Hong, F. Wang, X. Wang and J. Graetz, J. Power Sources, 2011, 196, 3659–3663 CrossRef CAS.
- J. Xiong, Y. Wang, Y. Wang, Z. Li and J. Zhang, Ceram. Int., 2017, 43, 3190–3195 CrossRef CAS.
- J. Chen, D. Zhang, J. Qiao and C. Chang, Ionics, 2018, 24, 689–696 CrossRef CAS.
- J. Z. Li, S. H. Luo, X. Y. Ding, Q. Wang and P. He, ACS Appl. Mater. Interfaces, 2018, 10, 10786–10795 CrossRef CAS PubMed.
- L. Liang, X. Sun, J. Zhang, L. Hou, J. Sun, Y. Liu, S. Wang and C. Yuan, Adv. Energy Mater., 2019, 9, 1802847–1802861 CrossRef.
- L. Liang, X. Li, F. Zhao, J. Zhang, Y. Liu, L. Hou and C. Yuan, Adv. Energy Mater., 2021, 11, 2100287–2100303 CrossRef CAS.
- F. Zhao, X. Li, Y. Yan, M. Su, L. Liang, P. Nie, L. Hou, L. Chang and C. Yuan, J. Power Sources, 2022, 524, 231035–231048 CrossRef CAS.
- J. Su, Z.-Z. Liu, Y.-F. Long, H. Yao, X.-Y. Lv and Y.-X. Wen, Electrochim. Acta, 2015, 173, 559–565 CrossRef CAS.
- J. Zhang, S. Luo, L. Chang, A. Hao, Z. Wang, Y. Liu, Q. Xu, Q. Wang and Y. Zhang, Appl. Surf. Sci., 2017, 394, 190–196 CrossRef CAS.
- Z. Dai, L. Wang, F. Ye, C. Huang, J. Wang, X. Huang, J. Wang, G. Tian, X. He and M. Ouyang, Electrochim. Acta, 2014, 134, 13–17 CrossRef CAS.
- Y. Ren and P. G. Bruce, Electrochem. Commun., 2012, 17, 60–62 CrossRef CAS.
- B. Wang, B. H. Xu, T. F. Liu, P. Liu, C. F. Guo, S. Wang, Q. M. Wang, Z. G. Xiong, D. L. Wang and X. S. Zhao, Nanoscale, 2014, 6, 986–995 RSC.
- Y. Xing, B. Fang, A. Bonakdarpour, S. Zhang and D. P. Wilkinson, Int. J. Hydrogen Energy, 2014, 39, 7859–7867 CrossRef CAS.
- B. Fang, L. Daniel, A. Bonakdarpour, R. Govindarajan, J. Sharman and D. P. Wilkinson, Small, 2021, 17, 2102288–2102298 CrossRef CAS PubMed.
- L. Yang, S. Luo, Y. Wang, Y. Zhan, Q. Wang, Y. Zhang, X. Liu, W. Mu and F. Teng, Chin. Chem. Lett., 2020, 31, 3200–3204 CrossRef CAS.
- Z.-F. Huang, X. Meng, C.-Z. Wang, Y. Sun and G. Chen, J. Power Sources, 2006, 158, 1394–1400 CrossRef CAS.
- R. Mei, Y. Yang, X. Song, Z. An and J. Zhang, Electrochim. Acta, 2016, 218, 325–334 CrossRef CAS.
- B. Rong, Y. Lu, X. Liu, Q. Chen, K. Tang, H. Yang, X. Wu, F. Shen, Y. Chen, Y. Tang and Y. Chen, Nano Energy, 2014, 6, 173–179 CrossRef CAS.
- O. K. Park, Y. Cho, S. Lee, H. C. Yoo, H. K. Song and J. Cho, Energy Environ. Sci., 2011, 4, 1621–1633 RSC.
- Z.-X. Chi, W. Zhang, X.-S. Wang, F.-Q. Cheng, J.-T. Chen, A.-M. Cao and L.-J. Wan, J. Mater. Chem. A, 2014, 2, 17359–17365 RSC.
- Y. Li, Y. Zhang, J. Ma, L. Yang, X. Li, E. Zhao, S. Fan, G. Xu, S. Yang and C. Yang, J. Electrochem. Soc., 2019, 166, A410–A415 CrossRef CAS.
Footnote |
| † Electronic supplementary information (ESI) available. See https://doi.org/10.1039/d2ra04427g |
| This journal is © The Royal Society of Chemistry 2022 |

