 Open Access Article
Combining multiple acquisition modes and computational data annotation for structural characterization in traditional Chinese medicine: Miao Nationality medicine Qijiao Shengbai Capsule as a case study†
Chi Ma a,
Yuhao Zhang
 c,
Xiuxiu Doua,
Li Liud,
Weidong Zhang
 *abc and
Ji Ye*b
aInstitute of Interdisciplinary Integrative Medicine Research, Shanghai University of Traditional Chinese Medicine, Shanghai, 201203, China. E-mail: wdzhangy@hotmail.com; Tel: +86 021 81871244
bSchool of Pharmacy, Naval Medical University, Shanghai 200433, China. E-mail: catheline620@163.com; Tel: +86 021 81871248
cSchool of Traditional Chinese Pharmacy, China Pharmaceutical University, Nanjing, 211198, China
dGuizhou Hanfang Pharmaceutical Co., Ltd., Guizhou 550014, China
First published on 29th September 2022
Abstract
Qijiao Shengbai Capsule (QSC) is a reputable Miao Nationality medicine used for treating leukopenia, but its chemical composition has not yet been elucidated. We herein present a strategy, by integrating multiple data acquisition, computational data annotation and processing methods to visualize and identify the complicated constituents in QSC based on ultra-high-performance liquid chromatography coupled with traveling wave ion mobility quadrupole time-of-flight mass spectrometry (UPLC-TWIMS-QTOF-MS). The multiple data acquisition modes, including data-independent mass spectrometryEnergy (MSE), data-independent high-definition mass spectrometryEnergy (HDMSE), and fast data-dependent acquisition (fast-DDA), in both positive and negative ion modes, were conducted on a Waters-SYNAPT G2-Si mass spectrometer with an ESI source. An in-house library built by the UNIFI platform could efficiently process the peak annotation of known compounds, whilst different structural types were clustered in the molecular networks for the analogous classification and structural annotation of the unknown ones. Neutral loss, diagnostic ions, feature fragmentation behaviors, and community curation of mass spectrometry data of known compounds helped exploit those similar neighboring nodes of unknown compounds. Moreover, by combination of the predicted CCS values from CCS platform with the experimental CCS values from HDMSE, as well as diagnostic fragment ions, isomer compounds were annotated. By integrating reference compound comparison, a total of 202 constituents, including 94 flavonoids, 12 saponins, 30 phthalides, 38 organic acids, 3 amino acids, 7 alkaloids and 18 others, were unambiguously characterized or tentatively identified in QSC. Among them, 5 potential new compounds were detected and 12 pairs of isomers were comprehensively distinguished. Conclusively, the established multiple acquisition modes, computational data processing and analysis strategy proved to be useful for the in-depth structural identification of QSC.
Introduction
Due to the advantages of allopathic treatment and minimal toxic side effects, traditional Chinese medicine (TCM) has been used as an alternative therapy for the prevention and treatment of diseases. Tibetan, Uyghur, Mongolian, and Miao national minority medicines assembled by unique regional experiences and distinctive cultural characteristics, have played prominent roles in TCM for the prevention and treatment of diseases for hundreds of years in China.1–4 Despite numerous clinical investigations demonstrating their efficacy, research into the active ingredients of ethnic medicines is still lacking, thus severely limiting the secondary development and application.The development of analytical technologies has been recognized as an effective method to comprehensively investigate different polarities, contents, and molecular masses of plant metabolites in TCM. Currently, ultra-high-performance liquid chromatography coupled with quadrupole time-of-flight mass spectrometry (UPLC-QTOF-MS) is the most preferred choice for the characterization of the primary or secondary metabolites in complex matrices of herbal plants.5–7 Data-dependent acquisition (DDA)8 and data-independent acquisition (DIA)9 are the two most commonly used data acquisition modes for yielding the cleaner precursor-product links of the top N most intense MS peak and the higher coverage of all the MS/MS information of the observing components, respectively. The individual usage of the above acquisition modes has the limitation of ignoring some minor trace compounds or interpreting the co-eluting ions. Therefore, integrated DIA and DDA acquisition modes, which could produce complementary mass spectrometry information from each other, were applied for the comprehensive characterization of compounds from herbal medicines.10 Moreover, considering that natural herbal medicines often contained the identical structures of isomers with similar chromatographic retention behaviors that could hardly be separated or detected by common modes of the instrument, the ion mobility model was introduced as an additional dimension of ions separation based on their charge state, size and shape.11
The exploitation of mass spectrometry data in different scan modes offers the opportunity to analyze chemical components from multiple perspectives. With the progress of computer-aided composition analysis techniques, mass spectrometry data annotation tools have been developed for showing the intuitive results of the data and replacing the laborious manual work. Taking the advantages of multiple data processing methods in UNIFI software, which includes Common Fragmentation Search (CFS), Extracted Ion Chromatogram (EIC), Mass Defect Filter (MDF) and Neutral Loss Scan (NLS),12 known constituents could be rapidly assigned and identified by comparison their MS and MS/MS information with the self-built database.13 Global natural products social molecular networking (GNPS, https://gnps.ucsd.edu) can form a visual molecular network through fast-DDA mass spectrometry data processing, and the correlation of individual nodes becomes a prominent mean of inferring unknown compounds.14 In addition, ALLCCS was a commonly used platform for providing the theoretical value of potential collision cross sections (CCS) during structural characterization of the isomers.15,16 By integrating the above computational data annotation and process platforms with various acquisition modes, accuracy and efficiency for clarifying the chemical composition in the complex system would be dramatically increased.
Qijiao Shengbai Capsule (QSC) is a well-known Miao Nationality medicine in China that consists of seven Chinese medicines, including Indigofera stachyoides Lindl. (IS, Xue Renshen), Astragalus membranaceus (Fisch.) Bge. var. mong-holicus (Bge.) Hsiao (AM, Huang Qi), Equus asinum L. (EA, E Jiao), Angelica sinensis (Oliv.) Diels (AS, Dang Gui), Ziziphus jujuba Mill. (ZJ, Da Zao), Sophora flavescens Ait. (SF, Ku Shen) and Epimedium brevicornu Maxim. (EB, Yin Yanghuo) with a ratio of 3![[thin space (1/6-em)]](https://www.rsc.org/images/entities/char_2009.gif) :
:![[thin space (1/6-em)]](https://www.rsc.org/images/entities/char_2009.gif) 6
6![[thin space (1/6-em)]](https://www.rsc.org/images/entities/char_2009.gif) :
:![[thin space (1/6-em)]](https://www.rsc.org/images/entities/char_2009.gif) 2
2![[thin space (1/6-em)]](https://www.rsc.org/images/entities/char_2009.gif) :
:![[thin space (1/6-em)]](https://www.rsc.org/images/entities/char_2009.gif) 2
2![[thin space (1/6-em)]](https://www.rsc.org/images/entities/char_2009.gif) :
:![[thin space (1/6-em)]](https://www.rsc.org/images/entities/char_2009.gif) 2
2![[thin space (1/6-em)]](https://www.rsc.org/images/entities/char_2009.gif) :
:![[thin space (1/6-em)]](https://www.rsc.org/images/entities/char_2009.gif) 2
2![[thin space (1/6-em)]](https://www.rsc.org/images/entities/char_2009.gif) :
:![[thin space (1/6-em)]](https://www.rsc.org/images/entities/char_2009.gif) 3. It has been patented for treating leukopenia in clinic and is capable of increasing vitality and ameliorating anemia.17 Modern pharmacological study showed that it has effectiveness on adjusting immune.18,19 To the best of our knowledge, no systematic chemical composition studies on QSC have been published.
3. It has been patented for treating leukopenia in clinic and is capable of increasing vitality and ameliorating anemia.17 Modern pharmacological study showed that it has effectiveness on adjusting immune.18,19 To the best of our knowledge, no systematic chemical composition studies on QSC have been published.
The aim of our current work was to integrate multiple data acquisition modes of MSE, fast-DDA and HDMSE on a powerful traveling wave ion mobility TOF-MS coupled with UPLC and data processing of UNIFI, molecular networking, CCS platforms for systematic profiling and annotating of known, unknown components and their co-eluting isomers from QSC. This is the first study on comprehensive chemical composition analysis of QSC, which will be beneficial for the further development of the guidelines for controlling its quality and the interpretation of its inherent pharmacology and mechanism of action on treating leukopenia.
Experimental
Materials
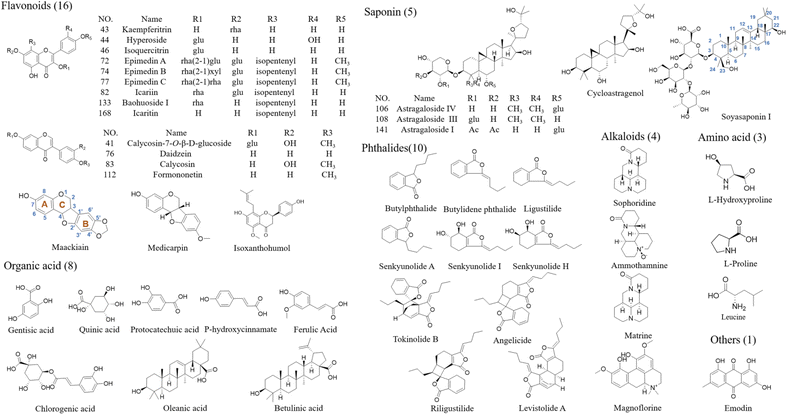
A total of 47 reference compounds were used in the qualitative identification of compounds in QSC. L-Hydroxyproline, protocatechuic acid, daidzein, emodin and ferulic acid were purchased from National Institutes for Food and Drug Control (Beijing, China). L-Proline, leucine, sophoridine, quinic acid and chlorogenic acid were purchased from Shanghai Ruiding Chemical Co., Ltd. (Shanghai, China). Ammothamnine, hyperoside, icariin, soyasaponin I and icaritin were purchased from Shanghai Liding Biotech Co., Ltd. (Shanghai, China). Gentisic acid, oleanic acid and p-hydroxycinnamate were purchased from Shanghai Adamas Biotech Co., Ltd. (Shanghai, China). Isoxanthohumol was purchased from Sigma Aldrich (Sigma, St. Louis, MO). Medicarpin and calycosin-7-O-β-D-glucoside were purchased from Shanghai Tauto Biotech Co., Ltd. (Shanghai, China). Matrine, epimedin A, epimedin B, epimedin C, astragaloside IV, astragaloside III and astragaloside I were purchased from Shanghai Chenguang Biotech Co., Ltd. (Shanghai, China). Magnoflorine, calycosin and betulinic acid were purchased from Shanghai Yuanye Biotechnology Co., Ltd. (Shanghai, China). Kaempferitrin, isoquercitrin, senkyunolide I, senkyunolide H, senkyunolide A, cycloastragenol and ligustilide were purchased from Sichuan Weikeqi Biotech Co., Ltd. (Sichuan, China). Formononetin and baohuoside I were purchased from Mansite Pharmaceutical Technology Co., Ltd. (Chengdu, China). Tokinolide B, riligustilide, angelicide, levistolide A, maackiain, butylidene phthalide and butylphthalide were purchased from Desite Pharmaceutical Technology Co., Ltd. (Chengdu, China). All reference standards were determined with the purities of more than 95% by HPLC, and their structural information is presented in Fig. 1. QSC samples (lot number: 2520029) and its seven herbal medicines were generously provided by Guizhou Hanfang Pharmaceutical Co., Ltd. (Guiyang, China). LC-MS grade acetonitrile, formic acid, water and methanol were purchased from Fisher Scientific Co. (Fair Lawn, NJ, USA); leucine enkephalin was obtained from Sigma-Aldrich (St. Louis, MO, USA). All the other reagents were of analytical grade.Samples and reference solutions preparation
Stock solutions of 47 reference compounds were dissolved in appropriate amount of methanol to produce the concentration of each of 1 mg mL−1, and were stored at 4 °C until analysis. Then, we dilute them with 80% methanol to produce a mixture solution containing approximately 50 μg of each per mL as the reference solution before injection.The outer layer of QSC was removed, and the seven crude drug materials were separately pulverized to fine powders (pass through a 40-mesh sieve). 5.0 g of each of QSC and the above-mentioned powders were weighed accurately and then were ultrasonically extracted by 50 mL of 80% methanol (power 300 W, frequency 40 kHz) at room temperature for 45 minutes, respectively, yielding the test solutions of QSC and seven individual crude drugs. All the reference solutions and test solutions were centrifuged at 12![[thin space (1/6-em)]](https://www.rsc.org/images/entities/char_2009.gif) 000 rpm for 10 min, and the supernatant was stored at 4 °C before analysis.
000 rpm for 10 min, and the supernatant was stored at 4 °C before analysis.
Liquid chromatographic analysis condition
The chromatographic analysis of QSC was obtained using an ACQUITY UPLC I-class system (Waters, Milford, MA, USA) equipped with a binary solvent delivery system, an autosampler, a degasser and a thermostat column compartment. The separation of samples was performed on a Waters ACQUITY HSS T3 C18 reversed phase column (2.1 mm × 150 mm, 1.8 μm, Waters, Milford, MA, USA). The mobile phase was consisted of 0.1% formic acid in water (v/v, A) and acetonitrile (B) with gradient elution: 0–2.0 min, 8–8% B; 2.0–10.0 min, 8–30% B; 10.0–18.0 min, 30–50% B; 18.0–20.0 min, 50–65% B; 20.0–30.0 min, 65–100% B; 30.0–30.1 min, and then equilibrated at 8% for three minutes. The flow rate was kept at 0.25 mL min−1. The column temperature and autosampler temperature were maintained at 35 °C and 4 °C, respectively. The injection volume was set as 2 μL.Mass spectrometry conditions
Structural database construction of QSC
The database of QSC was built at UNIFI platform by searching literature and online databases of CNKI, PubMed, ChemSpider, PubChem, Sci-finder, Chemical Book, and Web of Science. As a result, a self-built database of which containing compound name, chemical structure, molecular formula and precise molecular weight information for a total of 927 chemical components in the seven Chinese medicines of QSC was initially constructed. The database was apt to provide adequate MS and MS/MS ions information for the further qualitative analysis.UNIFI parameters for MSE and HDMSE
For analyzing the data under MSE acquisition mode, the retention time (RT) range was set at 0.1–33.0 min, with the tolerance of ± 0.2 min. The mass range was 50–1200 Da and the mass accuracy tolerance was set at ±5 ppm. The adducts of +H, +Na, −e and −H, +COOH were selected in positive ion mode and negative ion mode, respectively. The peak intensities of low energy over 1000 counts and high energy over 300 counts were optimized as parameters in 3-dimensional peak detection.For analyzing the data under HDMSE acquisition mode, the RT started at 1.0 minutes and ended at 33.0 minutes. The mass range in high collision energy was started at 50 Da and ended at 800 Da, and in low collision energy was started at 50 Da and ended at 350 Da. The intensity threshold was optimized at 10 counts. The target match tolerance was tuned at 20 ppm. The fragment match tolerance was set at 30 ppm. The collision cross section tolerance was limited as 2.0%.
Molecular network parameters
In the GNPS platform, the precursor ion mass tolerance was set to 2.0 Da and a MS/MS fragment ion tolerance of 0.5 Da. The ion filtering window for all MS/MS fragments of precursor m/z was ±17 Da, while the filtering window for MS/MS spectrum was ±50 Da. The matched peaks and the cosine score were set to be more than 6.0 and 0.7, respectively. The maximum size of a molecular family was set to 100. The molecular network was generated and downloaded from the platform.Collision cross sections condition
where μ is the reduced mass of the ion and calculated by (mion × mgas)/(mion + mgas), mion and mgas are the molecular masses of the analyte ion and drift gas, respectively. κB is the Boltzmann constant, T is the temperature, z is the electron charge, e is the unit charge capacity, N is the number density of particles and K is a constant related to an electron charge. The accurate CCS values of the candidate isomers were then calculated automatically by the equation.
Data processing software
Mass spectrometry data acquisition was progressed in MassLynx V4.1 software. UNIFI™ version 1.8.0 (Waters, Manchester, UK) was applied to handle the processing and analysis of MSE and HDMSE mass spectrometry data to obtain match values for known compounds and CCS values of the target compounds, respectively. ALLCCS was employed to predict the CCS value of target compounds. Cytoscape 3.7.1 was utilized to analyze the molecular network downloaded from GNPS.The integrative research strategy and compound characterization
In order to fully capture the mass spectrometry data for multicomponent characterization, we use combined acquisition methods under MSE, HDMSE and fast-DDA modes. Moreover, aiming to enhance the analysis efficiency and accuracy, the computational data annotation with UNIFI, GNPS and ALLCCS platforms were utilized (Fig. 2). The first step is to import the MSE mass spectrometry data into the UNIFI platform and use the self-built in-house database to rapidly analyze the known chemical components of QSC. Next, fast-DDA mass spectrometry data was uploaded to the GNPS network platform and Cytoscape was used to analyze the correlation between adjacent nodes in the molecular network. The information of RT, m/z, and MS/MS for each node was used to predict unknown compounds. Finally, the qualitative identification of isomers was achieved by comparing the predicted CCS values of the target compounds on the ALLCCS platform with the measured CCS values obtained from HDMSE mass spectrometry data. The three-step analytical strategy allows for a thorough examination of known and novel compounds as well as isomers in QSC.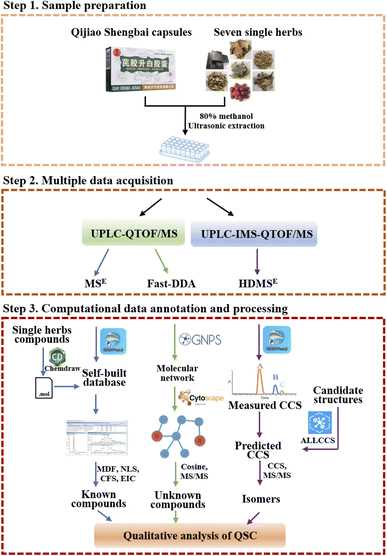 | ||
| Fig. 2 A workflow for multiple data acquisition and computational annotation of the chemical composition of QSC. | ||
Results and discussion
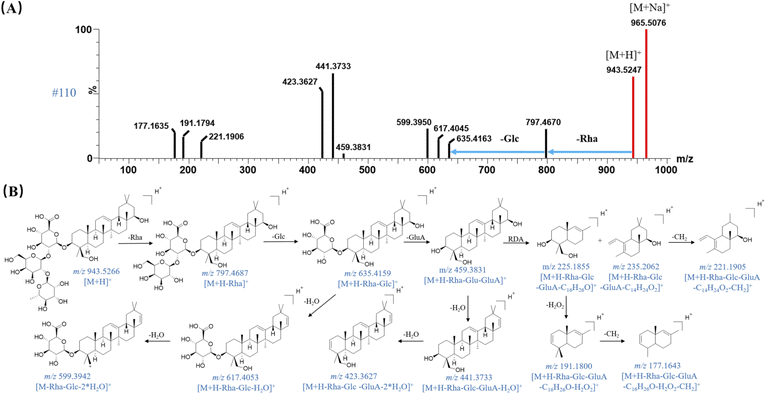
According to the established strategy, chemical profiling of QSC were analyzed both in positive and negative ion modes by using UPLC-TWIMS-QTOF-MS. A total of 202 chemical components were detected, including 94 flavonoids, 12 saponins, 30 phthalides, 38 organic acids, 3 amino acids, 7 alkaloids and 18 other compounds. By comparison of RT, fragment ions and characteristic molecular ions with the reference substance, 47 compounds of them were unambiguously identified. The representative base peak chromatograms (BPCs) and mass spectral molecular networks are shown in Fig. 3 and S1.† Table S1† displays the detailed information of each compound in QSC, including compound name, RT, formula, source, adduct ion, observed m/z, mass error and fragment ions.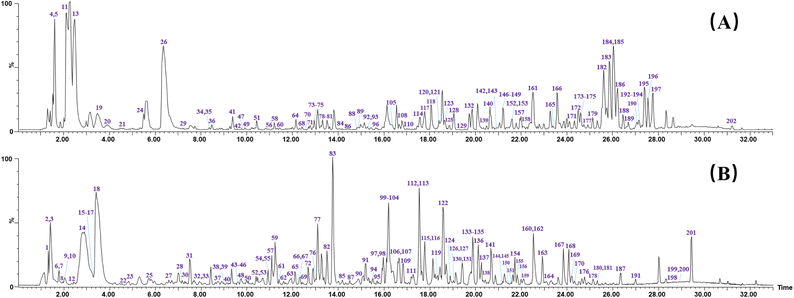 | ||
| Fig. 3 The representative base peak chromatograms (BPCs) chromatogram of QSC by UPLC-QTOF-MSE in positive (A) and negative (B) ion modes. | ||
Multi-components annotation from QSC by analyzing MSE in both positive and negative ionization modes
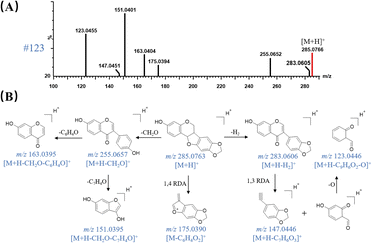
MSE has an advantage of the high coverage of precursor ions, therefore, producing abundant precursor-to-fragment ions of each compound in the raw UPLC-QTOF-MS profiles of QSC. By automatically searching the m/z, RT and MS/MS spectrum data in self-built databases in UNIFI software, multiple mass spectrometry data were processed and the proposed known compounds were sorted by scoring through matching with the self-built in-house library. Efficient neutral loss (NL) and feature fragmentation diagnostic strategies were then applied to rapidly confirm the structures of the matched candidates. As a result, a total of 155 compounds, including 87 flavonoids, 12 saponins, 26 organic acid, 10 phthalides, 3 amino acids, 7 alkaloids and 10 others were initially screened and 47 of them were tentatively confirmed by comparing their accurate mass measurements of MS, MS/MS and RTs with those of reference compounds.Peak 123 (RT = 18.70 min) was taken as an example to elucidate the detection procedure and detailed fragmentation pathway of a derivative of isoflavanone. It showed a quasi-molecular [M + H]+ ion at m/z 285.0766 in MS scan mode. By matching with the in-house database in UNIFI platform, it was assumed as a known compound named maackiain, showing the molecular formula of C16H12O5 with mass error of 1.05 ppm. Fig. 1 exhibits the chemical structure of maackiain and Fig. 4A presents its corresponding MS/MS spectra under proper collision energy. A serial of fragment ions at m/z 255, 175, 163, 151, 123, which were originated from the experiment, could be matched accurately with those proposed by computer with masse errors below 5 ppm. As shown in Fig. 4B, the B-ring side chain is apt to be opened, producing the [M + H – CH2O]+ ion at m/z 255. Then, the fragment ions at m/z 163 indicated the subsequent cleavage of the B-ring, which was consistent with the fragmentation behavior of flavonoid. When the substitution of hydroxyl on B ring, the cleavage of C ring is easy to be occurred.21 The m/z value obtained in the MS/MS for this ion is 151, which can be explained by opening the C-ring and the cleavage following by H atom transfer coming from C-2 position. On the other hand, after the loss of two H atoms from the precursor ion, the RDA cleavages at 1,3A- 1,3B-position were happened, giving rise to one fragment ions at m/z 147. Expel an oxygen atom (16 Da) was subsequently observed, leading to the production of daughter ion at m/z 123. We presumed it might be resulting from the fragment ion at m/z 139, another RDA product ions from m/z 283. The other pathways of maackiain also underwent the RDA cleavage at 1,4A- 1,4B-position, yielding the major product ions at m/z 175; this procedure was considered as a more stable chemical structure because it has a much higher peak abundance. Based on the MS/MS spectra and retention behavior with standards compound and literature,23 it was confirmed as maackiain and tentatively assigned to Miao Nationality herbal medicine named IS.
Isopentenyl type flavonoids were observed at high abundance in QSC, which were mainly originated from EB and SF. The presence of one or more isopentenyl groups (C5H8) is the most characteristic side chain of isopentenyl flavonoids. Due to the structural characteristics, the successively neutral loss of one or several isopentenyl group and its corresponding substituents were considered as the main fragmentation behaviors of this type components.24 For example, peak 82 showed [2M + Na]+ ion at m/z 1375.4617 in the full mass spectra scan, with RT of 13.52 min. It was identified by UNIFI platform as icariin with the elemental composition of C33H40O15 and the mass error of −1.09 ppm. Its MS and MS/MS spectra showed two fragment ions at m/z 531 and 369 (Fig. S2A†), which were attributed to the neutral losses of rhamnose (Rha) and glucoside (Glc), respectively. It is worthy to note that the fragment ion at m/z 369 is apt to loss isopentenyl group of C5H8 (68 Da) and C4H7 (56 Da) at C-8 position, giving rise to the product ion at m/z 301 and 313, respectively. Then, the product ions at m/z 255 can be explained by the loss of a CH2O2 (46 Da) from ion at m/z 301. The proposed fragmentation pathway of icariin was shown in Fig. S2B.† It was tentatively confirmed by comparing their accurate mass measurements of MSE spectra and RTs with the reference compound. Thus, peak 82 was unambiguously identified as icariin.
Structural characterization of unknown compounds by molecular networks
After searching the in-house library or public databases, some of the untargeted compounds have not been annotated as the known compounds, and they were assumed to be presumed as unknown components. GNPS, an open-access knowledge platform, was able to process fast-DDA mass spectrometry data with creating a molecular network, in which the similarity of adjacent nodes has proven to be an effective tool for predicting new compounds.14,16 The GNPS platform has the advantage of integrating mass spectrometry data and visualizing the results, which has greatly facilitated the discovery of new compounds and reduced research time. GNPS first simplifies and merges the fast-DDA mass spectrum data and then reduces the pre-processed mass spectrum to vectors in a multi-dimensional normalized space where each dimension is assigned an m/z value and its respective intensity.30 What's more, the results of these vector-based comparisons on GNPS can be visualized as a molecular network31 in which compounds with similar structures are tend to cluster together for facilitating analysis.Those vectors are used to calculate the cosine score between each pair of potentially consistent mass spectra, allowing the determination of the degree of spectral similarity between them. The cosine score ranged from 0 to 1, and the closer the cosine is to 1, the more similar the spectrum is.32 Finally, different fragment ions and RTs between adjacent nodes were used to identify chemical structures. As a result, 13 compounds in QSC, including 4 flavonoids, 8 organic acids, and 1 other, were screened out and tentatively identified by neutral losses, diagnostic fragment ions, feature fragmentation behaviors, and community curation of mass spectrometry data of known compounds. Three of them were reported for the first time.
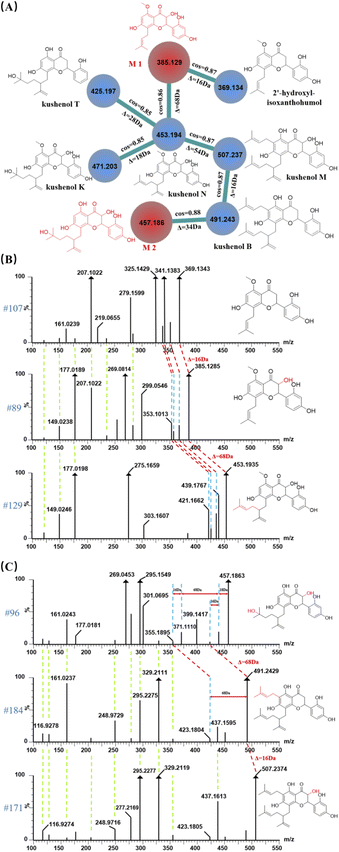
Compounds in the same structural type were apt to undergoing similar fragmentation behaviors. Due to the comparable mass spectral information and characteristic fragment ions, those compounds can easily aggregate in molecular networks to form a cluster on GNPS platform. Using known compounds as a starting point, clusters of different type compounds were effectively discovered and unknown compounds with highly similar structure in each cluster were preliminarily identified. Peak 89 and peak 96 (the red nodes), who can hardly be identified by searching with in-house database in UNIFI platform, were taken as examples for clarifying their structures. Luckily, they were gathered in a same cluster in molecular network (Fig. 6A), implying the high similarity of their molecular structural. The adjacent nodes of m/z 385 were assigned as two known compounds (the blue nodes) with the base peak at m/z 453 (peak 129) and m/z 369 (peak 107), which have been identified as kushenol N33 and 2′-hydroxy-isoxanthohumol34 by searching with the in-house databases in UNIFI platform (Table S1†). Furthermore, the cosine scores of those adjacent nodes were 0.86 and 0.87, indicating the high consistent of molecular structure. The molecular weight difference between them is 68.0650 Da and 15.9942 Da, which were presumed as the structural of the isopentenyl group and hydroxyl group, respectively. Moreover, the difference of masses (68 Da and 16 Da) were also existed between multiple pairs of fragment ions, as well as the same low molecular weight fragment ions in the three compounds (Fig. 6B), indicating that they might be the same structural type compound with the similar fragmentation behavior. According to the previously published literature,35 the C-3 position is more apt to having the linkage of hydroxyl group rather than other positions. Thus, the chemical structure of peak 89 with quasi-molecular ion at m/z 385 can be preliminarily identified as M1 (3,2′-di-hydroxyl-isoxanthohumol, as shown in Fig. 6A), with the molecular formula of C21H22O7 [M − H]− and the mass error of −0.52 ppm.
Node at m/z 457 (peak 96) was adjacent to node at m/z 491 (peak 184), which was identified as kushenol B in UNIFI platform, with the molecular formula of C30H36O6 [M − H]− and the mass error of −1.02 ppm. A series of fragment ions at m/z 116, 128, 161, 248, 279, 295, 329, 355 (Fig. 6C) were both found in peak 96 and 184, implying those two compounds share the same skeleton and have high similarity in their structures. Fragment ion at m/z 423.1804 was produced due to the neutral loss of isopentenyl group with mass of 68.0626 Da for peak 184, which was in agreement with fragmentation behavior in peak 96. However, the difference in molecular weight between them was 34.0566 Da instead of 68.0626 Da, indicating the presence of some other substituent groups. By searching the MS/MS of peak 96, a relatively weak fragment ion at m/z 439.1748 was found, which was 18 Da less than m/z 457 and was corresponded to the subsequent neutral losses of H2O. Furthermore, the m/z 423 ion was produced by expelling an oxygen atom from the fragment ion of m/z 439, presuming the existent of another hydroxyl group. According to the literature,35 the double bond in the isopentenyl group at C-2′ position was apt to undergo an addition reaction with H2O to form a hydroxyl group resulting in an increase in molecular weight of 18 Da. It is worth noting that isopentenyl groups are more apt to be expelling at C-6 position than other positions C-2′ position. Using the above evidences together with the information of molecular network, peak 96 could unambiguously be identified as M2 (as shown in Fig. 6A), with the chemical formula of C25H30O8 ([M − H]−) and a mass error of 0.22 ppm.
The annotation of isomer with HDMSE
Isomers are widely existed in the complex components of natural herbal medicines. The co-eluted constituents resulting from the isomers with the high similarity in their parent ions and fragment ions made the structural identification difficult, which is a bottleneck for large-scale untargeted analysis of drugs. TWIMS is a high throughput analytical method based on a separation mechanism in which gaseous ions, depending on their size, shape and charge, arrive at the mass spectrometer detector at different times (drift time) for the separation of isomers.36 CCS value is a unique physical property of the ion that is independent of the matrix composition and highly repeatable across different measurements and instruments, which is reliable can be calculated by the Mason–Schamp equation for isomers identification in complex system. Recently, an increasing number of web-enable databases15,16 have been developed to annotate CCS value, which supplied as a supplementary for identifying the isomers from diagnostic fragment ions. Isomer compounds were annotated by comparing the measured CCS values of the target peak from the processed HDMSE mass spectrometry data with the predicted values from ALLCCS database. The results indicated that those open-source databases can generate highly accurate CCS values for targeted compounds, which is a key part of achieving qualitative analysis. Ultimately, 45 compounds assigned to 12 species of isomers were tentatively identified. By comparison the experimental CCS values with predicted values from ALLCCS platform, six pairs of isomer reference compounds showed acceptable CCS prediction errors within 5.0 percent (Table 1). Moreover, the predicted values of isomers were similar in sequence with the CCS values results of the instrument.| No. | Name | Formula | RT (min) | Adducts | m/z | Drift time (ms) | Measured CCS (Å2) | ALLCCS (Å2) | Relative error |
|---|---|---|---|---|---|---|---|---|---|
| 1 | Sophoridine | C15H24N2O | 1.59 | +H | 249.197 | 1.81 | 158.47 | 160.9051 | −1.51% |
| Matrine | C15H24N2O | 2.84 | +H | 249.201 | 1.78 | 157.75 | 160.7439 | −1.86% | |
| 2 | Senkyunolide I | C12H16O4 | 12.1 | +Na | 247.095 | 1.96 | 163.27 | 158.1086 | 3.26% |
| Senkyunolide H | C12H16O4 | 12.65 | +Na | 247.096 | 1.95 | 162.96 | 158.1086 | 3.07% | |
| 3 | Maackiain | C16H12O5 | 18.71 | −H | 283.062 | 2.26 | 166.14 | 170.2229 | −2.40% |
| Calycosin | C16H12O5 | 13.77 | −H | 283.061 | 2.19 | 164.09 | 166.4920 | −1.44% | |
| 4 | Butylphthalide | C12H14O2 | 22.01 | +H | 191.107 | 1.22 | 140.38 | 143.3732 | −2.09% |
| Ligustilide | C12H14O2 | 22.53 | +H | 191.106 | 1.28 | 142.85 | 143.5509 | −0.49% | |
| 5 | Tokinolide B | C24H28O4 | 25.85 | +Na | 403.188 | 3.61 | 203.87 | 195.9185 | 4.06% |
| Riligustilide | C24H28O4 | 26.05 | +Na | 403.189 | 3.64 | 204.61 | 197.8284 | 3.43% | |
| Angelicide | C24H28O4 | 26.05 | +Na | 403.189 | 3.63 | 204.35 | 197.8284 | 3.30% | |
| Levistolide A | C24H28O4 | 26.19 | +Na | 403.189 | 3.67 | 205.27 | 198.6753 | 3.32% | |
| 6 | Betulinic acid | C30H48O3 | 28.54 | −H | 455.352 | 4.21 | 211.34 | 212.3275 | −0.47% |
| Oleanic acid | C30H48O3 | 29.01 | −H | 455.352 | 4.25 | 212.14 | 212.7024 | −0.26% |
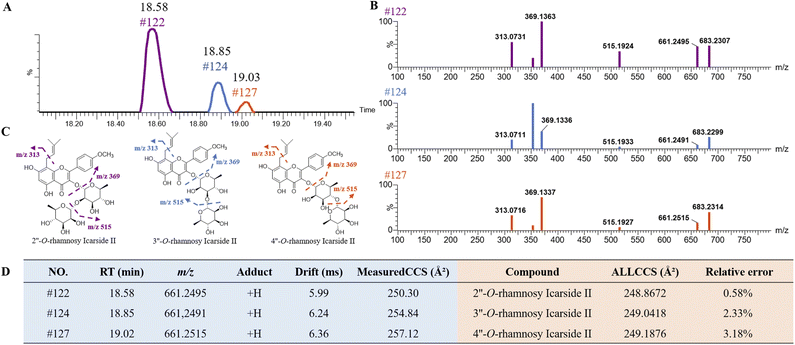
Isopentenyl flavonoid glycosides are representative chemical constituents of EB. The high similarity in their MS/MS ion made them hardly be distinguished by neutral loss strategy. As shown in Fig. 7A, three peaks at RT of 18.58 min (peak 122), 18.85 min (peak 124) and 19.03 min (peak 127) were screened by extracting ion chromatography with the same quasi-molecular ion at m/z 661.2496 [M + H]+ (C33H40O14). A series of fragment ions at m/z 515, 369 and 313 (Fig. 7B) were detected in those isomers, suggesting the successive losses of Rha, Rha and C4H7 (Fig. 7C), respectively. By comparison these fragmentation behaviors and the accurate mass of MS and MS/MS spectrum with previous literature report,35 those three compounds were tentatively identified as 2′′-O-rhamnosy icarside II or its isomer. According to the previous report,35 the glycoside of flavonoids in EB are all bonded at the C-3 and C-7 positions, and the rhamnoside is only directly linked at C-3 position. The isomers of 2′′-O-rhamnosy icarside II were presumed to be 3′′-O-rhamnosy icarside II and 4′′-O-rhamnosy icarside II. After uploading the structures on ALLCCS platform, the predicted CCS values were obtained and showed in Fig. 7D. The experimental CCS values were subsequently measured by the drift time of UPLC-TWIMS-QTOF-MS, which were highly consistent with the predicted values from both of ALLCCS platform, with prediction errors less than 3.18%. The results initially confirmed the accuracy of the structural predictions of those isomers. Based on measured results, the CCS values of these three compounds were ranked as follows: peak 122 < peak 124 < peak 127. Additionally, the predicted CCS values of 2′′-O-rhamnosy icarside II, 3′′-O-rhamnosy icarside II and 4′′-O-rhamnosy icarside II from ALLCCS were ranked as follows: 2′′-O-rhamnosy icarside II < 3′′-O-rhamnosy icarside II < 4′′-O-rhamnosy icarside II. As a result, peak 122, 124 and 127 was identified as 2′′-O-rhamnosy icarside II, 3′′-O-rhamnosy icarside II and 4′′-O-rhamnosy icarside II, respectively. This method has also been applied for identifying the isomers with parent ions at m/z 317.2093, including peak 175, 176, 177 and 179 (as shown in Fig. S4†). By comparing the order of predicted and experimental CCS values, those isomers were preliminary identification as 13-oxo-9E,11E-octadecatrienoic acid, 9-oxo-10E,12E-octadecatrienoic acid, 9(10)-epoxy-12Z,15Z-octadecadienoic acid and 13-hydroxy-6Z,9Z,11E-octadecatrienoic acid, respectively.
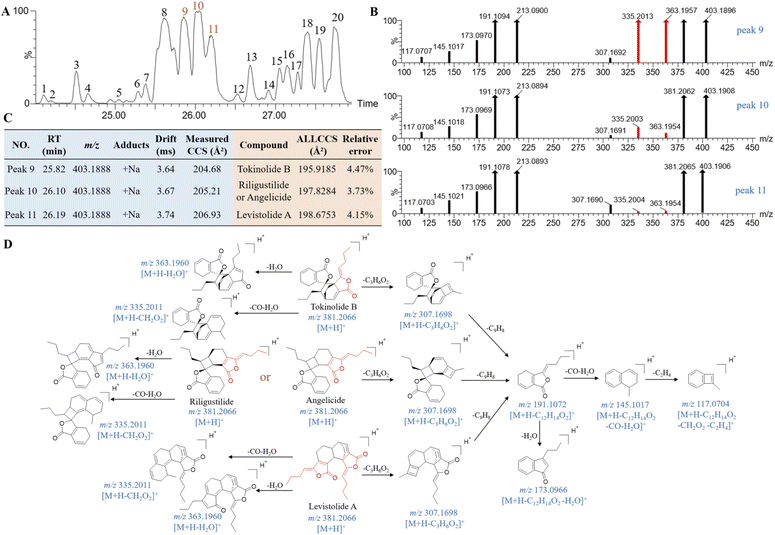
Some conformational difference isomers exhibit the high similarity in their MS/MS spectrum as the co-eluting peaks, which often bring great challenges for their structural characterization. A total of 20 isomers (Fig. 8A), with quasimolecular ion at m/z 403.1885, have been detected in QSC. They were originated from AS, and have showed the common fragment ions at m/z 191, 173, 145 and 117 (Fig. 8B and D), which were in accordance with those of ligustilide,37 a phthalide component derived from AS. These isomers were presumed as the dimers of ligustilide, including tokinolide B, riligustilide, angelicide and levistolide A according to the literature.38 By comparison the RT and the CCS value with the standards (Fig. 8C), peaks 9 and 11 were tentatively identified as tokinolide B and levistolide A, respectively. However, due to only conformational differences, riligustilide and angelicide were co-eluted at the same RT. Additionally, the predicted CCS values of them on ALLCCS platform were both 197.8284 Å2, whilst the experimental values (Table 1) of the reference were also close (204.61 Å2 and 204.35 Å2) and the response intensity of MS/MS fragment ions (Fig. S5A†) have no difference. Thus, they could be hardly identified by the difference of CCS value and the diagnostic fragment ions. It is the different site of dimer binding that lead to differences in the space resistance of the side chains and five-membered ring, resulting in the corresponding characteristic fragments response intensities. The characteristic fragment ions at m/z 363 and m/z 335 were produced by side chain and five-membered ring cleavage with the loss of H2O and CO + H2O from the parent ions (Fig. 8D). Meanwhile, the peak intensities of the two fragment ions were different in those isomers, which could be helpful for distinguishing them. These two typical fragment ions at m/z 363 and m/z 335 have been showed in high response in HDMSE spectra of tokinolide B, moderate response in riligustilide and angelicide, and a comparative weak response in levistolide A. Thus, peak 8 could be preliminary identification as an isomer of tokinolide B, which has high response of ions at m/z 363 and m/z 335 (Fig. S5B†). Following this regularity, peaks 1–6 and peaks 7–8 as well as peaks 12–20 are tentatively identified as isomers of riligustilide or angelicide, tokinolide B and levistolide A, respectively.
Conclusions
In this study, a new integrated multiple data acquisition and processing strategy based on UPLC-TWIMS-QTOF-MS for accelerating the compounds identification of Miao Nationality medicine QSC capsule has been developed. A total of 202 compounds were tentatively identified, and 155 of them were tentatively screened by the in-house database of UNIFI platform whilst 47 of them were tentatively confirmed by comparing their accurate mass measurements of MSE spectra and RTs with those of reference compounds. According to the cosine values and characteristic ions of the adjacent nodes in the molecular network, 13 constituents were identified from the analysis pattern in GNPS platform. Moreover, 12 pairs of isomers were further identified by comparison of their CCS values in the ALLCCS platform with those experimental CCS values as determined by TWIMS mass spectrometry, and their diagnostic fragment ions could efficiently distinguish the isomers. This study shows that the integrated strategy for multiple data acquisition of mass spectrometry data is appropriate for the identification and discovery of known and unknown compounds as well as isomers in QSC. It is worth noting that this work is a practical example of comprehensive qualitative and systematic analysis from complex matrices that could guide many other similar projects.QSC has demonstrated a great therapeutic effect on leukocyte elevation in clinical practice, and the identified components tentatively played an important role in the therapeutic process. Further investigation is warranted for exploring the key metabolites of QSC and the function of the prototype components and metabolites in the treatment of elevated leukocytes. This research is valuable for serving as a basis for its further examination in the field of pharmacology and mechanism of action.
Conflicts of interest
There are no conflicts to declare.Acknowledgements
This work was funded by National Natural Science Foundation of China (No. 82141203, 81772798), Shanghai Municipal Science and Technology Major Project (ZD2021CY001), Three-year Action Plan for Shanghai TCM Development and Inheritance Program [ZY(2021-2023)-0401], Innovation Team and Talents Cultivation Program of National Administration of Traditional Chinese Medicine (ZYYCXTDD-202004), Shanghai Engineering Research Center for the Preparation of Bioactive Natural Products (16DZ2280200).References
- M. K. Tang, L. L. Luo, C. Zhang, J. H. Wu and X. Y. Wang, J. Tradit. Chin. Med. Sci., 2021, 8, S22–S26 Search PubMed.
- Z. Y. Li, Y. Tu, H. T. Li, J. He, S. Que, G. P. Dong, M. S. Zhang, J. Q. Liu, X. L. Huang, X. R. Wang, M. Bolat, X. Feng, F. B. Zhang and F. Jiang, Zhongguo Zhongyao Zazhi, 2020, 45, 2265–2274 Search PubMed.
- Y. L. Wu, L. Zhao, L. F. Gu, A. Tilyek, B. Y. Yu and C. Z. Chai, J. Ethnopharmacol., 2022, 283, 114696 CrossRef CAS.
- T. Wuniqiemu, J. J. Qin, F. Z. Teng, M. Nabijan, J. Cui, L. Yi, W. F. Tang, X. Y. Zhu, M. Abduwaki, M. Nurahmat, Y. Wei and J. C. Dong, J. Ethnopharmacol., 2021, 266, 113343 CrossRef CAS PubMed.
- W. Zhang, M. W. Saif, G. E. Dutschman, X. Li, W. Lam, S. Bussom, Z. L. Jiang, M. Ye, E. Chu and Y. C. Cheng, J. Chromatogr. A, 2010, 1217, 5785–5793 CrossRef CAS.
- S. F. Wang, P. H. Chen, W. Jiang, L. H. Wu, L. L. Chen, X. H. Fan, Y. Wang and Y. Y. Cheng, J. Chromatogr. A, 2014, 1348, 105–124 CrossRef CAS PubMed.
- W. Z. Yang, X. Qiao, K. Li, J. R. Fan, T. Bo, D. A. Guo and M. Ye, Acta Pharm. Sin. B, 2016, 6, 568–575 CrossRef PubMed.
- V. Davies, J. Wandy, S. Weidt, J. J. Hooft, A. Miller, R. Daly and S. Rogers, Anal. Chem., 2021, 93, 5676–5683 CrossRef CAS PubMed.
- C. Gotti, F. Roux-Dalvai, C. Joly-Beauparlant, L. Mangnier, M. Leclercq and A. Droit, J. Proteome Res., 2021, 20, 4801–4814 CrossRef CAS PubMed.
- H. Li, M. Uittenbogaard, R. Navarro, M. Ahmed, A. Gropman, A. Chiaramello and L. Hao, Mol. Omics, 2022, 18, 196–205 RSC.
- A. Bianco, I. Neefjes, D. Alfaouri, H. Vehkamaki, T. Kurten, L. Ahonen, M. Passananti and J. Kangasluoma, Talanta, 2022, 243, 123339 CrossRef CAS PubMed.
- M. Y. Liu, S. H. Zhao, Z. Q. Wang, Y. F. Wang, T. Liu, S. Li, C. C. Wang, H. T. Wang and P. F. Tu, J. Chromatogr. B: Anal. Technol. Biomed. Life Sci., 2014, 949–950, 115–126 CrossRef CAS.
- C. X. Zhang, T. T. Zuo, X. Y. Wang, H. D. Wang, Y. Hu, Z. Li, W. W. Li, L. Jia, Y. X. Qian, W. Z. Yang and H. S. Yu, Molecules, 2019, 24, 2708 CrossRef CAS PubMed.
- T. F. Cheng, Y. H. Zhang, J. Ye, H. Z. Jin and W. D. Zhang, J. Pharm. Biomed. Anal., 2020, 184, 113197 CrossRef CAS PubMed.
- H. Zhu, X. Wu, J. Huo, J. Hou, H. Long, Z. Zhang, B. Wang, M. Tian, K. Chen, D. Guo, M. Lei and W. Wu, J. Chromatogr. A, 2021, 1653, 462405 CrossRef CAS PubMed.
- Y. H. Zhang, H. B. Lei, J. F. Tao, W. L. Yuan, W. D. Zhang and J. Ye, RSC Adv., 2021, 11, 15546–15556 RSC.
- X. P. Zhang, H. J. Yang, D. H. Zou, X. M. He, X. F. Yu and Y. F. Li, Afr. J. Tradit., Complementary Altern. Med., 2016, 14, 155–164 CrossRef PubMed.
- H. Yan, X. Zhang and J. Li, Journal of Hubei University of Chinese Medicine, 2020, 22, 70–73 Search PubMed.
- H. Xu, Y. P. Zheng and L. Duan, Chin. J. Ethnomed. Ethnopharmacy, 2021, 30, 8–15 Search PubMed.
- Z. W. Zhou, M. D. Luo, X. Chen, Y. D. Yin, X. Xiong, R. H. Wang and Z. J. Zhu, Nat. Commun., 2020, 11, 4334 CrossRef CAS PubMed.
- W. Wu, C. Y. Yan, L. Li, Z. Q. Liu and S. Y. Liu, J. Chromatogr. A, 2004, 1047, 213–220 CrossRef CAS PubMed.
- L. W. Qi, C. Y. Chen and P. Li, Rapid Commun. Mass Spectrom., 2009, 23, 3227–3242 CrossRef CAS PubMed.
- N. Gampe, A. Darcsi, S. Lohner, S. Beni and L. Kursinszki, J. Pharm. Biomed. Anal., 2016, 123, 74–81 CrossRef CAS PubMed.
- X. P. Ding, X. T. Wang, L. L. Chen, Q. Guo, H. Wang, J. Qi and B. Y. Yu, J. Chromatogr. A, 2011, 1218, 1227–1235 CrossRef CAS PubMed.
- Y. G. Mi, W. D. Hu, W. W. Li, S. Y. Wan, X. Y. Xu, M. Y. Liu, H. D. Wang, Q. X. Mei, Q. C. Chen, Y. Yang, B. X. Chen, M. T. Jiang, X. Li, W. Z. Yang and D. A. Guo, Molecules, 2022, 27, 3647 CrossRef CAS.
- X. P. Qi, X. Y. Wang, T. F. Cheng, Q. L. Wu, N. Mi, X. M. Mu, X. Guo, G. Zhao, Z. J. Huang, J. Ye and W. D. Zhang, J. Sep. Sci., 2019, 42, 2748–2761 CrossRef CAS.
- Z. Lin, C. F. Huang, X. S. Liu and J. K. Jiang, Basic Clin. Pharmacol. Toxicol., 2011, 108, 304–309 CrossRef CAS.
- D. D. Hu, X. Chen, D. X. Li, H. L. Zhang, Y. W. Duan and Y. Huang, Pharmaceutics, 2022, 14, 603 CrossRef CAS PubMed.
- T. T. Jong, M. R. Lee, Y. C. Chiang and S. T. Chiang, J. Pharm. Biomed. Anal., 2006, 40, 472–477 CrossRef CAS PubMed.
- A. M. Frank, N. Bandeira, Z. X. Shen, S. Tanner, S. P. Briggs, R. D. Smith and P. A. Pevzner, J. Proteome Res., 2008, 7, 113–122 CrossRef CAS.
- J. Watrous, P. Roach, T. Alexandrov, B. S. Heath, J. Y. Yang, R. D. Kersten, M. Voort, K. Pogliano, H. Gross, J. M. Raaijmakers, B. S. Moore, J. L. Laskin, N. Bandeira and P. C. Dorrestein, Proc. Natl. Acad. Sci. U. S. A., 2012, 109, 1743–1752 CrossRef PubMed.
- A. M. Frank, M. E. Monroe, A. R. Shah, J. J. Carver, N. Bandeira, R. J. Moore, G. A. Anderson, R. D. Smith and P. A. Pevzner, Nat. Methods, 2011, 8, 587–591 CrossRef CAS PubMed.
- Q. H. Zhang, J. B. Yu, Y. Y. Wang and W. K. Su, Molecules, 2016, 21, 989 CrossRef PubMed.
- X. Dong, X. N. Li, N. Li, H. M. Zhao, A. GuLa, X. Zhang, P. Zhang and B. Q. Bao, J. Sep. Sci., 2019, 42, 3382–3389 CrossRef CAS PubMed.
- W. H. Qin, Y. Yang, Q. Li and X. Liu, Nat. Prod. Res. Dev., 2021, 33, 1478–1490 Search PubMed.
- F. Lanucara, S. W. Holman, C. J. Gray and C. E. Eyers, Nat. Chem., 2014, 6, 281–294 CrossRef CAS PubMed.
- L. L. Chen, J. Qi, Y. X. Chang, D. N. Zhu and B. Y. Yu, J. Pharm. Biomed. Anal., 2009, 50, 127–137 CrossRef CAS PubMed.
- S. L. Li, S. S. Chan, G. Lin, L. Ling, R. Yan, H. S. Chung and Y. K. Tam, Planta Med., 2003, 69, 445–451 CrossRef CAS PubMed.
Footnote |
| † Electronic supplementary information (ESI) available. See https://doi.org/10.1039/d2ra04720a |
| This journal is © The Royal Society of Chemistry 2022 |

