 Open Access Article
Creative Commons Attribution 3.0 Unported Licence
Photoluminescence and afterglow of Dy3+ doped CaAl2O4 derived via sol–gel combustion†
Bao-gai Zhai,
Meng Meng Chen and
Yuan Ming Huang
 *
*
School of Microelectronics and Control Engineering, Changzhou University, Changzhou 213164, China. E-mail: dongshanisland@126.com
First published on 8th November 2022
Abstract
With doping concentration varying from 0.1 to 5.0 mol%, a series of Dy3+ doped calcium aluminate (CaAl2O4:Dy3+) phosphors were synthesized via a sol–gel combustion technique. The phase, morphology, photoluminescence (PL), afterglow, and thermoluminescence (TL) glow curves of CaAl2O4:Dy3+ were investigated by means of X-ray diffractometry, scanning electron microscopy, transmission electron microscopy, PL spectroscopy, afterglow spectroscopy, and TL dosimetry, respectively. It is found that: (i) oxygen vacancies and Dy3+ work as two independent sets of luminescence centers of PL for CaAl2O4:Dy3+; (ii) Dy3+ works as the luminescence center of afterglow for CaAl2O4:Dy3+; (iii) the afterglow of CaAl2O4:Dy3+ lasts for about 115 min at the optimal doping concentration of around 0.8 mol%; and (iv) multiple traps, which are sensitive to doping concentration, are present in CaAl2O4:Dy3+. The PL and afterglow mechanisms of CaAl2O4:Dy3+ are discussed to reveal the processes of charged carrier excitation, migration, trapping, detrapping, and radiative recombination in CaAl2O4:Dy3+.
1. Introduction
Rare-earth doped calcium aluminate phosphors have been intensively studied due to their excellent afterglow properties,1–4 among which Dy3+ doped calcium aluminate (CaAl2O4:Dy3+) is a well-known inorganic phosphor which emits white photoluminescence (PL) under ultraviolet excitation.5 Apart from its white PL, CaAl2O4:Dy3+ exhibits a white afterglow even after the removal of ultraviolet excitation.6 As reported by Liu et al. in 2005, Dy3+ works as the luminescence center of afterglow for CaAl2O4:Dy3+ and the white afterglow of solid state reaction derived CaAl2O4:Dy3+ lasts 32 min at the optimal doping concentration of 2 at%.6 For afterglow materials, the processes of charged carrier excitation, migration, trapping, detrapping, and radiative recombination are critically important to understand their afterglow properties.7–9 For example, long afterglow can be achieved at room temperature only when traps have an appropriate activation energy somewhere around 0.65 eV whereas shallow traps (E ≤ 0.4 eV) and deep traps (E > 2 eV) are not favorable because they can be emptied either easily or with difficulty at room temperature.7 Up to date, only a single report exists on the afterglow of CaAl2O4:Dy3+, leaving the processes of charged carrier excitation, migration, trapping and detrapping not fully revealed. The lack of such knowledge hampers the comprehensive understanding of the afterglow mechanism of CaAl2O4:Dy3+.With respect to solid state reaction derived CaAl2O4:Dy3+, sol–gel combustion derived CaAl2O4:Dy3+ is abundant in oxygen and calcium vacancies. In CaAl2O4:Dy3+, oxygen vacancies are potential electron traps because they are positively charged whereas calcium vacancies are potential hole traps because they are negatively charged.8,10 Therefore, sol–gel combustion derived CaAl2O4:Dy3+ phosphors are suitable for exploring the afterglow mechanisms of CaAl2O4:Dy3+. In this paper, we report the PL and afterglow properties of sol–gel combustion derived CaAl2O4:Dy3+ with the doping concentrations varying from 0.1 to 5.0 mol%. A picture on the PL and afterglow mechanisms of CaAl2O4:Dy3+ is given to reveal the processes of charged carriers' excitation, migration, trapping, detrapping, and recombination in CaAl2O4:Dy3+.
2. Experimental section
2.1 Sol–gel combustion synthesis of CaAl2O4:Dy3+
CaAl2O4:Dy3+ phosphors with the doping concentrations varying from 0.1 to 5.0 mol% were synthesized via the sol–gel combustion with urea as fuel.11–13 All reagents were in analytical grade and provided by Sinopharm Chemical Reagents Co., Ltd (Shanghai, China). The purity of dysprosium oxide (Dy2O3) was 99.99%. Under stirring with a magnetic bar, Ca(NO3)2·4H2O (0.2 mol), Al(NO3)3·9H2O (0.4 mol), urea (6.0 mol), H3BO3 (0.02 mol) and stoichiometric amount of Dy2O3 were dissolved in deionized water (600 mL) to form a transparent solution. A homogeneous solution was obtained after the mixture was stirred vigorously for 60 min in a glass beaker. After having been aged at room temperature for two weeks, the solution was ready for the sol–gel combustion. Urea and boric acid functioned as the fuel and flux, respectively. Alumina crucibles, each with the volume capacity of 50 mL, were employed as the reaction containers. Half filled with the aged solution, the solution-containing alumina crucible was transferred into an air-filled box furnace for self-propagating combustion. The temperature in the furnace was preset at 780 °C. After the solution-containing crucible was transferred into the furnace, the temperature in the furnace was gradually dropped to about 706 °C. Heated at such high temperatures, water in the solution got boiling and the starting materials (fuels and metal nitrates) in the crucible were partially decomposed until the organic fuels were automatically ignited to initiate the exothermic reactions. The sol–gel combustion yielded voluminous gases and bright flames. In this work, the synthesis was initiated by point-heating of a small part of the mixture in the crucible, and the ignition was started at around 750 °C. Once started, a wave of exothermic reactions swept through the remaining material in the crucible. This combustion synthesis lasted for about 40 s, which was exceptionally fast when compared to high-temperature solid state reactions. During the sol–gel combustion, a large amount of energy was released from the exothermic reactions, which in turn raised the temperature in the furnace up to 830 °C. Measured with an infrared thermometer, the temperature in the flame was up to 1300 °C. After the fire was extinguished, the crucible was taken out of the furnace immediately. The total holding time of the crucible in the furnace was about 4 min. White powders were resulted after the sol–gel combustion. According to molar ratio of Dy3+ to Ca2+ in the starting materials, a series of CaAl2O4:Dy3+ phosphors were obtained with the nominal doping concentration of Dy3+ varying in the range of 0.1–5.0 mol%. No further calcination was applied to the sol–gel combustion derived CaAl2O4:Dy3+.2.2 Solid state synthesis of CaAl2O4:Dy3+ phosphors
For comparison, solid state reaction derived CaAl2O4:Dy3+ phosphors were synthesized with CaCO3 (0.02 mol), Al2O3 (0.02 mol), H3BO3 (0.002 mol), Dy2O3 as raw materials. Stoichiometric mixtures of the raw materials were homogeneously mixed and ground. Subsequently the mixture was transferred into alumina crucibles and sintered at 900 °C for 4 h in an air-filled electric tube furnace. The sintered products were ground again in an agate mortar, then the powder products were calcined at 1350 °C for 10 h in air. According to the molar ratio of Dy3+ to Ca2+ in the starting materials, the doping concentration of Dy3+ in the solid state reaction derived CaAl2O4:Dy3+ varied in the range 0.1–10.0 mol%.2.3 Phase, morphology and elemental composition of CaAl2O4:Dy3+ phosphors
X-Ray diffraction (XRD) profiles of CaAl2O4:Dy3+ phosphors were recorded on X-ray diffractometer (D/max 2500 PC, Rigaku Corporation, Akishima, Japan) using Cu Kα radiation (λ = 0.15405 nm). The scanning electron microscope (SEM) (model S-4800, Hitachi, Tokyo, Japan) was employed to analyze the morphology of the synthesized products. The SEM was coupled with a silicon drifted detector as the X-ray analyzer to record the energy dispersive X-ray (EDX) spectrum of the synthesized products. The micrographs of CaAl2O4:Dy3+ nanocrystals were recorded on a transmission electron microscope (TEM) (model JEOL JEM-2100, Japan Electronics Corp, Akishima, Japan). Samples for TEM analysis were prepared by suspending the particles in ethanol under the excitation of ultrasonification and then drying a drop of the suspension on a carbon-coated copper grid.2.4 PL excitation and emission spectra of CaAl2O4:Dy3+
The PL excitation spectrum of CaAl2O4:Dy3+ was measured with the fluorescence spectrometer F-7000 (Hitachi, Japan). The spectrophotometer (Tianjin Gangdong Ltd., Tianjin, China) was used to acquire the steady-state PL spectra of CaAl2O4:Dy3+. The excitation source of the PL spectrum was provided by a helium–cadmium laser (Kimmon Electric Co. Ltd., Tokyo, Japan). The emission wavelength and the output power of the laser radiation were 325 nm and 13 mW, respectively.2.5 Afterglow spectra and thermoluminescence (TL) glow curves of CaAl2O4:Dy3+
The afterglow spectra of CaAl2O4:Dy3+ were recorded with the PL spectrophotometer (Tianjin Gangdong Ltd, Tianjin, China) immediately after the ultraviolet irradiation of a high-pressure mercury lamp was blocked off. The output power of the high-pressure mercury lamp was 175 W. The irradiation duration of the high-pressure lamp irradiation was 3 min. Afterglow decay curve was taken by focusing the afterglows into the entrance slit of the spectrometer. The TL glow curves of CaAl2O4:Dy3+ were measured on a TL meter constructed according to the scheme given by Yamashita et al.14 The phosphor was placed on an electrically heated plate, the temperature of the plate was controlled with a program in computer. As the temperature of the plate was raised linearly with time, the light output of the phosphor was recorded using a photomultiplier in a photon-counting mode. A bialkali photomultiplier tube (model H10425, Hamamatsu, Japan) was used in the TL meter for the luminescence detection, it covers the 350–600 nm wavelength range. Prior to the TL measurements, CaAl2O4:Dy3+ phosphors were exposed to the 254 nm irradiation of a low-pressure mercury lamp for 5 min. The output power of the low-pressure mercury lamp was 32 W. The TL signals of CaAl2O4:Dy3+ phosphors were recorded when the CaAl2O4:Dy3+ phosphors were heated from 10 to 200 °C at a rate of 2 °C s−1.3. Results and discussions
3.1 Phase and morphology of CaAl2O4:Dy3+
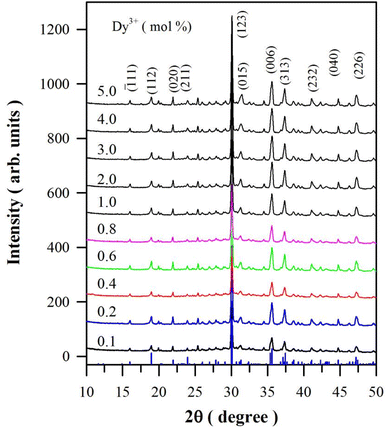
Fig. 1 represents the XRD profiles of CaAl2O4:Dy3+ with different doping concentrations. The XRD data of monoclinic CaAl2O4 registered in Joint Committee on Powder Diffraction Standards (JCPDS) card no. 23-1306 are depicted at the bottom of the figure for comparison. The scale of the intensity of powder X-ray diffraction is counts of photons received by the detector. For the purpose of clarity, the XRD curves in Fig. 1 are evenly spaced after having been shifted upwards one by one, so the scale of the intensity of powder XRD in Fig. 1 is arbitrary units. As can be seen in Fig. 1, each XRD profile of CaAl2O4:Dy3+ exhibits distinct peaks at 2θ = 16.01, 18.99, 21.98, 23.97, 30.08, 31.35, 35.63, 37.46, 41.11, 44.76 and 47.24°. According to the diffraction data registered in JCPDS card no. 23-1036, these peaks can be attributed to the X-ray diffractions from crystallographic planes (![[1 with combining macron]](https://www.rsc.org/images/entities/char_0031_0304.gif) 11), (112), (020), (211), (123), (015), (006), (313), (232), (040) and (226) of monoclinic CaAl2O4, respectively. Among these peaks, the strongest one is located at 30.08° and indexed as (123). Actually, this peak is contributed jointly by two crystallographic planes (
11), (112), (020), (211), (123), (015), (006), (313), (232), (040) and (226) of monoclinic CaAl2O4, respectively. Among these peaks, the strongest one is located at 30.08° and indexed as (123). Actually, this peak is contributed jointly by two crystallographic planes (![[2 with combining macron]](https://www.rsc.org/images/entities/char_0032_0304.gif) 20) and (123) of monoclinic CaAl2O4, which are located at 2θ = 30.11 and 30.05°, respectively. Being closely packed and nearly equal in diffraction intensity, the two peaks are not distinguishable in the XRD profiles. This is the reason why some researchers indexed the peak at around 30.8° as (220).7,8 Obviously, the diffraction peaks in Fig. 1 match well with the standard XRD diffractograms of monoclinic CaAl2O4.3,15,16 Furthermore, these peaks are found to agree well with the calculated XRD diffractograms of monoclinic CaAl2O4 (Fig. S1†). The absence of a secondary phase in the XRD profiles indicates that Dy3+ ions are successfully incorporated into CaAl2O4 without introducing new phase in the crystal structure when doping concentration is lower than 5.0 mol%. For sol–gel combustion, nitrate forms of starting materials are highly necessary. Instead of Dy2O3, for example, Dy(NO3)3 is favored as the starting material. It is known that Dy2O3 can be dissolved into dilute HNO3 solution to form Dy (NO3)3.9 In this work, Dy2O3 is used as a starting material to provide the source of Dy3+ because a tiny amount of Dy2O3 can be dissolved into the aqueous solution of Al(NO3)3 and urea after stirring with a magnetic bar for a couple of hours at a temperature higher than 20 °C. Since the synthesis process occurs at high temperatures generated by the self-propagating combustion, this method is ideally suited for the production of refractory materials including ceramics CaAl2O4.
20) and (123) of monoclinic CaAl2O4, which are located at 2θ = 30.11 and 30.05°, respectively. Being closely packed and nearly equal in diffraction intensity, the two peaks are not distinguishable in the XRD profiles. This is the reason why some researchers indexed the peak at around 30.8° as (220).7,8 Obviously, the diffraction peaks in Fig. 1 match well with the standard XRD diffractograms of monoclinic CaAl2O4.3,15,16 Furthermore, these peaks are found to agree well with the calculated XRD diffractograms of monoclinic CaAl2O4 (Fig. S1†). The absence of a secondary phase in the XRD profiles indicates that Dy3+ ions are successfully incorporated into CaAl2O4 without introducing new phase in the crystal structure when doping concentration is lower than 5.0 mol%. For sol–gel combustion, nitrate forms of starting materials are highly necessary. Instead of Dy2O3, for example, Dy(NO3)3 is favored as the starting material. It is known that Dy2O3 can be dissolved into dilute HNO3 solution to form Dy (NO3)3.9 In this work, Dy2O3 is used as a starting material to provide the source of Dy3+ because a tiny amount of Dy2O3 can be dissolved into the aqueous solution of Al(NO3)3 and urea after stirring with a magnetic bar for a couple of hours at a temperature higher than 20 °C. Since the synthesis process occurs at high temperatures generated by the self-propagating combustion, this method is ideally suited for the production of refractory materials including ceramics CaAl2O4.
Monoclinic CaAl2O4 is known to have the stuffed tridymite structure with the space group P21/n and Z = 12. Fig. S2(a)† displays the conventional unit cell of monoclinic CaAl2O4. Taken from the Inorganic Crystal Structure Database (ICSD), the lattice parameters of monoclinic CaAl2O4 (a = 0.8694 nm, b = 0.8093 nm, c = 1.5210 nm, and β = 90.1665°) are used to construct the crystal structure in present work (ICSD #159925). Obviously, this unit cell consists of 12 Ca sites, 24 Al sites and 48 O sites. As labeled as sites Ca1, Ca2 and Ca3 in Fig. S2(a),† there are three crystallographically different sites for Ca2+ in the unit cell of CaAl2O4. Two of the Ca sites are six-coordinated and one Ca site is nine-coordinated.17 In monoclinic CaAl2O4, a three-dimensional network is formed by corner-sharing [AlO4] tetrahedra, the Ca2+ ions are located along the channels in b-direction. Fig. S2(b)† illustrates the schematic view of the monoclinic CaAl2O4 along the b-direction. Such a crystal structure makes it easy for Dy3+ ions to substitute the Ca2+ sites in CaAl2O4. The effective ionic radii of cations depend on their coordination numbers (CN). In the case of site occupancy, the effective ionic radii of Ca2+ are 0.100 nm (CN = 6) and 0.118 nm (CN = 9), the effective ionic radii of Dy3+ are 0.091 nm (CN = 6) and 0.108 nm (CN = 9).18 Due to the comparable ionic sizes, Dy3+ ions tend to replace the Ca2+ ions in the lattice of CaAl2O4.
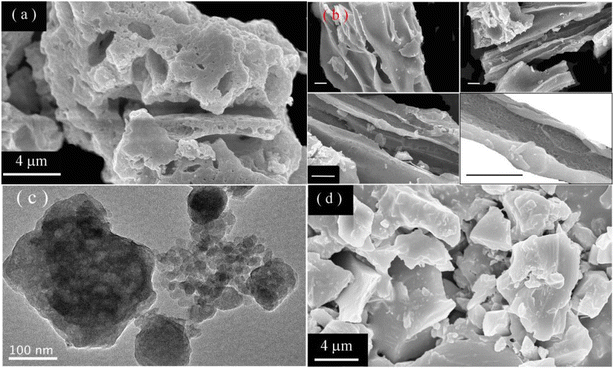
Fig. 2(a) displays the SEM micrograph of sol–gel combustion derived CaAl2O4:Dy3+ (5.0 mol%). As shown in Fig. 2(a), the sol–gel combustion derived CaAl2O4:Dy3+ phosphors are in the form of irregular aggregates with their dimensions up to 20 μm. Sol–gel combustion derived aluminate nanocrystals are prone to forming large aggregates. Micrometer-sized pores are randomly distributed in the aggregates due to the production of a large amount of gases during the reaction.3,8,11–13,19,20 Fig. 2(b) shows the SEM micrographs of CaAl2O4:Dy3+ to display the channels formed in the aggregates, each scale bar represents 2 μm. It is evident that channels with different diameters are present in the aggregate. Fig. 2(c) shows the TEM micrograph of the CaAl2O4:Dy3+. Obviously, each aggregate consists of a large number of nanocrystals. Previous work has evidenced that one aggregate consists of a number of nanocrystals whose sizes vary from 10 nm to 80 nm.4,16,17,21 As a contrast, solid state reaction derived CaAl2O4:Dy3+ exhibits quite different morphology. Fig. 2(d) shows the SEM micrograph of solid state reaction derived CaAl2O4:Dy3+ (5.0 mol%) at 1350 °C for 10 h. As shown in Fig. 2(d), CaAl2O4:Dy3+ phosphors are in the form of irregular blocks without any porous channels. The dimension of the blocks is as large as 10 μm in diameter. A comparison of the micrographs reveals that the sol–gel combustion derived CaAl2O4:Dy3+ has large surface area, which in turn renders the phosphor rich in oxygen vacancies and abundant in traps for charged carriers. Till date, several rare earth doped CaAl2O4 materials are studied and available in literature. For example, Liu et al. prepared CaAl2O4:Dy3+ via solid state reaction at 1350 °C.6 Due to the features of solid state reaction, the solid state reaction derived CaAl2O4:Dy3+ phosphors are different from the sol–gel combustion derived ones in the aspects of population density of intrinsic defects. Especially in the sol–gel combustion method, addition of H3BO3 lowers reaction temperature, accelerates a diffusion of raw materials, and eventually influences the afterglow properties. Detailed discussions are given by Takeuchi and Kishine in the case of Eu2+ and Dy3+ codoped SrAl2O4.22
3.2 EDX spectrum of CaAl2O4:Dy3+
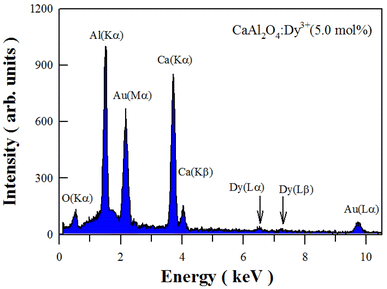
Fig. 3 depicts the EDX spectrum of sol–gel combustion derived CaAl2O4:Dy3+ (5.0 mol%). As can be seen in Fig. 3, the characteristic X-ray emissions of O(Kα), Al(Kα) and Ca(Kα2), and Ca(Kβ1,3) are located at 0.525, 1.486, 3.693, and 4.013 keV, respectively. Moreover, the characteristic emissions of Dy(Lα1) and Dy(Lβ1) can be identified in the EDX spectrum at 6.495 and 7.248 keV, respectively. The X-ray emissions of Au(Mα1) at 2.122 keV and Au(Lα1) at 9.713 keV are due to Au sputtering for the convenience of SEM characterization. Apparently, the EDX spectrum of CaAl2O4:Dy3+ confirms the presence of elements Ca, Al, O and Dy in the sample.3.3 XPS spectrum of CaAl2O4:Dy3+
The oxidation states of chemical elements in CaAl2O4:Dy3+ are investigated with the XPS. Fig. 4 represents the XPS survey scan (a) and high-resolution XPS spectra of Ca 2p (b), Al 2p (c), O 1s (d), Dy 3d (e), and Dy 4d (f) in sol–gel combustion derived CaAl2O4:Dy3+. The nominal doping concentration of Dy3+ is 2.0 mol%. As can be seen in Fig. 4(b–d), the binding energies of Ca 2p3/2, Ca 2p1/2, Al 2p1/2, and O 1s are located at approximately 347.3, 350.9, 74.1, and 531.8 eV, respectively. Fig. 4(e) shows that the binding energies of Dy 3d5/2 and Dy 3d3/2 are located at around 1297.6 and 1335.1 eV, respectively. Fig. 4(f) shows that the binding energies of Dy 4d5/2 and Dy 4d3/2 are located at around 154.0 and 157.3 eV, respectively. The data in Fig. 4 point out the presence of Ca, Al, O and Dy3+ in the phosphor.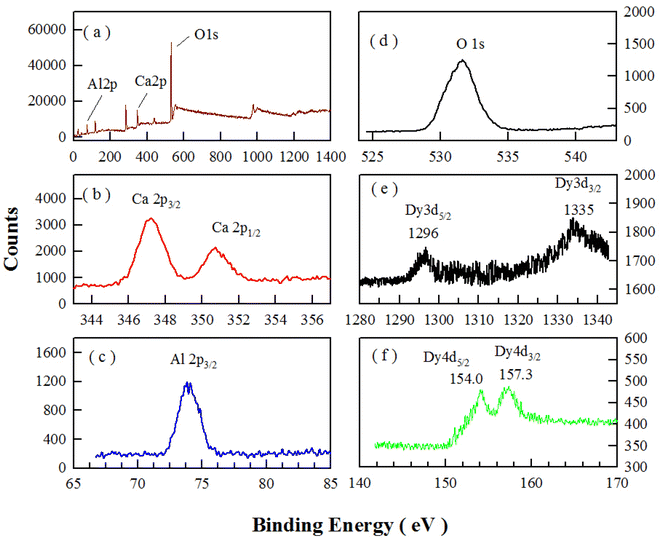 | ||
| Fig. 4 XPS survey scan (a) and high-resolution XPS spectra of Ca 2p (b), Al 2p (c), O 1s (d), Dy 3d (e), and Dy 4d (f) in sol–gel combustion derived CaAl2O4:Dy3+ (2.0 mol%). | ||
3.4 PL excitation spectrum of CaAl2O4:Dy3+
Fig. 5 shows the PL excitation spectrum of sol–gel combustion derived CaAl2O4:Dy3+ (2.0 mol%). The emission wavelength is fixed at 574 nm for the PL excitation measurement. As can be seen in Fig. 5, there are 6 peaks in the PL excitation spectrum of CaAl2O4:Dy3+ (2.0 mol%), which are located at 296, 326, 350, 389, 425, and 452 nm, respectively. The excitation peaks can be assigned to the 4f–4f transitions of Dy3+.23–25 The strongest absorption of CaAl2O4:Dy3+ is located at 350 nm, which is due to the 6H15/2 → 6P7/2 transition of Dy3+ activator. When compared to the strongest absorption at 350 nm, CaAl2O4:Dy3+ exhibits weaker absorptions at 296, 326, 389, 425 and 452 nm. These absorptions are due to 6H15/2 → 4D7/2, 6H15/2 → 6P3/2, 6H15/2 → 4I13/2, 6H15/2 → 4G11/2 and 6H15/2 → 4I15/2 transitions of Dy3+, respectively.26–31 The PL excitation spectrum indicates that a light source with the emission wavelength of 350 nm excites CaAl2O4:Dy3+ most efficiently. As a contrast, a light source with the emission wavelength of 326 nm can excite CaAl2O4:Dy3+ but in a much less efficient manner.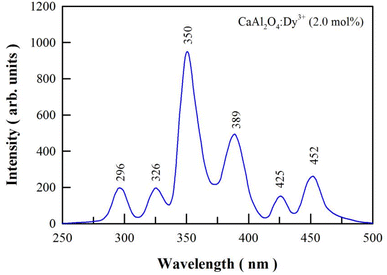 | ||
| Fig. 5 PL excitation spectrum of sol–gel combustion derived CaAl2O4:Dy3+ (2.0 mol%). The emission wavelength is fixed at 574 nm. | ||
3.5 PL spectra of CaAl2O4:Dy3+ at different doping concentrations
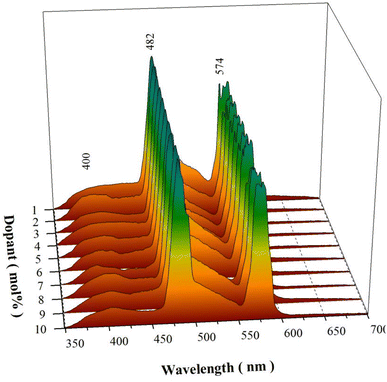
Fig. 6 represents the PL spectra of sol–gel combustion derived CaAl2O4:Dy3+ with doping concentrations in the range of 0.1–5.0 mol%. When the doping concentration is as low as 0.1 mol%, the PL spectrum of CaAl2O4:Dy3+ consists of a broad PL band peaking at about 400 nm whereas the characteristic emissions of Dy3+ are hardly discernible, as shown by the PL spectrum (a). The broadband emissions can be attributed to the intrinsic defect emissions in CaAl2O4, which are namely the oxygen and calcium vacancies.3,4 The PL properties of undoped CaAl2O4 and their origins were discussed in details in our previous work.15,16 Actually, similar broadband emissions are recorded for undoped CaAl2O4,15,16 Tb3+ doped CaAl2O4,3,4 undoped SrAl2O4,8 and Dy3+ doped BaAl2O4.20 The characteristic emissions of Dy3+ activator are represented by two narrowband emissions peaking at around 482 and 574 nm, respectively, which are due to the 4F9/2 → 6H15/2 and the 4F9/2 → 6H13/2 transitions of Dy3+ activator.2–4,6,23 As documented in the literature, the transition 4F9/2 → 6H15/2 (ΔL = 2 and ΔJ = 3) is magnetic dipole allowed whereas the transition 4F9/2 → 6H13/2 is identified as a hypersensitive electric dipole transition (ΔL = 2 and ΔJ = 2) of Dy3+. The reason why the characteristic emissions of Dy3+ activator are hardly discernible in the PL spectrum of CaAl2O4:Dy3+ (0.1 mol%) rests on the fact that the characteristic emissions of Dy3+ are too weak when compared to the strong emissions from the intrinsic defects in the host. As the doping concentration is increased to 0.2 and 0.4 mol%, the narrowband emissions of Dy3+ at 574 nm become discernible in the PL spectra of CaAl2O4:Dy3+ (0.2 and 0.4 mol%), as shown by the PL spectra (b) and (c). As the doping concentration is elevated further to 0.6 mol%, the narrowband emissions of Dy3+ can be identified clearly in the PL spectrum of CaAl2O4:Dy3+, as shown by the PL spectrum (d). It is apparent in Fig. 6 that the intensity of the characteristic emissions of Dy3+ increases monotonically with the doping concentration. Consequently, the PL spectrum of CaAl2O4:Dy3+ indicates that the intrinsic defects in CaAl2O4 and the doping species Dy3+ act as two independent sets of luminescence center of PL in CaAl2O4:Dy3+. The insight reason for the change in the PL intensity with doping of Dy3+ is due to the changes in the population density of the luminescence center of PL. The substitution of Dy3+ for Ca2+ in the lattice of CaAl2O4 promotes the production of two kinds of luminescence center of PL, as shown in eqn (1). The first kind of luminescence center of PL is the Dy3+ in Ca2+ site while the second kind of luminescence center of PL is the oxygen vacancy. As the doping concentration of Dy3+ increases, the population densities of the two kinds of luminescence center of PL are increased, which in turn lead to the enhancement in the PL intensities. It is noted that the PL intensity of each spectrum in Fig. 6 is normalized at 400 nm.
 | (1) |
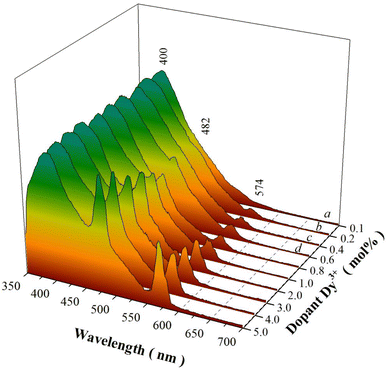 | ||
| Fig. 6 PL spectra of sol–gel combustion derived CaAl2O4:Dy3+ with doping concentrations in the range of 0.1–5.0 mol%. Excitation wavelength: 325 nm. | ||
To check the influences of excitation wavelength on the emissions of CaAl2O4:Dy3+, we measured the PL spectra of CaAl2O4:Dy3+ (5 mol%) under different excitation wavelengths. The emission spectra of CaAl2O4:Dy3+ under the excitations of 326 nm and 350 nm are shown in Fig. S3.† As can be seen in Fig. S3,† the structures of the two PL spectra are nearly identical to each other regardless the variation in the excitation wavelength. However, the emission intensity of CaAl2O4:Dy3+ (5 mol%) is apparently sensitive to the excitation wavelength. For example, the characteristic emissions of Dy3+ are stronger under the excitation of 350 nm than those under the excitation of 326 nm. One of the reasons rests on the fact that Dy3+ exhibits stronger absorption at 350 nm than at 326 nm, as endorsed by Fig. 5.
Due to the combined contributions of defect emissions from the host and the characteristic emissions of the dopant, the color coordinates of the emissions of CaAl2O4:Dy3+ varies with the doping concentration. Color coordinates of luminescent materials, which can be calculated from their PL spectral data, are important parameters to quantitatively describe the emission color for luminescent materials.32,33 The CIE chromaticity coordinates of CaAl2O4:Dy3+ are given in Table S1† for different doping concentrations. As shown in Table S1,† the chromaticity coordinates of CaAl2O4:Dy3+ change with the doping concentration. For example, the chromaticity coordinates of CaAl2O4:Dy3+ (0.1 mol%) are (0.156, 0.094), those of CaAl2O4:Dy3+ (5.0 mol%) are (0.187, 0.176). The emission photos and the CIE chromaticity diagram of CaAl2O4:Dy3+ are shown in Fig. S4.† It is clear that the PL color of CaAl2O4:Dy3+ keeps blue when the doping concentration varies in the range of 0.1–5.0 mol%. As referred to the PL spectrum in Fig. 6, the defect-related emissions (blue) of the host are a major constituent in the PL spectrum whereas the characteristic emissions of Dy3+ are a minor constituent. That is the reason why the sol–gel combustion derived CaAl2O4:Dy3+ exhibits blue colored emission in spite of the variation of the doping concentration in the range of 0.1–5.0 mol%.
The assignment of the broadband emissions in Fig. 6 to intrinsic defects in CaAl2O4 gains further support from the PL spectrum of solid state reaction derived CaAl2O4:Dy3+. The solid state reaction route involves chemical decomposition and reactions at much high temperatures (often from 1000 to 1500 °C) to produce a new solid composition. At such high temperatures, oxygen atoms migrate into the crystal lattice to repair the defects with the result of decreased population density of oxygen vacancies in CaAl2O4. Therefore, the broadband emissions should be weakened if the density of oxygen vacancies in CaAl2O4 is reduced at high temperature. Fig. 7 depicts the normalized PL spectra of solid state reaction derived CaAl2O4:Dy3+ at 1350 °C for 10 h. Obviously, each PL spectrum of the solid state reaction derived CaAl2O4:Dy3+ consists of the characteristic emissions of Dy3+. The most striking feature in Fig. 7 is that the broadband emissions extending from 350 to 450 nm are weakened for the solid state reaction derived CaAl2O4:Dy3+. The chromaticity coordinates of the solid state reaction derived CaAl2O4:Dy3+ (10 mol%) are (0.270, 0.365), as shown in Fig. S5.†
3.6 Afterglow spectrum of CaAl2O4:Dy3+
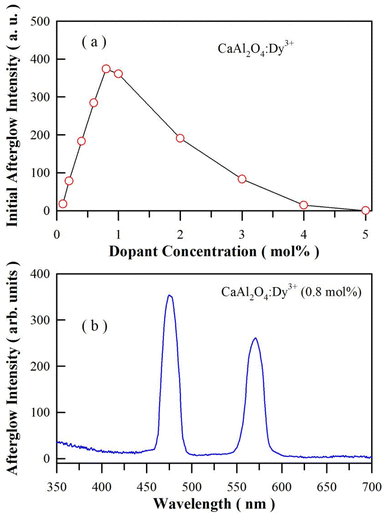
The emission spectrum of a high-pressure mercury lamp contains a pronounced spectral line at 365.4 nm, which is close to an absorption peak of CaAl2O4:Dy3+. After exposure to the illumination of a high-pressure mercury lamp (175 W) for 3 min, CaAl2O4:Dy3+ exhibits intense afterglow after the ultraviolet excitation is blocked off. Fig. S6† depicts the afterglow photos of CaAl2O4:Dy3+ (0.8 mol%) taken at different times after the irradiation of the high-pressure mercury lamp is blocked off. As shown in Fig. S6,† the white afterglow of CaAl2O4:Dy3+ (0.8 mol%) can last more than 60 min. The initial luminance of the afterglow is found to depend on the doping concentration of Dy3+. Fig. 8(a) shows the plot of the integrated afterglow intensity of sol–gel combustion derived CaAl2O4:Dy3+ versus the doping concentration of Dy3+. As can be seen in Fig. 8(a), the optimal doping concentration is around 0.8 mol%. It is noted that the afterglow gets quenched when the doping concentration is high (i.e., 5 mol%). Just like the case of PL quenching at high doping concentration, the non-radiative interaction between dopants is one of the reason of the concentration induced afterglow quenching.34 However, the traps generated by the dopant in the lattice of CaAl2O4 should be the key factor to be responsible for the afterglow quenching. As described in eqn (1), doping CaAl2O4 with Dy3+ results in oxygen vacancies. These positively charged oxygen vacancies can act as electron traps. The increase in the population density as well as the change in the trap depth of these the positively charged oxygen vacancies generate significant effects on the afterglow duration of the phosphor. For example, the afterglow duration is very short when the trap depth is shallow (E < 0.6 eV),8,15,16,35 and no afterglow can be observed when the trap depth is too deep (E > 2.0 eV). To observe afterglow at room temperature, the traps should have an appropriate activation energy somewhere between these two extremes, a trap depth around 0.65 eV is considered to be optimal.7 Fig. 8(b) depicts the afterglow spectrum of the sol–gel combustion derived CaAl2O4:Dy3+ at the doping concentration of 0.8 mol%. As can be seen in Fig. 8(b), the afterglow spectrum consists of two narrow emission bands of Dy3+, which is distinctly different from the broadband afterglow of CaAl2O4:Eu2+.1,21,36,37 Thus Fig. 8(b) demonstrates that Dy3+ acts as the luminescence center of afterglow for CaAl2O4:Dy3+. The CIE chromaticity coordinates of the afterglow of CaAl2O4:Dy3+ (0.8 mol%) are calculated to be (0.265, 0.305), as shown in Fig. S7.† It is clear that the afterglow color of CaAl2O4:Dy3+ is close to white at the doping level 0.8 mol%. For comparison, the afterglow spectrum of solid state reaction derived CaAl2O4:Dy3+ (0.8 mol%) is given in the ESI as Fig. S8.†3.7 Afterglow decay profile of CaAl2O4:Dy3+
The duration of afterglow is a straightforward and standardized parameter to evaluate the properties of an afterglow material, whereby 0.32 mcd m−2 is often used as threshold for defining the duration of an afterglow. Fig. 9 depicts the afterglow decay profile of sol–gel combustion derived CaAl2O4:Dy3+ (0.8 mol%). The phosphor was exposed to illumination of a high-pressure mercury lamp irradiation (175 W) for 3 min before the measurement of afterglow decay curve. As shown by the raw data in Fig. 9, the afterglow duration of CaAl2O4:Dy3+ is determined to be about 115 min. It is found that the decay curves in Fig. 9 could be best fitted to the tri-exponential function according to eqn (2)
I(t) = I1![[thin space (1/6-em)]](https://www.rsc.org/images/entities/char_2009.gif) exp(−t/τ1) + I2 exp(−t/τ1) + I2![[thin space (1/6-em)]](https://www.rsc.org/images/entities/char_2009.gif) exp(−t/τ2) + I3 exp(−t/τ2) + I3![[thin space (1/6-em)]](https://www.rsc.org/images/entities/char_2009.gif) exp(−t/τ3), exp(−t/τ3),
| (2) |
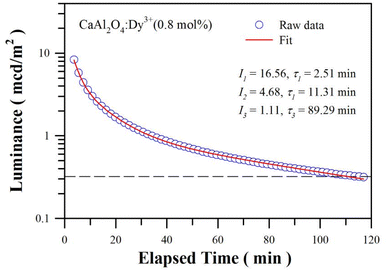 | ||
| Fig. 9 Afterglow decay profile of sol–gel combustion derived CaAl2O4:Dy3+ (0.8 mol%). The dash line represents the threshold luminance of 0.32 mcd m−2. | ||
Being distinctly different from PL decay, the afterglow phenomenon is a particular case of thermostimulated luminescence and is a defect dependent phenomenon.7,38 Additional notes can be found in the ESI.† The afterglow duration of CaAl2O4:Dy3+ heavily depends on the wavelength of ultraviolet excitation. The afterglow of CaAl2O4:Dy3+ (0.8 mol%) lasts for about 60 s when the 325 nm excitation of the He–Cd laser (13 mW) is switched off. Conversely, the afterglow of CaAl2O4:Dy3+ (0.8 mol%) lasts for only 30 s when the 254 nm irradiation of a low-pressure mercury lamp (32 W) is turned off. Moreover, the afterglow duration of CaAl2O4:Dy3+ depends on the doping concentration when the wavelength of ultraviolet excitation is fixed. For example, after exposed to the 254 nm irradiation of a low-pressure mercury lamp (32 W) for 5 min, the afterglows of CaAl2O4:Dy3+ last for about 5, 8, 14, 19, 30, 60, 120, 75, 10 and 0 s when the doping concentrations are 0.1, 0.2, 0.4, 0.6, 0.8, 1.0, 2.0, 3.0, 4.0 and 5.0 mol%, respectively.
3.8 Possible PL and afterglow mechanisms of CaAl2O4:Dy3+
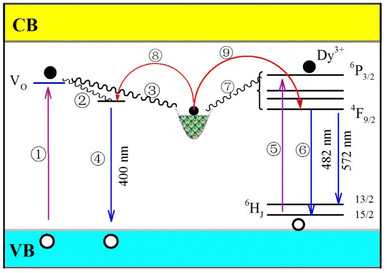
CaAl2O4 is an insulator with a bandgap of around 6.7 eV.39,40 Oxygen and calcium vacancies are intrinsic defects in CaAl2O4:Dy3+. On one hand, these intrinsic vacancies act as luminescence center of PL with the result of a broadband PL spectrum peaking at about 400 nm.15,16 On the other hand, these intrinsic vacancies work as traps for charged carriers. For example, oxygen vacancies in CaAl2O4 are proposed to work as electron traps because they are positively charged whereas calcium vacancies are potential hole traps because they are positively charged.10,39 Dopant Dy3+ belongs to extrinsic defect in CaAl2O4:Dy3+. After Dy3+ ions are incorporated into the host, a series of defect energy levels are introduced into the bandgap of CaAl2O4. The lowest energy level of the excited state of Dy3+ is known as 4F9/2 while the energy levels of the ground state of Dy3+ are denoted as 6HJ (J = 15/2–5/2). As evidenced by the characteristic emissions in Fig. 6, 7 and S3,† dopant Dy3+ ions act as luminescent center of PL in CaAl2O4:Dy3+ to yield narrowband emissions peaking at 482 and 574 nm, respectively. Furthermore, this extrinsic defect can work as electron trap because it is positively charged.Fig. 10 schematically illustrates the PL and afterglow mechanisms of CaAl2O4:Dy3+. The energy levels of oxygen vacancies and dopant Dy3+ are depicted in the bandgap of CaAl2O4. As shown in Fig. 10, oxygen vacancies and Dy3+ activator are two independent sets of photon absorbents in CaAl2O4:Dy3+. Upon the ultraviolet excitation at 325 nm (3.82 eV), a portion of the incident photons are absorbed by the host due to the presence of a large number of oxygen vacancies in CaAl2O4 (process ①). After non-radiative relaxations, the hot electrons are captured by either the oxygen vacancies (process ②) or the electron traps (process ③). The subsequent radiative recombination of electrons captured at oxygen vacancies with holes in the valence band of CaAl2O4 yields the broadband PL peaking at about 400 nm (process ④). Since the transition 6H15/2 → 6P3/2 of Dy3+ (326 nm) matches well with the 325 nm excitation of the laser, some incident photons are absorbed by Dy3+ activator in CaAl2O4 (process ⑤). It is noted that several energy levels are located between the excited state 6P3/2 and the lowest excited state 6H15/2, among which include 4I13/2, 4P5/2 and 6P7/2. With the assistance of phonons, a portion of hot electrons at the excited state 6P3/2 are relaxed to the lowest excited state 4F9/2. Then electron transitions 4F9/2 → 6H15/2 and 4F9/2 → 6H13/2 of Dy3+ lead to the characteristic emissions of Dy3+ (process ⑥). Apart from the radiation recombination, some hot electrons at excited states of Dy3+ can be captured by the electron traps via non-radiative relaxations (process ⑦). In the light of the proposed mechanisms in Fig. 10, the PL features of CaAl2O4:Dy3+ can be interpreted: (i) the PL spectrum of CaAl2O4:Dy3+ consists of one broadband and two characteristic emissions of Dy3+; and (ii) the characteristic emissions of Dy3+ becomes dominant over the broadband emissions when the population density of oxygen vacancies in CaAl2O4:Dy3+ is significantly suppressed via the solid state reaction at high temperatures.
Once the ultraviolet excitation is ceased, processes ①–⑦ are stopped immediately. Under thermal activation, electrons can be released from the electron traps via processes ⑧ and ⑨. Subsequently, afterglow with characteristic emissions of Dy3+ is resulted when the electrons released from the excited states of Dy3+ recombine radiatively with holes via process ⑥. Theoretically speaking, afterglow with broadband emissions peaking at about 400 nm should be observed when thermally detrapped electrons recombine radiatively with holes via process ④. In practice, such a broadband afterglow is negligible because its intensity is several orders of magnitude weaker than that of Dy3+ related afterglows. Therefore, the afterglow spectrum of the CaAl2O4:Dy3+ consists of two narrowband emissions peaking at 482 and 574 nm, respectively.
In the light of the PL and afterglow mechanisms of CaAl2O4:Dy3+ in Fig. 10, electrons in the electron traps contribute to the PL under photoexcitation, too. Upon the photoexcitation, some electrons in the electron traps are detrapped via processes ⑧ and ⑨. Broadband emissions peaking at around 400 nm can be expected when the detrapped electrons recombine radiatively with holes via the radiative process ④, and narrowband emissions of Dy3+ can be resulted when the detrapped electrons recombine radiatively with holes via the radiative process ⑥. In most cases, however, such contributions are negligible because they are many times weaker than the emissions resulted directly from the ultraviolet photoexcitation. Only when the afterglow is sufficiently strong, such contributions to the PL are discernible. For example, the PL spectrum of Dy3+ doped SrAl2O4 is the result of superposition of the broadband emissions of the host peaking at about 400 nm and another broadband emissions peaking at about 520 nm.12,13
3.9 TL glow curves of CaAl2O4:Dy3+
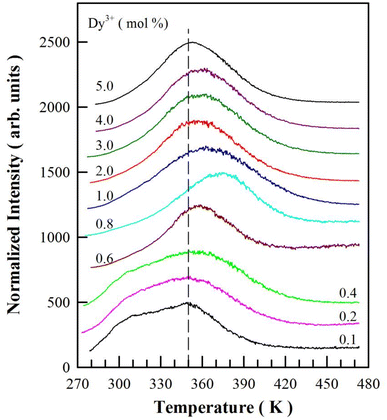
TL is an important tool to determine the activation energies (i.e., trap depths) of trapping levels in crystals.37,39,41,42 Fig. 11 represents the TL glow curves of sol–gel combustion derived CaAl2O4:Dy3+ with different doping concentrations. Each CaAl2O4:Dy3+ phosphor was exposed to ultraviolet light of 254 nm for 5 min before the TL measurements. The temperature rising rate was 2 K min−1. It can be seen that each TL glow curve in Fig. 11 exhibits an extremely broad and asymmetric profile, suggesting the presence of multiple trap levels in CaAl2O4:Dy3+.43 Moreover, both the profile and the peak temperature of the TL glow curve are sensitive to the doping concentration: (i) the TL glow curve consists of a primary peak at around 350 K and a secondary peak at about 310 K when the doping concentration increases from 0.1 to 0.4 mol%; (ii) the TL glow curve has only one peak, which gradually shifts to higher temperature (from 350 to 375 K) as the doping concentration increases from 0.6 to 0.8 mol%; and (iii) the TL glow curve has only one peak, which gradually shifts to lower temperature (from 375 to 350 K) as the doping concentration increases further from 1.0 to 5.0 mol%. The vertical dash line in Fig. 11 marks the position of 350 K. With the vertical line as a guideline, the evolution of the peak temperature with the doping concentration can be identified clearly. Interestingly, the peak temperature of the TL glow curve of CaAl2O4:Dy3+ (0.8 mol%) is the highest (around 375 K) among the 10 phosphors under test, which coincides with the best afterglow performance of CaAl2O4:Dy3+ at optimal doping concentration of 0.8 mol%.To understand the TL behavior of CaAl2O4:Dy3+, it is necessary to deconvolute each TL glow curve and evaluate the trapping parameters. The TL curve based on the general order function is given by the following equation:
 | (3) |
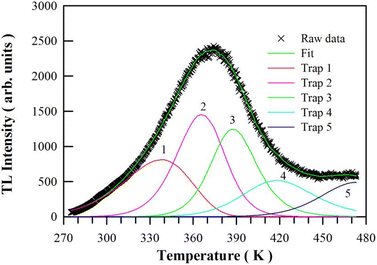 | ||
| Fig. 12 Computerized glow curve deconvolution of the TL glow curve of CaAl2O4:Dy3+ (0.8 mol%) under the assumption of 5 traps in the phosphor. | ||
| Trap number | Tm (K) | E (eV) | s (s−1) | b | τ300 (h) | FOM (%) |
|---|---|---|---|---|---|---|
| 1 | 339.25 | 0.3919 | 9.234 × 10² | 1.000 | 1.93 × 100 | 2.071 |
| 2 | 365.55 | 0.8219 | 4.810 × 10⁸ | 1.482 | 2.11 × 10² | |
| 3 | 386.45 | 1.1466 | 2.256 × 10¹² | 2.000 | 1.02 × 10⁶ | |
| 4 | 418.95 | 0.8403 | 2.336 × 10⁷ | 2.000 | 4.71 × 10⁵ | |
| 5 | 472.85 | 1.0352 | 1.683 × 10⁸ | 2.000 | 1.59 × 10⁸ |
In addition to the TL glow curve shown in Fig. 12, we have also deconvoluted the TL glow curves of CaAl2O4:Dy3+ with the doping concentrations of 0.1, 0.2, 0.4, 0.6, 1.0, 2.0, 3.0, 4.0 and 5.0 mol%, respectively. For the sake of brevity, the computerized glow curve deconvolutions of the TL glow curves of CaAl2O4:Dy3+ are shown in ESI as Fig. S9–S17.† The kinetic parameters and the electron lifetime at room temperature are listed in Table S2† for each trap in the CaAl2O4:Dy3+. Apparently, the parameters of electron traps in CaAl2O4:Dy3+ can be effectively tuned via the control of doping concentration, which in turn can be exploited to modify the brightness and duration of the afterglow of CaAl2O4:Dy3+.
4. Conclusions
With doping concentration varying in the range of 0.1–5.0 mol%, a series of CaAl2O4:Dy3+ phosphors have been synthesized via sol–gel combustion technique. The PL and afterglow mechanisms of sol–gel combustion derived CaAl2O4:Dy3+ are explored by means of XRD, SEM, TEM, EDX, XPS, PL, afterglow spectroscopy and TL dosimetry. The PL spectrum of CaAl2O4:Dy3+, which consists of a broad PL band peaking at about 400 nm and the characteristic emissions of Dy3+, indicates that oxygen vacancies and Dy3+ work as two independent sets of luminescence center of PL for CaAl2O4:Dy3+. As a contrast, the afterglow spectrum of CaAl2O4:Dy3+ consists of the characteristic emissions of Dy3+ only, verifying that dopant Dy3+ acts as the luminescence center of afterglow for CaAl2O4:Dy3+. The afterglow duration of CaAl2O4:Dy3+ is found to depend on the doping concentration, and 115 min-long afterglow is recorded for CaAl2O4:Dy3+ at the optimal doping concentration of 0.8 mol%. The profile and peak temperature of the TL glow curve are sensitive to the doping concentration. The TL glow curve of CaAl2O4:Dy3+ (0.8 mol%) exhibits a maximal peak temperature at around 375 K. A picture on the PL and afterglow mechanisms is given to reveal the processes of excitation, migration, trapping, detrapping, and radiative recombination of charged carriers in CaAl2O4:Dy3+.Conflicts of interest
There are no conflicts to declare.Acknowledgements
Financial support from National Natural Science Foundation of China (no. 11574036) is acknowledged.References
- P. F. Smet, N. Avci, K. Van den Eeckhout and D. Poelman, Extending the afterglow in CaAl2O4: Eu, Nd persistent phosphors by electron beam annealing, Opt. Mater. Express, 2012, 2, 1306–1313 CrossRef CAS.
- A. H. Wako, B. F. Dejene and H. C. Swart, Roles of doping ions in afterglow properties of blue CaAl2O4: Eu2+, Nd3+ phosphors, Phys. B, 2014, 439, 153–159 CrossRef CAS.
- B. G. Zhai, H. Xu and Y. M. Huang, Annealing temperature dependent afterglow of Tb3+ doped CaAl2O4, Opt. Mater., 2021, 112, 110739 CrossRef CAS.
- B. G. Zhai and Y. M. Huang, Extending the afterglow of Tb3+ doped CaAl2O4 to 8 hours via the control of doping concentration, J. Lumin., 2022, 244, 118725 CrossRef CAS.
- R. Shrivastava, J. Kaur and V. Dubey, White light emission by Dy3+ doped phosphor matrices: a short review, J. Fluoresc., 2016, 26, 105–111 CrossRef CAS PubMed.
- B. Liu, C. Shi and Z. Qi, Potential white-light long-lasting phosphor: Dy3+-doped aluminate, Appl. Phys. Lett., 2005, 86, 191111 CrossRef.
- K. Van den Eeckhout, P. F. Smet and D. Poelman, Persistent luminescence in Eu2+-doped compounds: a review, Materials, 2010, 3, 2536–2566 CrossRef CAS.
- B. G. Zhai and Y. M. Huang, Green afterglow of undoped SrAl2O4, Nanomaterials, 2021, 11, 2331 CrossRef CAS PubMed.
- M. Ziyauddin, S. Tigga, N. Brahme and D. P. Bisen, Photoluminescence and thermoluminescence studies of CaAl2O4:Dy3+ phosphor, Lumin, 2016, 31, 76–80 CrossRef CAS PubMed.
- V. Vitola, D. Millers, I. Bite, K. Smits and A. Spustaka, Recent progress in understanding the persistent luminescence in SrAl2O4:Eu, Dy, Mater. Sci. Technol., 2019, 35, 1661–1677 CrossRef CAS.
- Q. L. Ma, B. G. Zhai and Y. M. Huang, Effect of sol–gel combustion temperature on the luminescent properties of trivalent Dy doped SrAl2O4, Ceram. Int., 2015, 41, 5830–5835 CrossRef CAS.
- Y. M. Huang and Q. L. Ma, Long afterglow of trivalent dysprosium doped strontium aluminate, J. Lumin., 2015, 160, 271–275 CrossRef CAS.
- B. G. Zhai, L. Yang, Q. L. Ma, X. Liu and Y. M. Huang, Mechanism of the prolongation of the green afterglow of SrAl2O4:Dy3+ caused by the use of H3BO3 flux, J. Lumin., 2017, 181, 78–87 CrossRef CAS.
- N. Yamashita, T. Hamada, M. Takada, M. Katsuki and M. Nakagawa, Photoluminescence and thermoluminescence of MgSO4, CaSO4, SrSO4 and BaSO4 powder phosphors activated with Tb3+, Jpn. J. Appl. Phys., Part 1, 2001, 40, 6732–6736 CrossRef CAS.
- B. G. Zhai and Y. M. Huang, Blue afterglow from undoped CaAl2O4, Europhys. Lett., 2019, 127, 17001 CrossRef CAS.
- B. G. Zhai, H. Xu, F. Zhuo and Y. M. Huang, Annealing temperature dependent photoluminescence and afterglow of undoped CaAl2O4, J. Alloys Compd., 2020, 821, 153563 CrossRef CAS.
- K. A. Gedekar, S. P. Wankhede, S. V. Moharil and R. M. Belekar, d–f luminescence of Ce3+ and Eu2+ ions in BaAl2O4, SrAl2O4 and CaAl2O4 phosphors, J. Adv. Ceram., 2017, 6, 341–350 CrossRef CAS.
- R. D. Shannon, Revised effective ionic radii and systematic studies of interatomic distances in halides and chaleogenides, Acta Crystallogr., Sect. A: Cryst. Phys., Diffr., Theor. Gen. Crystallogr., 1976, 32, 751–767 CrossRef.
- B. G. Zhai and Y. M. Huang, Green photoluminescence and afterglow of Tb doped SrAl2O4, J. Mater. Sci., 2017, 52, 1813–1822 CrossRef CAS.
- B. G. Zhai, Q. L. Ma, R. Xiong, X. Li and Y. M. Huang, Blue-green afterglow of BaAl2O4:Dy3+ phosphors, Mater. Res. Bull., 2016, 75, 1–6 CrossRef CAS.
- V. Singh, J.-J. Zhu, M. K. Bhide and V. Natarajan, Synthesis, characterisation and luminescence investigations of Eu activated CaAl2O4 phosphor, Opt. Mater., 2007, 30, 446–450 CrossRef CAS.
- N. Takeuchi and K. Kishine, Effect of addition of boron on the long afterglow property of SrAl2O4: Eu2+, Dy3+ phosphor, Mater. Trans., 2021, 62, 1039–1045 CrossRef CAS.
- R. Shrivastava, J. Kaur and M. Dash, Studies on white light emission of Sr2MgSi2O7 doped with Dy3+ phosphors, Superlattices Microstruct., 2015, 82, 262–268 CrossRef CAS.
- P. P. Pawar, S. R. Munishwar and R. S. Gedam, Physical and optical properties of Dy3+/Pr3+ co-doped lithium borate glasses for W-LED, J. Alloys Compd., 2016, 660, 347–355 CrossRef CAS.
- X. Chen, T. Lu, Y. Wu, N. Wei, J. Qi, L. Chen and Y. Liu, Ammonium citrate-assisted combustion synthesis and photoluminescence properties of Dy:YAG nanophosphors, J. Sol-Gel Sci. Technol., 2016, 79, 606–615 CrossRef CAS.
- M. A. Tshabalala, F. B. Dejene, S. S. Pitale, H. C. Swart and O. M. Ntwaeaborwa, Generation of white-light from Dy3+ doped Sr2SiO4 phosphor, Phys. B, 2014, 439, 126–129 CrossRef CAS.
- Y. Chen, X. Cheng, M. Liu, Z. Qi and C. Shi, Comparison study of the luminescent properties of the white-light long afterglow phosphors: CaxMgSi2O5+x:Dy3+(x = 1,2,3), J. Lumin., 2009, 129, 531–535 CrossRef CAS.
- S. Cho, Photoluminescence properties of BaMoO4:RE3+ (RE = Eu, Sm, Dy, Tb, Tm) phosphors, J. Korean Phys. Soc., 2016, 69, 1479–1484 CrossRef CAS.
- A. Balakrishna and O. M. Ntwaeaborwa, Study of luminescent behavior and crystal defects of different MNa[PO4]-Dy3+ phosphors (M = Mg, Ca, Sr and Ba), Sens. Actuators, B, 2017, 242, 305–317 CrossRef CAS.
- B. Shanmugavelu and V. V. Ravi Kanth Kumar, Luminescence studies of Dy3+ doped bismuth zinc borate glasses, J. Lumin., 2014, 146, 358–363 CrossRef CAS.
- S. Xin and G. Zhu, The synthesis and photoluminescence properties investigation of a versatile phosphor Sr10[(PO4)5.5(BO4)0.5](BO2): Sb3+/Eu3+/Pr3+/Dy3+, J. Lumin., 2017, 181, 443–447 CrossRef CAS.
- Q. L. Ma, R. Xiong and Y. M. Huang, Tunable photoluminescence of porous silicon by liquid crystal infiltration, J. Lumin., 2011, 131, 2053–2057 CrossRef CAS.
- Q. L. Ma, B. G. Zhai and Y. M. Huang, Sol–gel derived ZnO/porous silicon composites for tunable photoluminescence, J. Sol-Gel Sci. Technol., 2012, 64, 110–116 CrossRef CAS.
- B. G. Zhai and Y. M. Huang, Doping concentration dependent photoluminescence and afterglow of Eu2+ doped CaAl2O4 for insight into the afterglow mechanisms, Phys. B, 2022, 646, 414284 CrossRef CAS.
- B. G. Zhai, H. Xu, Q. Zhang and Y. M. Huang, Blue photoluminescence and cyan-colored afterglow of undoped SrSO4 nanoplates, ACS Omega, 2021, 6, 10129–10140 CrossRef CAS PubMed.
- T. Aitasalo, J. Holsa, H. Jungner, M. Lastusaari and J. Niittykoski, Comparison of sol–gel and solid-state prepared Eu2+ doped calcium aluminates, Mater. Sci., 2002, 20, 15–20 CAS.
- T. Aitasalo, J. Holsa, H. Jungner, M. Lastusaari, J. Niittykoski, M. Parkkinen and R. Valtonen, Eu2+ doped calcium aluminates prepared by alternative low temperature routes, Opt. Mater., 2004, 26, 113–116 CrossRef CAS.
- D. L. Fritzen, L. Giordano, L. C. V. Rodrigues and J. H. S. K. Monteiro, Opportunities for persistent luminescent nanoparticles in luminescence imaging of biological systems and photodynamic therapy, Nanomaterials, 2020, 10, 2015 CrossRef CAS PubMed.
- T. Aitasalo, J. Hölsä, H. Jungner, M. Lastusaari and J. Niittykoski, Thermoluminescence study of persistent luminescence materials: Eu2+– and R3+–doped calcium aluminates, CaAl2O4:Eu2+,R3+, J. Phys. Chem. B, 2006, 110, 4589–4598 CrossRef CAS PubMed.
- J. Holsa, T. Laamanen, M. Lastusaari, M. Malkamaki, J. Niittykoski and P. Novák, Synchrotron radiation spectroscopy of rare earth doped persistent luminescence materials, Radiat. Phys. Chem., 2009, 78, S11–S16 CrossRef CAS.
- R. K. Gartia, M. N. Singh, L. P. Chanu and T. B. Singh, Determination of thermoluminescence parameters in nanocrystalline CaAl2O4, J. Lumin., 2020, 219, 116867 CrossRef CAS.
- M. N. Singh and R. K. Gartia, The physical basis of persistence luminescence in CaAl2O4 lattice based afterglow phosphors, AIP Conf. Proc., 2021, 2352, 020087 CrossRef CAS.
- R. K. Gartia and M. N. Singh, Deconvolution of thermoluminescence curves and its implications: the case of CaAl2O4:Sm3+, Optik, 2021, 248, 168048 CrossRef CAS.
- K. S. Chung, J. I. Lee and J. L. Kim, A computer program for the deconvolution of the thermoluminescence glow curves by employing the interactive trap model, Radiat. Meas., 2012, 47, 766–769 CrossRef CAS.
Footnote |
| † Electronic supplementary information (ESI) available. See DOI: https://doi.org/10.1039/d2ra05008k |
| This journal is © The Royal Society of Chemistry 2022 |

