 Open Access Article
Preparation of polyethersulfone/magnesium silicate membranes via casting and electrospinning and their application in the removal of free fatty acids from biodiesel†
Xiao Wang‡
 ,
Jiaxin Zhu‡
 ,
Shuwei Xia
 and
Haizeng Wang
 *
*
Key Laboratory of Marine Chemistry Theory and Technology, Ministry of Education, College of Chemistry and Chemical Engineering, Ocean University of China, Qingdao 266100, China. E-mail: haizwang@ouc.edu.cn
First published on 28th September 2022
Abstract
Due to the reversible nature of reactions in biodiesel production, a purification process is necessary for the biodiesel to meet international standards. As an effective method, dry washing has been applied in biodiesel purification for years, but it still faces limitations and challenges. In this work, a magnesium silicate (MS) was synthesized using the hydrothermal method. Two types of composite membranes were prepared by doping the prepared magnesium silicate into polyethersulfone (PES) via casting and electrospinning, respectively. Structural and physical properties of the composite membranes were characterized. The composite membranes were applied as adsorbents to remove free fatty acids (FFAs) from crude biodiesel. Adsorption isotherm and kinetic studies were performed at different temperatures (20, 40 and 60 °C). For both membranes, the obtained adsorption capacity was higher at low temperature (20 °C). Maximum adsorption capacity was found with the electrospun membrane to be 852 mg g−1, calculated from the Langmuir model. Adsorption kinetics for both membranes can be well described using the pseudo-second-order model. In addition, the internal diffusion was not negligible during the adsorption process based on the intraparticle diffusion analysis. As revealed by thermodynamic study, the adsorption processes were all exothermic with a spontaneous nature. Reusability of the membrane adsorbents was evaluated, in which the electrospun membrane showed a promising performance with 94% adsorption capacity remaining over 8 cycles of adsorption and desorption.
1. Introduction
In recent years, biodiesel as an alternative fuel has gained significant attention for its eco-friendly properties compared to fossil fuel. Biodiesel is a biodegradable and sustainable mixture of mono-alkyl esters of long chain fatty acids derived from vegetable oils, animal fats, and even waste frying oils through alkali-catalyzed processes.1 With comparable physicochemical properties to diesel fuel, biodiesel can be used directly to run diesel engines. In comparison to petroleum diesel, biodiesel has higher inherent lubricity and flash point which facilitate its ignition properties. Additionally, biodiesel has much lower harmful emissions due to its lower sulphur content and aromatic content.2 For practical application of biodiesel, it is important to reduce free fatty acids (FFAs) to desirable levels (usually below 1 wt%).3 The remaining FFAs would cause deterioration of biodiesel quality (such as acid values, flash point and viscosity) which leads to poor engine performance, or even damages the engine.4 In industrial production of biodiesel, acid esterification and enzymatic processes were mostly used to reduce the FFAs content.5 However, commercial products of biodiesel still contain 2–3 wt% of FFAs (regardless of feedstock) due to equilibrium limits of the reaction.6Conventionally, the produced biodiesel was purified by wet washing which generates a large amount of wastewater and soapstock. Alternatively, dry washing methods are usually applied to avoid such problems.7 The most commonly used adsorbents include silica, activated carbon, clay, magnesium silicate powder, diatomaceous earth and ion exchange resins. Manuale et al. studied the adsorption performance for the removal of FFAs using several commonly used adsorbents and found the silica TriSyl 3000 with the highest adsorption capacity reaching 1 g g−1.8 Using the activated carbon based adsorbents, Pereira et al. efficiently removed near 100% of FFAs with sorption capacities higher up to 2.75–7 g g−1,9 while Rengga et al. found a 27.404 mg g−1 adsorption capacity of FFAs.10 By applying different resins, Wirawan et al. obtained the highest sorption capacity of 230 mg g−1 towards FFAs;11 Khedkar et al. found the maximum adsorption capacity of 454.55 g kg−1;12 Jamal et al. reported the adsorption capacity of 250 mg g−1.13 Shafizah et al. reported a potassium oxide/dolomite adsorbent to remove FFAs in crude palm oil (CPO) highly up to 63%.14 Cano et al. reported a magnetic separation method by using iron oxide nanoparticles to remove FFAs in vegetable oils obtaining the maximum adsorption capacity of 125 mg g−1.15 Adewuyi et al. synthesized an amine imprinted manganese ferrite to remove FFAs with the sorption capacity of 139.40 L kg−1.16
Magnesium silicate (MS) as a typical example of silicates has been studied in wastewater treatment and non-aqueous adsorptions for years.17–20 With great efforts, research has been focused on the preparation of magnesium silicates with unique nanostructure and morphology to be able to effectively remove inorganic/organic pollutants.21–23 One of the most commonly used magnesium silicates adsorbent for dry washing of crude biodiesel is Magnesol®, which is composed of magnesium silicate and anhydrous sodium sulfate.24,25 Apart from FFAs, it has been proven that Magnesol® can also efficiently reduce free glycerol, glycerides and soap in biodiesel.4 Rudiyanto et al. reported a systematic study on optimization on the utilization of hydrate magnesium silicate on the dry washing purification with independent variables of adsorbent concentration, temperature and time.26 Although the dry washing methods were studied for years, such technique has not yet been widely used in industry applications due to the cost and recycling of the solid adsorbents.27 Therefore, it is important to find adsorbents with low cost and easy to be recycled for biodiesel purification.
Membrane technology is considered as a novel approach to purify crude biodiesel, however there must be a lot of research to do for the application of membranes in non-aqueous environment prior to be employed at industrial level.28,29 Additionally, conventional porous polymeric membranes have their intrinsic drawbacks for liquid filtration such as fouling problem and low flux. Lately, electrospinning as an advanced fabrication process has been massively discussed in membrane technology. By means of electrospinning, porous nanofiber membranes with enhanced mechanical property as well as larger surface area can be easily fabricated.30,31 Electrospun nanofiber membrane presents better geometrical structure of the pores which leads to improvement of pore size distribution. Thus, it could overcome the abovementioned limitations with the conventional polymeric membranes. Polyethersulfone (PES) is a class of high-temperature engineering thermoplastics with good chemical and thermal stability that has been highly studied in membrane science. However, with its inherent hydrophobic characteristics, PES was found to be susceptible to fouling during filtration processes especially in aqueous and protein contacting environments.32,33 Using the electrospinning method, Wu et al. fabricated nanoporous PES fiber mats with 175.98 mg g−1 adsorption capacity for bilirubin, which showed good prospects for the electrospun PES fiber membrane to be employed in adsorption applications.34 As an efficient way of membrane surface modification, blending/additives technique showed a promising effect to improve the hydrophilicity, surface roughness, surface charge, and the pore size of the membrane.35 The blending or incorporating additives methods have been developed with remarkable progress in the manufacturing of PES membrane for applications of hemodialysis, water and wastewater treatment.36 To our knowledge, the composite of PES and any magnesium silicate has been rarely reported.37 In the past few years, we have been studied on the PES/magnesium silicates composite membranes for dye removal in aqueous solutions.38,39 By means of casting, composite membranes were prepared with quite large surface area and adequate uniformity. Such membranes were successfully employed as adsorbents to remove methylene blue in aqueous solution without bring secondary contamination.
In this paper, we prepared two PES/MS composite membranes via solvent casting and electrospinning to remove the FFAs in crude biodiesel. Adsorbent characteristics were investigated by their morphology, crystallinity, chemical composition, thermal behavior and mechanical property. Different contents of MS were blended into the PES membranes to obtain the composite membranes with the optimal performance. Adsorption processes of FFAs onto the casted and electrospun membranes were evaluated at different temperatures. Adsorption isotherms, kinetics, and thermodynamics were analyzed using several well-established models and theories.
2. Materials and methods
2.1. Synthesis of the MS
Information of the chemicals used in this work and their disposal is described in ESI (Text S1†). 0.5 mol L−1 aqueous solutions of magnesium chloride and sodium silicate (SiO2![[thin space (1/6-em)]](https://www.rsc.org/images/entities/char_2009.gif) :
:![[thin space (1/6-em)]](https://www.rsc.org/images/entities/char_2009.gif) Na2O molar ratio of 3.28) were prepared respectively using the deionized water (DI water). Two precursors were mixed thoroughly and stirred at 500 rpm for 4 h until homogeneous white emulsion was formed. Subsequently, the mixture was transferred to the Teflon lined stainless steel autoclaves and heated at 110 °C for 12 h. The precipitates were filtered and rinsed with distilled water several times until there was no Cl− left. The slurry was dried at 60 °C for 24 h then calcined at 480 °C for 5 h.
Na2O molar ratio of 3.28) were prepared respectively using the deionized water (DI water). Two precursors were mixed thoroughly and stirred at 500 rpm for 4 h until homogeneous white emulsion was formed. Subsequently, the mixture was transferred to the Teflon lined stainless steel autoclaves and heated at 110 °C for 12 h. The precipitates were filtered and rinsed with distilled water several times until there was no Cl− left. The slurry was dried at 60 °C for 24 h then calcined at 480 °C for 5 h.
2.2. Preparation of the PES/MS composite membranes
Fibrous PES/MS membranes were prepared by electrospinning. Briefly, polyethersulfone (PES) was dissolved in the mixed solvent with 1![[thin space (1/6-em)]](https://www.rsc.org/images/entities/char_2009.gif) :
:![[thin space (1/6-em)]](https://www.rsc.org/images/entities/char_2009.gif) 3 ratio of tetrahydrofuran (THF)/N,N-dimethylformamide (DMF). Different amounts of the MS (0, 1, 2, 3 wt%) were added into the PES and kept magnetic stirring at 80 °C for 24 h. The mixture solution was then transferred into a 20 mL syringe. For electrospinning, the flow rate was set as 0.4 mL h−1; the applied voltage was 12 kV; the distance between the tip and target was 5 cm. All the electrospinning processes were conducted under ambient conditions at 23 ± 3 °C with the relative humidity of 40 ± 5%. Finally, the membranes were dried in vacuum at 45 °C for 24 h to remove any residual solvent. Thickness of the electrospun membrane was ∼160 μm.
3 ratio of tetrahydrofuran (THF)/N,N-dimethylformamide (DMF). Different amounts of the MS (0, 1, 2, 3 wt%) were added into the PES and kept magnetic stirring at 80 °C for 24 h. The mixture solution was then transferred into a 20 mL syringe. For electrospinning, the flow rate was set as 0.4 mL h−1; the applied voltage was 12 kV; the distance between the tip and target was 5 cm. All the electrospinning processes were conducted under ambient conditions at 23 ± 3 °C with the relative humidity of 40 ± 5%. Finally, the membranes were dried in vacuum at 45 °C for 24 h to remove any residual solvent. Thickness of the electrospun membrane was ∼160 μm.
As comparison, conventional PES/MS membranes were also fabricated by solvent casting. In brief, certain amount of PES was well dissolved in N,N-dimethylacetamide (DMAc). Then, the prepared MS was dispersed in the PES (DMAc) solution with fully stirring overnight at 80 °C. Before casting, the mixture was set to cool down to room temperature without any bubble. The thin film of the dope solution was deposited on a clean glass plate using a casting knife. The glass plate with the casted film was then immediately immersed in DI water for phase inversion. The casted membranes with thickness of ∼200 μm were prepared for FFAs adsorption after drying at room temperature for 24 h.
The formulations of all casting solutions for either the casted or electrospun membranes are described in Table S1.†
2.3. Characterization of the MS and composite membranes
The composition of the as-prepared MS was determined by titration and weighting. Briefly, the obtained product was first mixed with certain amount of solid NH4Cl. Then the powdery mixture was fully dissolved by adding the concentrated HCl and few drops of HNO3 at 80 °C in a water bath. The solid residua was separated from the liquid mixture through vacuum filtration. Hot DI water was used to rinse the residua to remove any chloride ion. The collected solid residua was calcinated at 600 °C for 4 h then at 850 °C for 0.5 h and repeated the calcination process until a constant weight was achieved. The mass of SiO2 in the MS was obtained by weighting the calcinated solid. To determine the content of Mg in the MS, all the liquid mixture from the abovesaid filtration process was collected then titrated with the ethylene-diamine-tetra-acetate (EDTA).40Surface morphology and elemental spectral of the MS and composite membranes were analyzed by scanning electron microscopy (SEM) and energy dispersive spectrum (EDS), respectively (S-4800, Hitachi, Japan). Samples were dried overnight and coated with gold before scanning. Crystalline structure of the membranes was determined by X-ray diffraction (XRD, Bruker D8 Advance Discover diffractometer) with Cu Kα radiation (λ = 1.5418 Å). For determination of the specific surface area, nitrogen adsorption–desorption isotherms at 77 K were obtained by gas adsorption analyzer (NOVA 2200e, Quantachrome, USA) and Brunauere–Emmette–Teller (BET) model was applied. Functional groups on MS were analyzed by Fourier transform infrared spectroscopy (FT-IR) (Bruker Tensor 27, Germany). Thermogravimetric analysis-differential thermal analysis (TG-DTA) was carried out using a thermal analyzer (HTC-3, HENVEN, China) under air flow from 23 to 800 °C with a heating rate of 10 °C per minute. Tensile tests of the membranes were performed at room temperature using a computer-controlled universal testing machine (GT-TCS-2000, China).
2.4. Removal of FFAs
Physical–chemical properties of the crude biodiesel are listed in Table S2.† The concentration of FFAs in biodiesel was determined using titration method according to ISO 660:2020.41 Since oleic acid (OA) is the most abundant FFA, the acidity of biodiesel is expressed in micrograms of OA per grams of biodiesel, assuming that all FFAs are OA. The adsorption experiments were performed by adding 0.36 g PES/MS membrane to 25 mL of biodiesel. The suspension was oscillated for several hours at given temperature. Then, 3 g of the purified biodiesel sample was resolved in 50 mL of 1![[thin space (1/6-em)]](https://www.rsc.org/images/entities/char_2009.gif) :
:![[thin space (1/6-em)]](https://www.rsc.org/images/entities/char_2009.gif) 1 (v/v) ethanol
1 (v/v) ethanol![[thin space (1/6-em)]](https://www.rsc.org/images/entities/char_2009.gif) :
:![[thin space (1/6-em)]](https://www.rsc.org/images/entities/char_2009.gif) ether solution. The supernatant of the suspension were titrated with 0.1 N potassium hydroxide (KOH) solution in 95% ethanol against phenolphthalein until the pale pink color appeared. In addition to the crude biodiesel, various amounts of OA were added in soybean oil to prepare ester mixtures with different acid values to investigate maximum adsorption capacity of the composite membranes. Concentration of the FFAs in biodiesel was calculated by eqn (1) expressed as mg g−1 of OA. All the measurements were performed in triplicate.
ether solution. The supernatant of the suspension were titrated with 0.1 N potassium hydroxide (KOH) solution in 95% ethanol against phenolphthalein until the pale pink color appeared. In addition to the crude biodiesel, various amounts of OA were added in soybean oil to prepare ester mixtures with different acid values to investigate maximum adsorption capacity of the composite membranes. Concentration of the FFAs in biodiesel was calculated by eqn (1) expressed as mg g−1 of OA. All the measurements were performed in triplicate.
 | (1) |
 | (2) |
 | (3) |
To evaluate desorption and reusability of the composite membranes, the used membranes were washed by sonication with ethanol for 24 h. After rinsing with ethanol for several times until neutral pH, the membranes were dried at 60 °C for a repeat round of FFAs adsorption in biodiesel. The reusability of the composite membranes were evaluated after 8 cycles of adsorption using 3 membranes for each cycle.
3. Results and discussion
3.1. Characteristics of the PES/MS composite membranes
Tensile strength and adsorption capacities of the PES/MS composite membranes with different MS contents were tested as shown in Fig. 1. It appears that with the addition of MS, tensile strength of the PES membrane decreased for both the casted and electrospun membranes, while the overall adsorption capacities improved. For the casted membrane, its mechanical property saw a fast deterioration with MS addition over 1.0 wt%. Adsorption capacity of the casted membrane showed a slight increase by adding MS to 2.0 wt%, but intensely declined with MS addition to 3.0 wt%. The electrospun membrane showed relatively milder changes in its tensile strength and FFAs removal property with the addition of MS. Based on their mechanical and adsorption performance, 1.0 wt% was selected as the optical dosage of MS in both the casted and electrospun membranes for their following evaluations.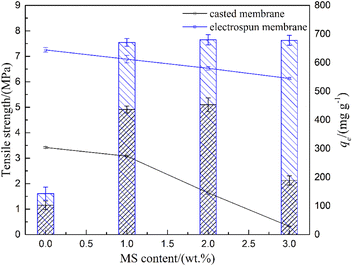 | ||
| Fig. 1 Tensile strength (lines) and adsorption capacities (columns) of the composite membranes with different MS contents. | ||
The SiO2/Mg molar ratio of the as-prepared MS was determined as 2.09![[thin space (1/6-em)]](https://www.rsc.org/images/entities/char_2009.gif) :
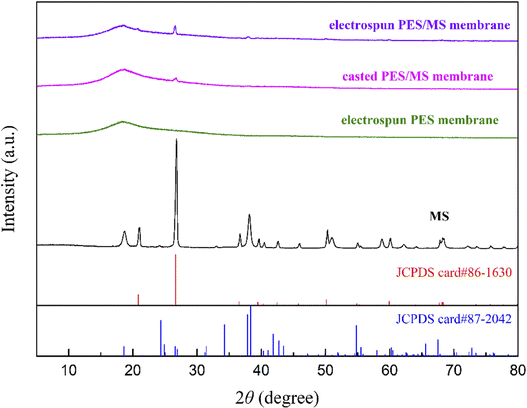
:![[thin space (1/6-em)]](https://www.rsc.org/images/entities/char_2009.gif) 1. As shown in Fig. 2, the XRD pattern of the MS indicated its crystal composition of Mg2SiO4 (JCPDS no. 87-2042) and quartz (JCPDS no. 86-1630). The pure PES membrane was in an amorphous state. By doping the MS, both the PES/MS composite membranes showed clear characteristic peaks of quartz at 2θ = 26.6°. The electrospun membrane showed more clear characteristic peaks of Mg2SiO4 at 2θ = 38.0°, 50° and 68°. The FTIR spectra of the adsorbents are shown in Fig. S1.† The addition of the MS caused an increase of transmittance on the composite membranes, but no influence on the characteristic bands, which might be due to the low content of the additive MS in the composite membranes. With same amount of MS doping on PES, the electrospun membrane showed higher transmittance compared with which of the casted membrane. Unlike the conventional blending using casting method in which inorganic dopant content was generally higher than 15 wt%, the MS dosage in this study for either membrane was only 1.0 wt%, thus the PES/MS composite membrane shows not much difference compared with the PES membrane in the FTIR spectrum. But in the XRD plots, additional peaks indicating characteristics of MS can be seen for the composite membranes, which confirmed the successful blending of the MS in composite membranes.
1. As shown in Fig. 2, the XRD pattern of the MS indicated its crystal composition of Mg2SiO4 (JCPDS no. 87-2042) and quartz (JCPDS no. 86-1630). The pure PES membrane was in an amorphous state. By doping the MS, both the PES/MS composite membranes showed clear characteristic peaks of quartz at 2θ = 26.6°. The electrospun membrane showed more clear characteristic peaks of Mg2SiO4 at 2θ = 38.0°, 50° and 68°. The FTIR spectra of the adsorbents are shown in Fig. S1.† The addition of the MS caused an increase of transmittance on the composite membranes, but no influence on the characteristic bands, which might be due to the low content of the additive MS in the composite membranes. With same amount of MS doping on PES, the electrospun membrane showed higher transmittance compared with which of the casted membrane. Unlike the conventional blending using casting method in which inorganic dopant content was generally higher than 15 wt%, the MS dosage in this study for either membrane was only 1.0 wt%, thus the PES/MS composite membrane shows not much difference compared with the PES membrane in the FTIR spectrum. But in the XRD plots, additional peaks indicating characteristics of MS can be seen for the composite membranes, which confirmed the successful blending of the MS in composite membranes.
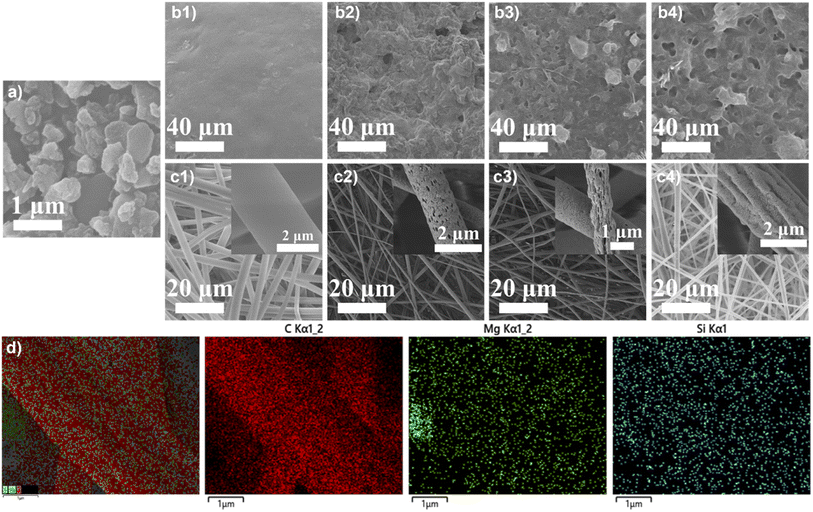
Morphology of the MS powder and composite membranes with different MS contents was investigated by SEM. The as-prepared MS powder shows an irregular flake shape (Fig. 3a). The casted PES membrane without MS doping shows a relatively smooth surface (Fig. 3b1). With the MS addition, surface of the composite membrane shows noticeable flaws with pores and aggregations. By adding more MS, the number and size of the pores on the membrane increase, while the uniformity of the surface decreases, which probably leads to the tensile strength drop of the composite casted membranes as shown in Fig. 1. The electrospun membranes, on the other hand, are more uniform which consist of interweaved fibers (Fig. 3c1–4), which endows them with the enhanced tensile strength as compared to the casted membranes.30 The pure electrospun PES membrane shows the thickest fibers with a smooth surface compared with the composite fibrous membranes (Fig. 3c1). With 1 wt% of MS doping, the electrospun membrane shows small pores on the fibers that are evenly distributed (Fig. 3c2). With further addition of MS, pores on the fibers become less and the surface of the fibers become rougher (Fig. 3c3 and c4). The fiber diameter of the composite membranes is smaller comparing to that of the pure electrospun PES membrane. Furthermore, distribution of the fiber diameter is uneven for the composite membranes. These might be the reasons for the decrease of tensile strength and increase of adsorption capacity by adding more MS into the electrospun PES membranes as discussed before. As shown in the elemental mapping (Fig. 3d), Mg and Si elements were uniformly distributed on the electrospun PES/MS membrane fibers, indicating that the chemical composition of the PES/MS electrospun membrane was homogeneous.
Fig. 4 shows the nitrogen adsorption–desorption isotherms of the PES membrane, MS powder, casted and electrospun PES/MS membranes. The isotherms can all be classified as type IV with hysteresis loop of type A for mesoporous materials.42,43 The Brunauer–Emmett–Teller (BET) surface area, average pore size and average pore volume of the adsorbents are listed in Table S3.† The MS had the average BET surface area of 590.3 m2 g−1 with pore volume of 0.5839 cm3 g−1. The PES membrane had much lower surface area and pore volume compared with the MS, which were only 43.29 m2 g−1 and 0.3583 cm3 g−1, respectively. By blending MS into the PES, both surface area and pore volume of the casted membrane showed an increase in comparison of the pure PES membrane, which is in accordance with the morphology changes as discussed before. On the other hand, surface area of the PES/MS casted membrane was not as high as that of the powdery MS, while PES/MS electrospun membrane showed higher surface area and pore volume compared to that of the MS. TG-DTA curves of the PES/MS electrospun membrane are shown in Fig. S2.† The weight loss of around 10% is observed at about 115 °C with an endothermic peak, which is attributed to the loss of the water adsorbed by MS particles. Between 450 and 750 °C, the weight loss of 28% corresponds to the decomposition of PES.
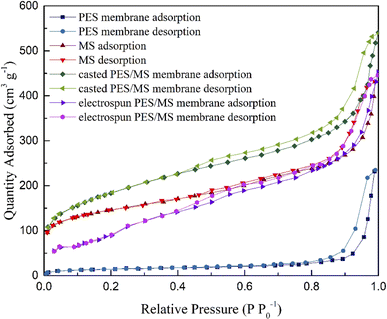 | ||
| Fig. 4 Nitrogen adsorption–desorption isotherms of pure PES membrane, powdery MS, casted and electrospun PES/MS membranes. | ||
3.2. Adsorption properties of FFAs on the PES/MS composite membranes
The crude biodiesel used in this study had a high acid value of 2.39 mg KOH g−1. Stability of the biodiesel was tested by monitoring acid values over time during 350 days of storage (Fig. S3†). The biodiesel was sealed and stored in dark at room temperature with a relative humidity of 35 ± 3%. It is noticed that the acid value of the biodiesel had merely changed in the first 60 days of storage. All the experiments had been done within a month, in which the acid value of the biodiesel can be considered as a constant. The adsorption performance on the powdery MS (0.6 g) and PES/MS composite membranes (0.36 g) were first compared by their equilibrium uptakes and removal efficiencies of the FFAs at 20 °C. As shown in Fig. S4,† the equilibrium adsorption capacities of the PES/MS composite membranes were higher than the powdery MS. But removal efficiency of the FFAs on the casted membrane was lower than that of the MS powder, which might be owing to its lower surface area and homogeneity. The electrospun membrane exhibited the highest adsorption capacity of 670 mg g−1, as well as the most efficient removal rate over 90%.To investigate maximum adsorption capacity of the adsorbents, adsorption isotherms were studied. The equilibrium data for the composite membranes at 20, 40 and 60 °C were presented in Fig. 5. Two classic isotherm models, Langmuir and Freundlich, were used to analyze the equilibrium data, equations of which are represented as follows:
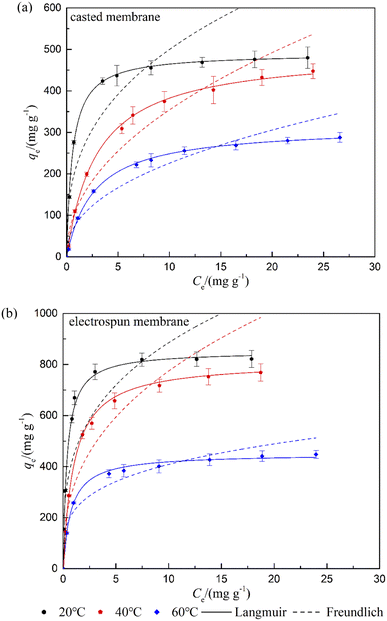 | ||
| Fig. 5 Adsorption isotherms and their best fitting plots based on the Langmuir and Freundlich models at different temperatures on the (a) casted and (b) electrospun PES/MS membranes. | ||
Langmuir isotherm model
 | (4) |
Freundlich isotherm model
| qe = KFCe1/n | (5) |
| T (°C) | Langmuir | Freundlich | |||||||
|---|---|---|---|---|---|---|---|---|---|
| Qm (mg g−1) | KL (g mg−1) | R2 | χ2 | KF (g1/n−1 mg1−1/n) | 1/n | R2 | χ2 | ||
| Casted membrane | 20 | 491 | 1.77 | 0.9973 | 2.12 | 222 | 0.351 | 0.8465 | 122 |
| 40 | 489 | 0.339 | 0.9984 | 0.48 | 119 | 0.475 | 0.9063 | 27.3 | |
| 60 | 315 | 0.374 | 0.9984 | 0.72 | 82.4 | 0.438 | 0.9072 | 40.9 | |
| Electrospun membrane | 20 | 852 | 2.72 | 0.9983 | 0.72 | 444 | 0.300 | 0.8055 | 79.9 |
| 40 | 812 | 0.981 | 0.9920 | 3.09 | 321 | 0.383 | 0.8173 | 70.0 | |
| 60 | 450 | 1.33 | 0.9982 | 0.31 | 225 | 0.259 | 0.8228 | 30.8 | |
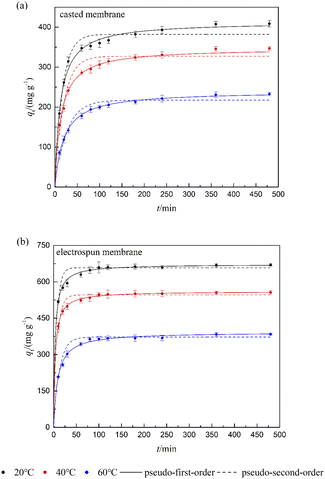
Adsorption rate and rate control step were investigated by adsorption kinetics. Fig. 6 shows the kinetic data for the FFAs at different temperatures as well as their fitting plots by applying the pseudo-first-order and pseudo-second-order models, equations of which are presented in eqn (6)–(9). Both the composite membranes showed fast adsorption of FFAs at the first 30 min. However, it took much longer time for the casted membrane to reach the equilibrium compared with the electrospun membrane.
Pseudo-first order kinetics model
 | (6) |
by integration, eqn (6) gives:
| qt = q(1 − e−K1t) | (7) |
Pseudo-second order kinetics model
 | (8) |
by integration, eqn (8) gives:
 | (9) |
| T (°C) | qe_exp (mg g−1) | Pseudo-first-order | Pseudo-second-order | ||||||||
|---|---|---|---|---|---|---|---|---|---|---|---|
| K1 (min−1) | qe_1 (mg g−1) | R2 | χ2 | K2 (g mg−1 min−1) | qe_2 (mg g−1) | R2 | χ2 | v0 (mg g−1 min−1) | |||
| Casted membrane | 20 | 437 | 0.076 | 402 | 0.9788 | 18.1 | 2.06 × 10⁻⁴ | 437 | 0.9939 | 5.21 | 39.4 |
| 40 | 341 | 0.057 | 319 | 0.9796 | 10.9 | 1.94 × 10⁻⁴ | 349 | 0.9957 | 2.31 | 23.6 | |
| 60 | 233 | 0.053 | 212 | 0.9735 | 10.7 | 2.55 × 10⁻⁴ | 234 | 0.9943 | 2.33 | 14.0 | |
| Electrospun membrane | 20 | 670 | 0.192 | 640 | 0.9613 | 65.7 | 3.85 × 10⁻⁴ | 670 | 0.9938 | 10.6 | 173 |
| 40 | 569 | 0.205 | 550 | 0.9773 | 14.6 | 4.90 × 10⁻⁴ | 573 | 0.9989 | 0.71 | 161 | |
| 60 | 384 | 0.090 | 368 | 0.9834 | 16.1 | 2.75 × 10⁻⁴ | 393 | 0.9929 | 6.90 | 42.5 | |
In order to evaluate the effect of diffusion on the adsorption process, the experimental kinetic data were further analyzed by the intraparticle diffusion model. The intraparticle diffusion model was first proposed by Weber and Morris in 1963.48 If the adsorption process is dominated by intraparticle diffusion only, a linear curve passing through the origin would be observed by plotting the adsorption capacity (qt) with the square root of time. The diffusion model is expressed as follows:
| qt = Kdt1\2 + C | (10) |
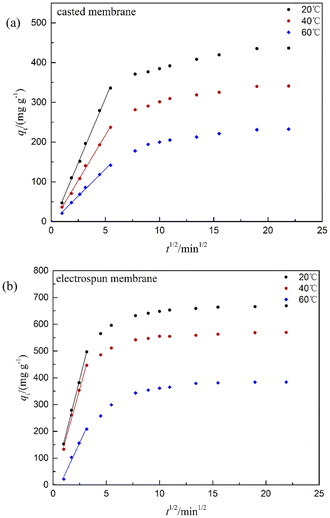 | ||
| Fig. 7 Intraparticle diffusion model plots of FFAs adsorption on the (a) casted and (b) electrospun PES/MS membranes. | ||
Thermodynamic study was carried out for predicting adsorption mechanisms through parameters of the Gibbs energy change (ΔG0), the enthalpy change (ΔH0), and the entropy change (ΔS0). Calculation of the thermodynamic parameters following the reported method from Maddikeri et al.50 Thermodynamic parameters were calculated from the variation in K0 (thermodynamic equilibrium constant, or the thermodynamic distribution coefficient) with the change in temperature. K0 was obtained by plotting ln(qe/Ce) versus Ce and extrapolating the data with Ce = 0.50,51 According to the laws of thermodynamics, ΔG0 was calculated from the K0 values using the following equation:
ΔG0 = −RT![[thin space (1/6-em)]](https://www.rsc.org/images/entities/char_2009.gif) ln ln![[thin space (1/6-em)]](https://www.rsc.org/images/entities/char_2009.gif) K0 K0
| (11) |
| ΔG0 = ΔH0 − TΔS0 | (12) |
by substituting eqn (11) into eqn (12), the van't Hoff equation is given as:
 | (13) |
by plotting ln![[thin space (1/6-em)]](https://www.rsc.org/images/entities/char_2009.gif) K0 versus 1/T, ΔH0 was obtained as the slope, and ΔS0 was determined as the intercept. K0 was determined by plotting ln(qe/Ce) versus Ce as shown in Fig. S5.† The plots of ln
K0 versus 1/T, ΔH0 was obtained as the slope, and ΔS0 was determined as the intercept. K0 was determined by plotting ln(qe/Ce) versus Ce as shown in Fig. S5.† The plots of ln![[thin space (1/6-em)]](https://www.rsc.org/images/entities/char_2009.gif) K0 versus 1/T are presented in Fig. 8. The calculated values of K0, ΔG0, ΔH0 and ΔS0 are shown in Table 3. The K0 values for both membranes are positive, which indicates that the amount of FFAs present per amount of the membrane is higher than the amount per unit weight of the stock solution. As temperature increases the K0 values decrease, which demonstrates that the thermodynamic equilibrium constant is higher at low temperature. Such results are in agreement with other works reported by Demirbas and Maddikeri et al. using bentonite and ion-exchange resins as adsorbents, respectively.52,53
K0 versus 1/T are presented in Fig. 8. The calculated values of K0, ΔG0, ΔH0 and ΔS0 are shown in Table 3. The K0 values for both membranes are positive, which indicates that the amount of FFAs present per amount of the membrane is higher than the amount per unit weight of the stock solution. As temperature increases the K0 values decrease, which demonstrates that the thermodynamic equilibrium constant is higher at low temperature. Such results are in agreement with other works reported by Demirbas and Maddikeri et al. using bentonite and ion-exchange resins as adsorbents, respectively.52,53
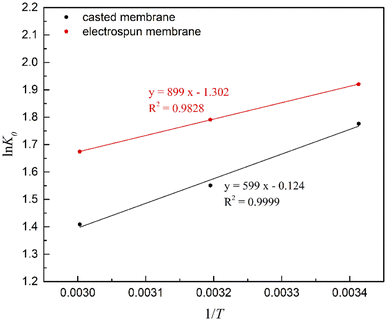 | ||
| Fig. 8 van't Hoff plots for determination of ΔH0 and ΔS0 for FFAs adsorption onto the casted and electrospun PES/MS membranes. | ||
| T (K) | K0 | ΔG0 (kJ mol−1) | ΔH0 (kJ mol−1) | ΔS0 (kJ mol−1) | |
|---|---|---|---|---|---|
| Casted membrane | 293 | 5.908 | −4.327 | −7.475 | −0.01082 |
| 313 | 4.717 | −4.037 | |||
| 333 | 4.092 | −3.901 | |||
| Electrospun membrane | 293 | 6.822 | −4.678 | −4.980 | −0.00103 |
| 313 | 5.994 | −4.660 | |||
| 333 | 5.337 | −4.637 |
ΔG0 values for either sorbent were negative, which indicates the spontaneous nature of the adsorption process. Values of the ΔG0 increase as the temperature rises, that suggests a more favorable adsorption at low temperature. The obtained ΔH0 values are negative; therefore, the process is exothermic, which is consistent with the adsorption results as presented above. For the entropy change, negative values were obtained, which indicates a less random orientation of FFAs in the adsorbed state. Similar results were reported by Maddikeri et al. with stearic and oleic acids as adsorbates.50 During the sorption, randomness at the solid-solution interface was reduced. However, positive K0 values indicate a preference of the adsorbate in the PES/MS membranes as compared to the stock solution. Such combination reveals the affinity of the FFAs on the PES/MS composite membranes over the biodiesel.
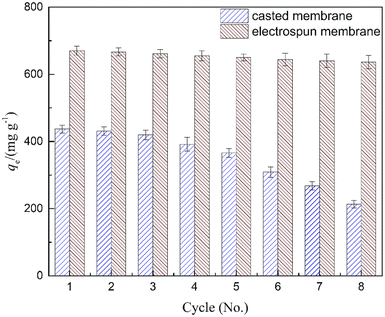
The reusability of the casted and electrospun membranes was investigated over 8 cycles of adsorption and desorption. To remove the adsorbed FFAs and residual oil, ethanol was used to wash the composite membranes.54 Upon sonication treatment with ethanol, quantitative desorption was achieved. As shown in Fig. 9, both composite membranes exhibited adequate reusability for subsequent adsorptions in the first 3 cycles. The casted membrane showed a significant deterioration after 3 rounds of tests. As shown in the SEM images (Fig. 3), the casted membrane contains irregular pores with different pore sizes, and its surface structure showed less uniformity comparing to the electrospun membrane, which probably leads to an internal fouling problem upon several times of biodiesel soaking. Therefore, the reusability of the casted membrane is undesirable after 3 rounds of adsorption–desorption. On the other hand, the electrospun membrane kept its adsorption capacity over 94% even after 8 cycles of adsorption–desorption, which demonstrates that the PES/MS electrospun membrane can be used repeatedly for at least 8 adsorption–desorption cycles with promising adsorption capacities as compared to the casted one.
4. Conclusions
The present work has prepared two PES/MS composite membranes by solvent casting and electrospinning and comparatively evaluated their adsorption performance for removing free fatty acids from crude biodiesel. Physical and chemical properties of the composited membranes were examined with several characterization techniques. Compared to the casted membrane, the electrospun membrane exhibited much higher performance in terms of tensile strength and FFAs removal owing to its uniform structure with high porosity. At all the investigated temperatures, the electrospun membranes showed higher adsorption capacities as compared to the casted ones. Adsorption isotherms were analyzed using the Langmuir and Freundlich models, between which the Langmuir model gave a better description for both composite membranes. Maximum adsorption capacity of the electrospun membrane reached 852 mg g−1, theoretically. Kinetics of the adsorption processes were investigated by pseudo-first-order, pseudo-second-order kinetic models along with the Weber–Morris intraparticle diffusion model. The electrospun membrane showed shorter contact time reaching the equilibrium compared with the casted membrane. Kinetic data of both membranes were found to fit better to the pseudo-second-order model. In addition, intraparticle diffusion played an essential role in the adsorption process together with surface reaction. For both the composite membranes, higher adsorption capacities were observed at lower temperatures. All the adsorption processes were of spontaneous nature and exothermic based on the thermodynamic studies. Reusability of the composites membranes was compared, in which the electrospun membrane exhibited a promising performance over 8 cycles of adsorption and desorption with an adsorption capacity decline less than 6%. Based on the abovementioned findings, the electrospun PES/MS membrane is suggested as a promising candidate for applications in the biodiesel purification.Author contributions
Xiao Wang: conceptualization, methodology, investigation, writing-review & editing. Jiaxin Zhu: writing-original draft, investigation, data curation, formal analysis. Shuwei Xia: data curation, validation, writing-review & editing. Haizeng Wang: resources, validation, writing-review & editing, supervision, project administration.Conflicts of interest
The authors declare that they have no known competing financial interests or personal relationships that could have appeared to influence the work reported in this paper.Acknowledgements
The authors would like to thank Dejing Zhu and Yali Zhang from Shiyanjia Lab (https://www.shiyanjia.com) for the XRD and EDX analysis. This work was supported by the Fundamental Research Funds For The Central Universities [grant number 201964021].References
- K. Shahbaz, F. S. Mjalli, M. A. Hashim and I. M. AlNashef, Sep. Purif. Technol., 2011, 81, 216–222 CrossRef CAS.
- Z. Yaakob, M. Mohammad, M. Alherbawi, Z. Alam and K. Sopian, Renewable Sustainable Energy Rev., 2013, 18, 184–193 CrossRef CAS.
- A. S. Elgharbawy, W. A. Sadik, O. M. Sadek and M. A. Kasaby, Biomass Bioenergy, 2021, 146, 105997 CrossRef CAS.
- C. S. Faccini, M. E. da Cunha, M. S. A. Moraes, L. C. Krause, M. C. Manique, M. R. A. Rodrigues, E. V. Benvenutti and E. B. Caramão, J. Braz. Chem. Soc., 2011, 22, 558–563 CrossRef CAS.
- A. Šalić, A. Jurinjak Tušek, M. Gojun and B. Zelić, Sep. Purif. Technol., 2020, 242, 116783 CrossRef.
- R. B. Hansen, M. A. Agerbaek, P. M. Nielsen, A. Rancke-Madsen and J. M. Woodley, Process Biochem., 2020, 97, 213–221 CrossRef CAS.
- L. Shi, L. Zheng, C. Zhao, J. Huang, Q. Jin and X. Wang, Ind. Crops Prod., 2018, 124, 797–805 CrossRef CAS.
- D. L. Manuale, G. C. Torres, J. M. Badano, C. R. Vera and J. C. Yori, Energy Fuels, 2013, 27, 6763–6772 CrossRef CAS.
- M. R. d. N. Pereira, A. B. Salviano, T. P. V. de Medeiros, M. R. D. Santos, T. E. Cibaka, M. H. C. de Andrade, A. de Oliveira Porto and R. M. Lago, Fuel, 2018, 221, 469–475 CrossRef CAS.
- W. D. P. Rengga, A. Seubsai, S. Roddecha, A. Yudistira and A. D. Wiharto, J. Phys.: Conf. Ser., 2021, 1918, 032008 CrossRef CAS.
- S. K. Wirawan, D. Timotius, I. M. Nugraha, A. Restana, A. L. Anggara and S. Hidayatullah, ASEAN J. Chem. Eng., 2022, 22, 33–41 CrossRef CAS.
- M. A. Khedkar, S. R. Satpute, S. B. Bankar and P. V. Chavan, J. Chem. Eng. Data, 2021, 66, 308–321 CrossRef CAS.
- Y. Jamal and B. O. Boulanger, J. Chem. Eng. Data, 2010, 55, 2405–2409 CrossRef CAS.
- I. Nor Shafizah, R. Irmawati, H. Omar, M. Yahaya and A. Alia Aina, Food Chem., 2022, 373, 131668 CrossRef CAS PubMed.
- M. Cano, K. Sbargoud, E. Allard and C. Larpent, Green Chem., 2012, 14, 1786–1795 RSC.
- A. Adewuyi, A. A. Yusuf, W. J. Lau, M. Hojamberdiev and R. A. Oderinde, Surf. Interfaces, 2020, 21, 100715 CrossRef CAS.
- F. Ferrero, J. Environ. Sci., 2010, 22, 467–473 CrossRef CAS.
- F. Ciesielczyk, A. Krysztafkiewicz and T. Jesionowski, Appl. Surf. Sci., 2007, 253, 8435–8442 CrossRef CAS.
- J. Qu, W. Li, C.-Y. Cao, X.-J. Yin, L. Zhao, J. Bai, Z. Qin and W.-G. Song, J. Mater. Chem., 2012, 22, 17222–17226 RSC.
- K. Kaya-Özkiper, A. Uzun and S. Soyer-Uzun, J. Hazard. Mater., 2022, 424, 127256 CrossRef PubMed.
- Q. Li, J. Zhang, Q. Lu, J. Lu, J. Li, C. Dong and Q. Zhu, Mater. Lett., 2016, 170, 167–170 CrossRef CAS.
- Q. Lu, Q. Li, J. Zhang, J. Li and J. Lu, Appl. Surf. Sci., 2016, 360, 889–895 CrossRef CAS.
- Y. Li, G. Tian, B. Chen and J. Liang, Sep. Purif. Technol., 2022, 291, 120953 CrossRef CAS.
- A. Casas, Á. Pérez and M. J. Ramos, Org. Process Res. Dev., 2017, 21, 1253–1258 CrossRef CAS.
- D. O. Cordeiro, A. D. Gondim, A. S. Araújo, M. M. da Conceição, A. G. de Souza and V. J. Fernandes, J. Therm. Anal. Calorim., 2017, 127, 1253–1260 CrossRef CAS.
- B. Rudiyanto, M. Andrianto, Y. Susmiati, N. Agung Pambudi and Riyanto, Energy Procedia, 2019, 158, 333–338 CrossRef CAS.
- D. L. Manuale, E. Greco, A. Clementz, G. C. Torres, C. R. Vera and J. C. Yori, Chem. Eng. J., 2014, 256, 372–379 CrossRef CAS.
- M. Catarino, E. Ferreira, A. P. Soares Dias and J. Gomes, Chem. Eng. J., 2020, 386, 123930 CrossRef CAS.
- M. C. S. Gomes, W. M. Moreira, S. M. Paschoal, C. C. Sipoli, R. M. Suzuki, J. G. Sgorlon and N. C. Pereira, Sep. Purif. Technol., 2021, 269, 118595 CrossRef CAS.
- J. Bae, I. Baek and H. Choi, Water Res., 2016, 105, 406–412 CrossRef CAS.
- J. Lin, B. Ding, J. Yu and Y.-l. Hsieh, ACS Appl. Mater. Interfaces, 2010, 2, 521–528 CrossRef CAS.
- H. Wang, L. Yang, X. Zhao, T. Yu and Q. Du, Chin. J. Chem. Eng., 2009, 17, 324–329 CrossRef CAS.
- Q. Shi, Y. Su, S. Zhu, C. Li, Y. Zhao and Z. Jiang, J. Membr. Sci., 2007, 303, 204–212 CrossRef CAS.
- K. Wu, W. Yang, X. Liu, Y. Jiao and C. Zhou, Mater. Lett., 2016, 185, 252–255 CrossRef CAS.
- K. C. Khulbe, C. Feng and T. Matsuura, J. Appl. Polym. Sci., 2010, 115, 855–895 CrossRef CAS.
- A. L. Ahmad, A. A. Abdulkarim, B. S. Ooi and S. Ismail, Chem. Eng. J., 2013, 223, 246–267 CrossRef CAS.
- Y. Yu, Z. Hu, Z. Chen, J. Yang, H. Gao and Z. Chen, RSC Adv., 2016, 6, 97523–97531 RSC.
- S. Han, L. Mao and H. Wang, Desalin. Water Treat., 2018, 105, 298–309 CrossRef CAS.
- Q. Wang, L. Mao and H. Wang, Chin. J. Environ. Eng., 2014, 8, 4296–4300 CAS.
- M. H. Carr and H. A. Frank, Am. J. Clin. Pathol., 1956, 26, 1157–1168 CrossRef CAS PubMed.
- International Organization for Standardization (ISO), ISO 660:2020 Animal and vegetable fats and oils—Determination of acid value and acidity, Geneva, Switzerland, 2020 Search PubMed.
- C. T. Kresge, M. E. Leonowicz, W. J. Roth, J. C. Vartuli and J. S. Beck, Nature, 1992, 359, 710–712 CrossRef CAS.
- K. S. W. Sing, Pure Appl. Chem., 1985, 57, 603–619 CrossRef CAS.
- C. H. Giles, D. Smith and A. Huitson, J. Colloid Interface Sci., 1974, 47, 755–765 CrossRef CAS.
- W. Clowutimon, P. Kitchaiya and P. Assawasaengrat, Eng. J., 2011, 15, 15–26 CrossRef.
- T. R. Sahoo and B. Prelot, in Nanomaterials for the Detection and Removal of Wastewater Pollutants, ed. B. Bonelli, F. S. Freyria, I. Rossetti and R. Sethi, Elsevier, 2020, pp. 161–222 Search PubMed.
- Y. S. Ho, D. A. J. Wase and C. F. Forster, Environ. Technol., 1996, 17, 71–77 CrossRef CAS.
- W. J. Weber and J. C. Morris, J. Sanit. Eng. Div., 1963, 89, 31–59 CrossRef.
- B. Obradovic, Hem. Ind., 2020, 74, 65–70 CrossRef.
- G. L. Maddikeri, A. B. Pandit and P. R. Gogate, Ind. Eng. Chem. Res., 2012, 51, 6869–6876 CrossRef CAS.
- A. A. Khan and R. P. Singh, Colloids Surf., 1987, 24, 33–42 CrossRef CAS.
- A. Demirbas, A. Sari and O. Isildak, J. Hazard. Mater., 2006, 135, 226–231 CrossRef CAS PubMed.
- O. Ilgen and H. S. Dulger, Ind. Crops Prod., 2016, 81, 66–71 CrossRef CAS.
- Y. Ahn and S.-Y. Kwak, Microporous Mesoporous Mater., 2020, 306, 110410 CrossRef CAS.
Footnotes |
| † Electronic supplementary information (ESI) available. See https://doi.org/10.1039/d2ra05322e |
| ‡ These authors contributed equally. |
| This journal is © The Royal Society of Chemistry 2022 |

