 Open Access Article
Microwave- and ultrasonic-assisted synthesis of 2D La-based MOF nanosheets by coordinative unsaturation degree to boost phosphate adsorption†
Ziguang Zhengabc,
Xiaomei Jiangabc,
Xiaowei Yangabc,
Min Maabc,
Siping Ji*ab and
Fengzhi Jiang *abc
*abc
aSchool of Chemical Science and Technology, Yunnan University, No. 2 Cuihu North Road, Kunming 650091, China. E-mail: fengzhij@ynu.edu.cn; 17210154@163.com
bResearch Center of Lake Restoration Technology Engineering for Universities of Yunnan Province (Yunnan University), School of Chemical Science and Technology, Yunnan University, Kunming, 650091, P. R. China
cWorkstation of Academician Chen Jing of Yunnan Province, Kunming, 650091, P. R. China
First published on 12th December 2022
Abstract
The metal or metal clusters and organic ligands are relevant to the selectivity and performance of phosphate removal in MOFs, and the electron structure, chemical characteristics, and preparation method also affect efficiency and commercial promotion. However, few reports focus on the above, especially for 2D MOF nanomaterials. In this work, two 2D Ln-TDA (Ln = La, Ce) nanosheets assembled via microwave- and ultrasonic-assisted methods are employed as adsorbents for phosphate (H2PO4−, HPO42−) removal for the first time. Their microstructure and performance were characterized using XRD, TEM, SEM, AFM, FTIR, zeta potential, and DFT calculations. The prepared 2D Ln-TDA (Ln = La, Ce) nanosheets exposed more adsorption sites and effectively reduced the restrictions of mass transfer. Based on this, the Langmuir model was employed to estimate the maximum adsorption capacities of the two kinds of nanosheets, which reached 253.5 mg g−1 and 259.5 mg g−1, which are 553 times and 3054 times larger than those for bulk Ln-TDA (Ln = La, Ce), respectively. Additionally, the kinetic data showed that the adsorption equilibrium time is fast, approximately 15 min by the pseudo-second-order model. In addition, the prepared products not only have a wide application range (pH = 3–9) but also offer eco-safety in terms of residuals (no Ln leak out). Based on the XPS spectra, FTIR spectra and DFT calculations, the main adsorption mechanisms included ligand exchange and electrostatic interactions. This new insight provides a novel strategy to prepare 2D MOF adsorbents, achieving a more eco-friendly method (microwave- and ultrasonic-assisted synthesis) for preparing 2D Ln-based MOF nanosheets by coordinative unsaturation to boost phosphate adsorption.
1. Introduction
Driven by the accumulation of phosphate (H2PO4−, HPO42−) in surface water, there has been increasingly eutrophic water around the world during the past decades. The problem has become a severe challenge for clean water supply, and even for the goals of sustainable development.1–3 Focusing on this, scientists are actively seeking any opportunity to remove phosphate and achieve improved water quality.4,5 Among the various existing methods, adsorption has been described classical textbooks as an effective method for phosphate removal. Metal–organic frameworks (MOFs) have become an emerging and attractive material to improve adsorption performance with the rapid development of material science.6In essence, the metal or metal clusters and organic ligands determine the kinds of user-configurable flexibility,7 and thereby, MOFs show rich variety in nanoscale materials.8,9 Previous literature has indicated that the inherent metal electronic structure, chemical characteristics and micromorphology of MOFs are the key factors relevant to the adsorption efficiency of phosphate, but there are only a few reports of integrated studies that focus on the above. On one hand, increasing the potential adsorption capacity and structural stability is normally solved by the method of micromorphology modification.10–12 Furthermore, additional effects tend to create new MOFs based on the user-configurable flexibility.13,14 Metal doping, ligand functionalization, and other strategies are used to increase the overall performance of MOFs.15,16 Additionality, it is well-known that most MOFs have the advantages of 3D materials, which include a good structure, exposed active sites and versatile pore sizes.17 However, it is also worth noting that 2D nanosheets have a larger surface area, greater points of coordination of unsaturated atoms and lower mass transfer resistance.18 On the other hand, the theoretical basis for the adsorption process is the interaction between metal sites and phosphate.19 In other words, a deeper understanding of the customizable functional groups with chemical affinity is required to contribute to advanced MOF development.20 Therefore, coordinated exploration of advanced 2D MOFs with characteristics including strong adsorption capacity, high water stability, and ease of commercial promotion and determination of the central mechanism of bonding between metal and phosphate are urgent missions for effective phosphate removal.
Studies and reviews focusing on the above issues have emerged. Moreover, to find more matched and suitable metal matrices and organic ligands, lanthanide-based MOFs have been increasingly studied as potential phosphate adsorbents. For instance, Liu et al. designed and prepared prismatic La-BDC, which used terephthalic (BDC) acid as the organic ligand and lanthanum as the metal source, and the product showed a maximum adsorption capacity of 142.04 mg g−1.21 Nevertheless, most existing lanthanide MOFs are based on conventional organic compounds as organic ligands, such as BDC, 1,3,5-BTC and porphyrin.22 However, the choice of organic ligands greatly affects the building of strong coordination bonds. In addition, compared to the reported Zn-, Cu-, Co-, and Ni-based 2D MOFs,23 previous studies have presented varying degrees of issues and challenges for rare-earth-based 2D MOFs in terms of both product and process. For example, although there have been studies that designed rare-earth-based 2D MOFs by the method of ‘top-down’ or ‘bottom-up’,24,25 the number is very small. The drawbacks mainly include the problems of time consumption,26 difficulty of controlling the morphology, structural damage on the nanosheets,27 low yield,28 difficulty of directly obtaining the product and fewer exposed active sites, which all limit the development of rare-earth-based 2D MOFs. Third, few studies have reported the influence of lanthanide electron structure and chemical characteristics on phosphate removal. Actually, the absorption ability mainly arises through bonding from empty molecular orbitals and outermost electrons.29
Stimulated by the above challenges and requirements, herein, the authors fabricated La-based Ln-TDA (Ln = La, Ce) nanosheets via a simple, rapid and direct synthetic method in a microwave synthetic extraction apparatus based on a ‘bottom-up’ roadmap (Scheme 1). During the process, 2,2′-thioacetic acid (H2TDA) is used as a new organic ligand in the preparation system. The authors then demonstrated that the two prepared 2D Ln-MOFs can be used as an efficient adsorbent for phosphate. The adsorption mechanism was studied via Fourier transform infrared spectroscopy (FTIR), X-ray photoelectron spectrometry (XPS) and density functional theory (DFT) calculations. In addition, more importantly, the prepared materials have been tested in a real eutrophic body. The above results not only indicated high removal performance but also showed greater potential for engineering applications.
2. Materials and methods
2.1 Materials
In this experiment, all chemicals and reagents were purchased from commercial sources. Additionally, they were all directly used in the experiment without further purification. Furthermore, lanthanum(III) nitrate hexahydrate (La(NO3)3·6H2O, Ce(NO3)3·6H2O) and potassium dihydrogen phosphate (KH2PO4) were purchased from Aladdin Chemical Reagent C., Ltd. (Shanghai). 2,2′-Thiodiacetic acid (H2TDA) was purchased from Tian Scientific C., Ltd. (Shanghai). Sodium hydroxide (NaOH) and hydrochloric acid (HCl) were purchased from Chengdu Kelong Chemical Reagent C., Ltd. (Chengdu). The above solutions were prepared by deionized water (resistivity > 18.25 MΩ). In addition, a sample of actual eutrophic sewage was collected from Jinning, Yunnan, China, and used in the adsorption study.2.2 Preparation of 2D Ln-TDA (Ln = La, Ce)
To synthesize 2D Ln-TDA nanosheets, Ln3+ and an organic ligand (H2TDA) were synthesized through a coordination reaction under microwave and ultrasonic heating. Furthermore, 0.36 g (2.4 mmol) 2,2′-thioacetic acid (H2TDA) was first dissolved into 60 ml (75 mM) NaOH solution. During the process, ultrasonication was employed (5 min) to accelerate dissolution. After that, 0.51 g (1.2 mmol) La(NO3)3·6H2O was added to the previous solution. To obtain a uniform solution, ultrasonication was also carried out. After ultrasonication, the mixture solution was placed into a 100 ml four-neck round bottom flask. In the multifunctional microwave synthetic extraction instrument (UWave-200C, maximum power: 400 W), the round-bottomed flask was then heated from room temperature to 90 °C at a rate of 9 °C min−1. Using an ultrasonic vibration instrument (200 kHz ultrasonic), the mixture was stirred until the heating was finished (approximately 20 min). Afterwards, the obtained mixed product suspension was transferred to a beaker, cooled to ambient temperature, and allowed to stand overnight. Finally, the precipitated white solid product was washed three times with deionized water and then dried under vacuum at 60 °C for 12 hours.Using the same roadmap as for the 2D Ln-TDA nanosheets, Ce(NO3)3·6H2O (1.2 mmol, 0.52 g), was used to produce 2D Ce-TDA nanosheets. The microwave heating temperatures were 50 °C, 70 °C, and 90 °C with reaction times of 5, 10, and 15 min, respectively. Finally, it needs to be explicitly specified that the material prepared under the condition of 90 °C for 10 min showed better performance (Fig. 1). Therefore, this optimal material was used as the adsorbent for the phosphate adsorption experiment.
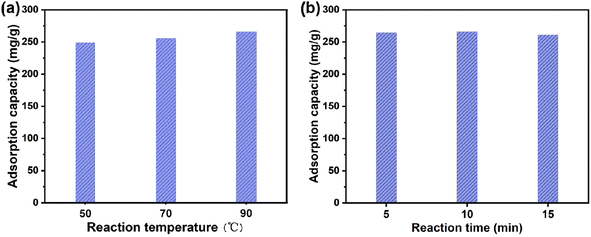 | ||
| Fig. 1 Effects of the microwave reaction temperature (a) and microwave heating time (b) of the 2D La-TDA nanosheets on the adsorption of phosphate. | ||
2.3 Synthesis of bulk Ln-TDA (Ln = La, Ce)
The product Ln-TDA was synthesized according to the previous literature with a minor modification.30 Briefly, La(NO3)3·6H2O (0.43 g, 1.0 mmol), 2,2′-thioacetic acid (H2TDA) (0.22 g, 1.5 mmol), and KOH (0.14 g, 2.5 mmol) were dissolved in 20 ml deionized water by ultrasonication. Subsequently, the mixture solution was transferred to a prepared Teflon-lined stainless-steel vessel (volume: 50 ml), and the reaction conditions were kept at 140 °C for 24 h. Then, the obtained products were placed at room temperature for cooling. Finally, the white bulk product was washed three times with deionized water and dried in an oven at 60 °C for 12 hours. At this point, bulk Ln-TDA was produced. Similarly, Ce(NO3)3·6H2O (1.0 mmol, 0.43 g) replaced La(NO3)3·6H2O for the preparation of bulk Ce-TDA.2.4 Adsorption experiments
Based on previous preparation, the authors obtained four 2D Ln-TDA nanosheets under different conditions. Herein, the preferred adsorbent was identified at the beginning. After that, the best adsorbent was used for the adsorption experiment. Test conditions included dosage, pH, leaching, coexisting ions, and real wastewater samples.In this work, four 2D La-TDA samples were obtained using different microwave temperatures and reaction times. To identify the preferred adsorbent, all products were used for the experiment, which means that 0.25 g L−1 of La-TDA was added to the P solution (30.0 mg L−1) for testing.
After the process of identifying the preferred adsorbent, the adsorption kinetics experiments were as follows: a given dosage of 0.1 g L−1 2D Ln-TDA (Ln = La, Ce) nanosheets was added to 10.0 mg L−1, 20.0 mg L−1 and 30.0 mg L−1 P solutions, respectively. During testing, all samples were tested at 25 °C with shaking at 200 rpm. Each sample was drawn to measure the P concentration at a specific time intervals in the range of 0 to 60 min. For the adsorption isotherm, 0.1 g L−1 2D Ln-TDA (Ln = La, Ce) was added to different P solutions with concentrations ranging from 5.0 to 30.0 mg L−1. In addition, considering that the pH value and coexisting ions are the two main influences on absorption, the experiment evaluated the effects of both different pH values and coexisting ions. Furthermore, the solution with a P dosage of 30.0 mg L−1 was measured at pH values of 2.0, 3.0, 4.0, 5.0, 6.0, 7.0, 8.0, 9.0, 10.0 and 11.0 with adjustment by NaOH or HCl. 0.1 g L−1 2D Ln-TDA (Ln = La, Ce) was added. The supernatant was then extracted, and the amount of leached La/Ce was determined using inductively coupled plasma-optical emission spectrometry (ICP-OES). The commonly coexisting ions in fresh water CO32−, Cl−, SO42−, HCO3− and humic acid were chosen to test the influence of coexisting ions. Different concentrations of the coexisting ions (10.0 mg L−1, 30.0 mg L−1, or 50.0 mg L−1) were prepared, and then 0.1 g L−1 2D Ln-TDA (Ln = La, Ce) was added to the above solutions, which had a P dosage of 30.0 mg L−1. The samples were placed in a shaker for shaking and then filtered, and the P concentration in the water was analyzed using an ammonium molybdate spectrophotometer.
Finally, to evaluate the effect of the prepared adsorbent in actual sewage, 0.1 g L−1 2D Ln-TDA (Ln = La, Ce) was added to 100 ml of wastewater for the adsorption experiment.
2.5 Characterization and density functional theory calculations
Similarly to in most literature, conventional analytical and characterization techniques were used in this research, including Brunauer–Emmett–Teller (BET) analysis, powder X-ray diffraction (XRD), atomic force microscopy (AFM), scanning electron microscopy (SEM), transmission electron microscopy (TEM), FTIR, thermogravimetric analysis (TGA) and XPS. The types of equipment and their usage and function are presented in S1.† To verify the experimental data and further identify the adsorption mechanism, DFT calculations were performed using Materials Studio (MS).19,31 S1† describes the contributions and results.3. Results and discussion
3.1 Characterization of Ln-TDA (Ln = La, Ce)
To obtain the best 2D Ln-TDA (Ln = La, Ce) nanosheets, the optimal conditions, including microwave reaction temperature and reaction time, for phosphate removal should be first be identified. Furthermore, the authors first studied 2D Ln-TDA (Ln = La, Ce) produced under different conditions. As shown in Fig. 1, a microwave heating time of 10 min and temperature of 90 °C are the best preparation conditions for 2D Ln-TDA (Ln = La, Ce) nanosheets. The maximum adsorption capacity reached 266.15 mg g−1 under these conditions. In addition, and more importantly, the XRD and SEM results showed that these 2D La-TDA nanosheets have a better crystal structure and microstructure compared with those obtained under the other conditions (Fig. 2 and 3). Therefore, the optimal reaction temperature and reaction time for preparing 2D La-TDA nanosheets were determined to be 90 °C and 10 min, respectively. Based on this, the 2D Ce-TDA nanosheets in the following experiments were also prepared under the optimal conditions.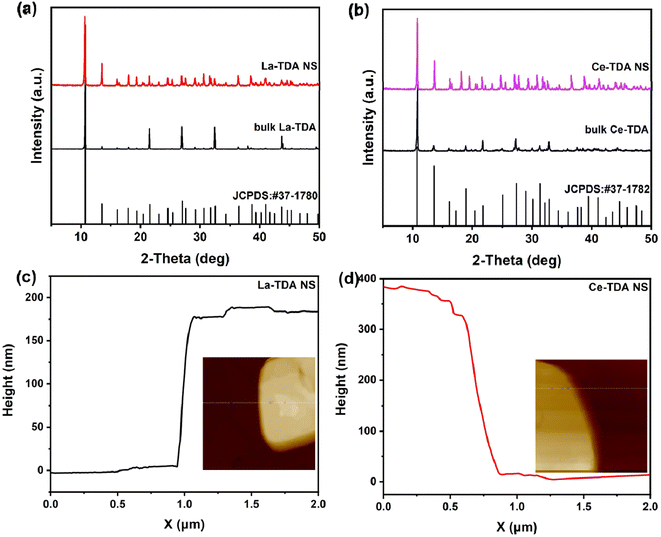 | ||
| Fig. 2 XRD patterns of bulk La-TDA and 2D La-TDA nanosheets, (b) XRD patterns of bulk Ce-TDA and 2D Ce-TDA nanosheets, and AFM images of (c) La-TDA nanosheets and (d) Ce-TDA nanosheets. | ||
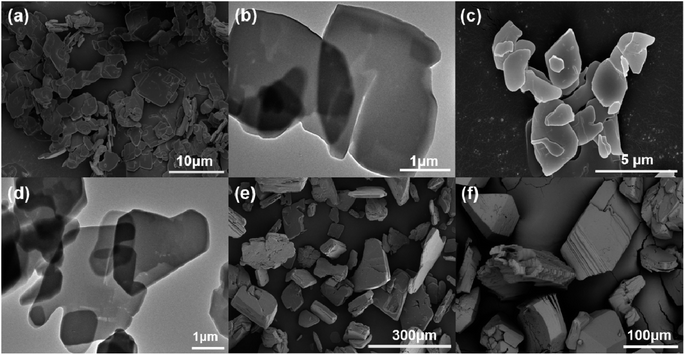 | ||
| Fig. 3 SEM images of (a) La-TDA nanosheets and (c) Ce-TDA nanosheets, TEM images of (b) La-TDA nanosheets and (d) Ce-TDA nanosheets, SEM images of (e) bulk La-TDA and (f) bulk Ce-TDA. | ||
Based on the optimization experiments, the crystal structure and morphology were determined using XRD (Fig. 2). Moreover, it can be observed that the prepared Ln-TDA (Ln = La, Ce) fits the standard card (Fig. 2, JCPDS: #37-1780 and #37-1782). This result for the prepared Ln-TDA (Ln = La, Ce) is consistent with those reported in the previous literature,30 which fully demonstrated that Ln-TDA (Ln = La, Ce) was successfully prepared by our designed method. Meanwhile, the prepared 2D Ln-TDA (Ln = La, Ce) nanosheets have more peak positions than bulk Ln-TDA (Ln = La, Ce), and the peaks gradually broaden and weaken as the thickness decreases, which is in accordance with previous reports.32
Here, one point worth emphasizing is the advance of the designed synthesis method. This can be observed visually in Fig. 3. The SEM images of the 2D La-TDA nanosheets and 2D Ce-TDA nanosheets are shown in Fig. 3a and c. The two images show that the prepared 2D Ln-TDA nanosheets have structures with a single layer or few layers, and the transverse sizes of the two materials reached the micron level (∼3 μm). Additionally, the AFM images of 2D La-TDA nanosheets and 2D Ce-TDA nanosheets are shown in Fig. 2c and d, and the thicknesses of the 2D La-TDA nanosheets and 2D Ce-TDA nanosheets are approximately 200 nm and 380 nm, respectively. To further examine these results, TEM was also employed in this research. As shown in Fig. 3b and d, TEM revealed that the materials are made up of a single structure with a single layer or few layers. Similarly, the lateral dimension reaches the micrometer level. Fig. 3e and f display the SEM images of bulk Ln-TDA (Ln = La, Ce) prepared using the solvothermal method. In contrast, their morphology exhibited a 3D bulk-like structure with multiple layers. However, when the further preparation of 2D Ln-TDA (Ln = La, Ce) nanosheets is needed, additional physical and chemical processes are needed to exfoliate the 3D bulk Ln-TDA during traditional hydrothermal processes. This means that the microwave- and ultrasonic-assisted methods quickly and directly obtained the designed 2D nanosheets, avoiding postprocessing of the bulk material. Additionally, considering that the traditional solvothermal method requires a longer reaction time and higher reaction temperature, the method explored in this research has advantages in terms of reaction temperature and time, and thereby, the method holds great promise in both energy conservation and industrial production.
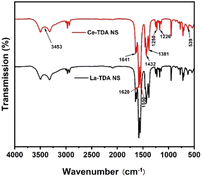
FTIR spectra were used to analyze the functional groups of the 2D Ln-TDA (Ln = La, Ce) nanosheets. Fig. 4 presents the features infrared spectra of the products between 500 and 4000 cm−1. In general, the FTIR spectra of the two materials are the same in the range of 500–4000 cm−1, and mainly involve carboxylic acid and hydroxyl functional groups. Taking the 2D La-TDA nanosheets as an example, they showed some characteristic peaks: the broad peaks at 3453.30 cm−1 are assigned to the OH stretching vibrations, the peaks at 2966.50 cm−1 correspond to the C–H vibration, and the peaks at 1641.33 cm−1 correspond to the C![[double bond, length as m-dash]](https://www.rsc.org/images/entities/char_e001.gif) O vibration;33 those at 1620.09–1550.71 cm−1 and 1432.29–1381.71 cm−1 are attributed to the stretching vibration absorption peaks of the νassy (–COO–) and νsym (–COO–) carboxylic acid groups;19,30,34 and the absorption peak at 1250.17–1226.56 cm−1 corresponds to the C–S oscillating vibration absorption peak. In other words, the above characteristic peaks also proved that the H2TDA organic ligands existed in the products. Additionally, the sharp peak at 539.93 cm−1 from the La–O bending vibration confirmed the combination of La3+ and the carboxylic acid group of the organic ligand. This result also indicated that La-TDA nanosheets were formed via the designed method.33 Similarly, the 2D Ce-TDA nanosheets have the same coordination modes as the 2D La-TDA nanosheets. Among them, the Ce–O bending vibration at 539.06 cm−1 indicated that the 2D Ce-TDA nanosheet was successfully synthesized.19,34
O vibration;33 those at 1620.09–1550.71 cm−1 and 1432.29–1381.71 cm−1 are attributed to the stretching vibration absorption peaks of the νassy (–COO–) and νsym (–COO–) carboxylic acid groups;19,30,34 and the absorption peak at 1250.17–1226.56 cm−1 corresponds to the C–S oscillating vibration absorption peak. In other words, the above characteristic peaks also proved that the H2TDA organic ligands existed in the products. Additionally, the sharp peak at 539.93 cm−1 from the La–O bending vibration confirmed the combination of La3+ and the carboxylic acid group of the organic ligand. This result also indicated that La-TDA nanosheets were formed via the designed method.33 Similarly, the 2D Ce-TDA nanosheets have the same coordination modes as the 2D La-TDA nanosheets. Among them, the Ce–O bending vibration at 539.06 cm−1 indicated that the 2D Ce-TDA nanosheet was successfully synthesized.19,34
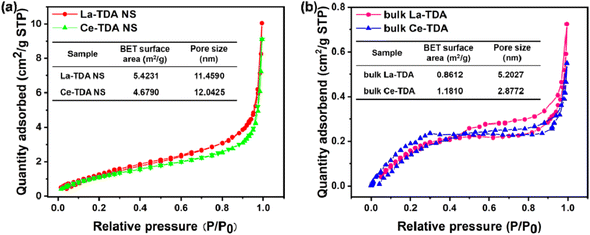
The N2 adsorption isotherms are shown in Fig. 5. Compared with those of the prepared bulk La-TDA (0.8612 m2 g−1) and bulk Ce-TDA (1.1810 m2 g−1), the BET surface areas of the 2D Ln-TDA (Ln = La, Ce) nanosheets increased significantly with their decreasing thickness to 5.4231 m2 g−1 and 4.6790 m2 g−1. The reason is mostly attributed to the 2D nanosheets exposing more internal surface area. In addition, the average pore diameters of the 2D Ln-TDA (Ln = La, Ce) nanosheets are 11.4590 nm and 12.0425 nm, respectively. Finally, Fig. 5 shows a Type II BET adsorption isotherm; at the same time, the mesoporous structure demonstrates that the products are typical multilevel porous adsorption materials.35
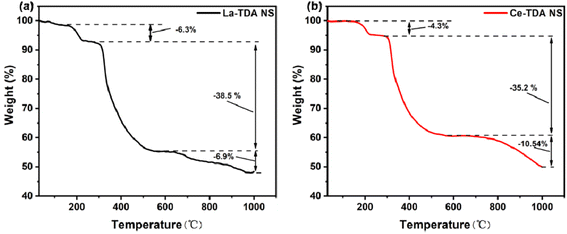
Finally, to further understand the phase transition process of the Ln-TDA (Ln = La, Ce) nanosheets in a N2 atmosphere, the thermal behavior of the materials under N2 conditions was studied using TG. Fig. 6 illustrates the weight reduction processes of the 2D Ln-TDA nanosheets. At the beginning, due to the loss of free water molecules and lattice coordination water molecules, the product exhibited the first weight loss. Subsequently, with increasing temperature, the decomposition of H2TDA caused the collapse of the crystal structure and resulted in the second weight loss. The third weight loss is from the loss of part of the carbide, and ultimately, the 2D La-TDA nanosheets and 2D Ce-TDA nanosheets lost 51.7% and 50.0% of their overall weight, respectively, and La2O3 and CeO2 were obtained.
3.2 Adsorption characterization of 2D Ln-TDA (Ln = La, Ce)
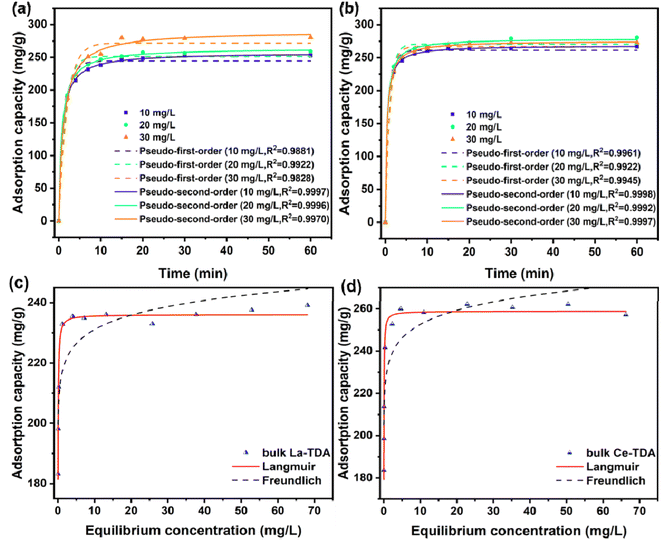
Furthermore, the experimental data were fitted with the pseudo-first-order kinetics model and pseudo-second-order kinetics model. Using the expressions for the Langmuir model and Freundlich model,21,35,36 the corresponding kinetic parameters and correlation coefficients are summarized in Table 1. The results showed that the two kinds of 2D Ln-TDA (Ln = La, Ce) nanosheets matched the pseudo-second-order kinetics model. Chemisorption is the main contributor during the processes. Additionally, the same result was observed for both bulk Ln-TDA (Ln = La, Ce) and the 2D Ln-TDA (Ln = La, Ce) nanosheets (Fig. 7). In addition, as shown in the results in Table 1, the authors were pleasantly surprised to discover that the prepared 2D La-TDA nanosheet and 2D Ce-TDA nanosheet have higher rate constants than the bulk La-TDA and bulk Ce-TDA in 30 mg L−1 phosphate solution, up to 553 times and 3054 times greater, respectively. Thus, we believe that the fast adsorption kinetics of the two nanosheets can be attributed to the abundance of surface OH groups exposing a large number of active adsorption sites; at the same time, the 2D structure greatly reduced the mass transfer resistance during the adsorption process, which together caused all the nanosheets to reach adsorption equilibrium in a short time; the adsorption kinetics curves exhibited the same trend. This point has also been proven in other similar studies.36
| Adsorbent | Concentration C0 (mg L−1) | |||
|---|---|---|---|---|
| qe (mg g−1) | k2 (g mg−1 min−1) | R2 | ||
| 2D La-TDA | 10 | 257.14 | 5.29 × 10⁻⁴ | 0.9997 |
| 20 | 264.14 | 5.12 × 10⁻³ | 0.9996 | |
| 30 | 290.31 | 3.09 × 10⁻³ | 0.9970 | |
| 2D Ce-TDA | 10 | 268.49 | 0.01054 | 0.9998 |
| 20 | 279.29 | 9.12 × 10⁻³ | 0.9992 | |
| 30 | 275.51 | 9.07 × 10⁻³ | 0.9997 | |
| Bulk La-TDA | 30 | 370.50 | 5.59 × 10⁻⁶ | 0.9898 |
| Bulk Ce-TDA | 413.93 | 2.97 × 10⁻⁶ | 0.9809 | |
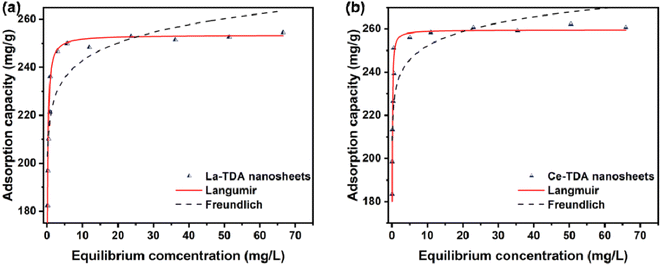 | ||
| Fig. 8 Adsorption isotherms of phosphate to (a) 2D La-TDA and (b) 2D Ce-TDA nanosheets. Experimental conditions: C0 = 6.0–30.0 mg L−1, dosage = 0.1 g L−1, T = 25 °C. | ||
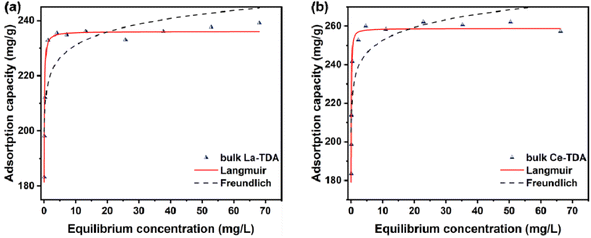
In addition, the Langmuir model and Freundlich model were employed to test the experimental data. Table 2 illustrates that the experimental data can be fitted with the Langmuir model. As shown, the correlation coefficients (R2) of the Langmuir model for 2D Ln-TDA (Ln = La, Ce) nanosheets are 0.9527 and 0.9547. Additionally, the bulk Ln-TDA (Ln = La, Ce) prepared by the microwave ultrasonic method can also be fitted with the Langmuir model. These results indicated that monolayer and uniform adsorption occurred on the homogenous adsorbents.37
| Adsorbent | Langmuir | Freundlich | ||||
|---|---|---|---|---|---|---|
| qm (mg g−1) | KL (L mg−1) | R2 | KF (mg g−1) | n | R2 | |
| La-TDA NS | 253.5 | 13.9772 | 0.9527 | 219.73 | 23.1129 | 0.7661 |
| Ce-TDA NS bulk La-TDA | 259.5 | 37.1742 | 0.9547 | 231.29 | 26.6642 | 0.7451 |
| Bulk Ce-TDA | 236.06 | 46.7736 | 0.9809 | 215.92 | 33.8699 | 0.7501 |
| 258.90 | 56.2124 | 0.9816 | 231.65 | 26.5492 | 0.7794 | |
Finally, the Langmuir model is used to estimate the maximum adsorption capacity of phosphate (qm). As shown in Fig. 8, the maximum adsorption capacities of the La-TDA nanosheets and Ce-TDA nanosheets are approximately 253.5 mg g−1 and 259.5 mg g−1, respectively. Comparison with Fig. 9 shows that they have a similar adsorption capacity to the bulk Ln-TDA (Ln = La, Ce) prepared using the solvothermal method.
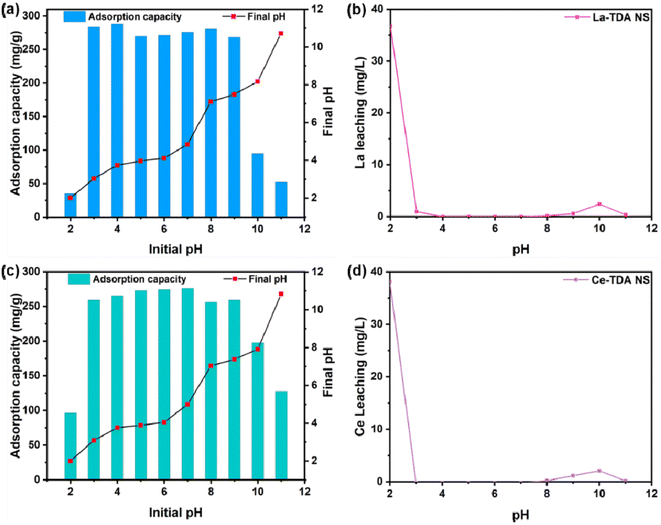
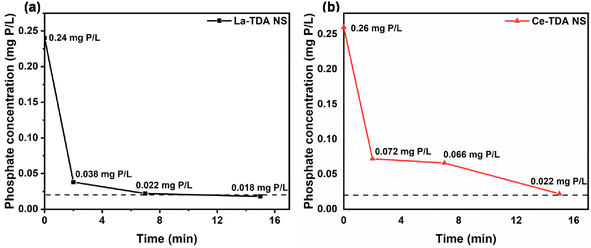
In addition, to determine the reasons for the poorer adsorption capacity at pH < 3.0 and pH > 9.0, the concentrations of the La/Ce metal ions were determined after adsorption (Fig. 8b and d). There was no leakage of La/Ce metal ions in the solution at pH = 3.0–8.0. Conversely, at pH < 3.0 or > 9.0, leakage of La/Ce metal ions occurred. However, the two kinds of 2D Ln TDA (Ln = La, Ce) nanosheets still had a good removal capacity for phosphate, because the leakage was less than 1.0 mg L−1. Therefore, the poorer adsorption capacity (pH < 3.0 or >9.0) is caused by the physical structure being destroyed during preparation.
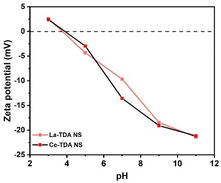
Finally, the authors also observed an obvious reduction in the final pH value in the sample at pH values of 3.0–12.0 (Fig. 10a and c). Regarding this situation, it is generally believed that the processes involve hydrolysis reactions during Ln ligand exchange. To prove this, the zeta potentials of 2D Ln-TDA (Ln = La, Ce) before adsorption are presented in Fig. 11. Initially, it is shown that these two materials have similar zeta potential trends. Subsequently, the points of zero charge (pHpzc) are approximately 3.85 before adsorption. Based on this, the La/Ce on the material surface will be protonated to LaOH+/CeOH+ when the initial solution pH value is lower than pHpzc. With increasing protonation, the pH value increased. LaOH+/CeOH+ adsorbs phosphate via electrostatic interactions.38 Then, with the increase in pH (pH > pHpzc), the process of protonation was replaced by deprotonation, which finally led to the gradual change of the positive charge on the material surface to a negative charge, resulting in a negative effect for adsorption. That is, the 2D Ln-TDA (Ln = La, Ce) nanosheets adsorb phosphate through ligand exchange of surface functional group at this moment, and the pH of the final solution decreased.36,39
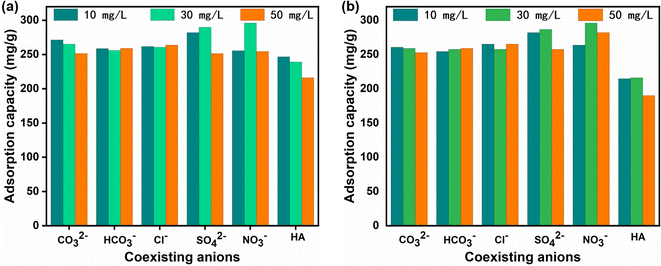
Additionally, there is a competitive effect between organic humic acid and phosphate. Fig. 12 clearly shows that the adsorption capacity of phosphate also decreased with increasing humic acid concentration. In particular, the 2D Ce-TDA nanosheets showed a greater drop. The reason may be that humic acid can interact with the –OH of the prepared materials through hydrogen bonds, and the final output is Ln–HA complexes. However, La/Ce has a higher affinity for phosphate than coexisting organic humic acid, and thereby, the adsorption performances are satisfactory compared with other studies.42,43 Therefore, the designed 2D Ln-TDA (Ln = La, Ce) nanosheet material can have broad application prospects in the practical treatment of water.
3.3 Adsorption mechanism
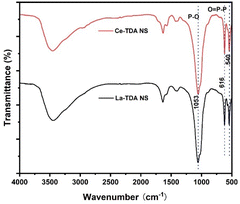
The dosage mechanism of the designed 2D Ln-TDA (Ln = La, Ce) nanosheets includes ligand exchange and electrostatic interactions, particularly ligand exchange (Fig. 14). In this work, the phosphate adsorption mechanism of the prepared 2D Ln-TDA (Ln = La, Ce) nanosheets was studied through FTIR, XPS and DFT calculations. The details are as follows:Fig. 14 presents the FTIR spectra of the Ln-TDA (Ln = La, Ce) nanosheets after the adsorption of phosphate. The features include the peak at 1078 cm−1 corresponding to the stretching vibration of C–O disappearing after the adsorption of phosphate. Additionally, a P–O stretching vibration peak appeared at 1053 cm−1 after phosphate adsorption. In addition, an O![[double bond, length as m-dash]](https://www.rsc.org/images/entities/char_e001.gif) P–P bond vibration absorption peak appeared at 616 cm−1. The above peaks proved that phosphate was successfully adsorbed on the 2D Ln-TDA (Ln = La, Ce) nanosheets through a chemical reaction.44–46 Combined with the results in Section 3, ligand exchange between hydroxyl and phosphate is the main contributor to this result. Finally, a peak was observed at 540 cm−1 (La/Ce–O). This result indicated that the structure of the designed nanosheets, which had a tight structure, was not changed after phosphate adsorption.19,34,35,41
P–P bond vibration absorption peak appeared at 616 cm−1. The above peaks proved that phosphate was successfully adsorbed on the 2D Ln-TDA (Ln = La, Ce) nanosheets through a chemical reaction.44–46 Combined with the results in Section 3, ligand exchange between hydroxyl and phosphate is the main contributor to this result. Finally, a peak was observed at 540 cm−1 (La/Ce–O). This result indicated that the structure of the designed nanosheets, which had a tight structure, was not changed after phosphate adsorption.19,34,35,41
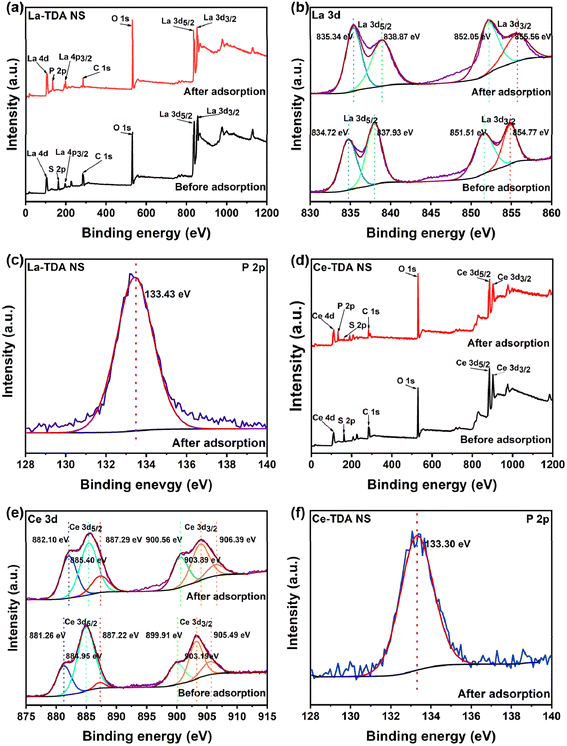
The prepared materials can selectively capture phosphate in bodies of water. Moreover, Fig. 15 shows the changes in the XPS spectra before and after phosphate adsorption. The wide scan XPS showed the presence of the elements La, O, S and C (Fig. 15a). A characteristic P 2p peak was observed at 133.43 eV after phosphate adsorption (Fig. 15c). This result is entirely consistent with prior studies.35,41,44 Additionally, the binding energies of the La 3d5/2 peaks were 834.72 eV and 837.93 eV before phosphate was adsorbed on the 2D products, which corresponded to the binding energies of the La 3d3/2 peaks (851.51 eV and 854.77 eV). After phosphate adsorption, the binding energies of La 3d5/2 and La 3d3/2 increased slightly to 835.34 eV, 838.87 eV, 852.05 eV, and 855.56 eV, respectively (Fig. 15b), which indicated that the chemical bonds around the La atom changed.33,44,47 In other words, electron transfer occurred in the La 3d valence band, which formed a La–O–P inner sphere complex during the adsorption process.48
In contrast, Fig. 15d shows that the elements Ce, O, S and C were detected in the wide XPS scan. Similarly, the P 2p peak reached 133.30 eV after phosphate adsorption (Fig. 15f). The results matched those in the literature.19,34,36 Additionally, the characteristics shown in Fig. 15e include three pairs of spin–orbit double peaks for Ce 3d; the binding energies of the Ce 3d5/2 peaks were 881.26 eV, 884.05 eV, and 887.22 eV, and the binding energies of the Ce 3d3/2 peaks were 889.91 eV, 903.19 eV and 905.49 eV. Among them, the peak at 884.05 eV/903.19 eV can be attributed to Ce(III); at the same time, the two groups of peaks at 881.26 eV/889.91 eV and 887.22 eV/905.49 eV can be attributed to Ce(IV). The above results showed that Ce 3d has two mixed chemical states (Ce(III)/Ce(IV)) in the designed 2D Ce-TDA. The binding energies of Ce 3d5/2 and Ce 3d3/2 also presented an increasing trend after phosphate adsorption, which is consistent with previous studies.19,34 Finally, the changes from Ce 3d contribute to the resulting Ce–O–P inner sphere complex.48
XPS further indicated that more active sites were exposed in the prepared 2D Ln-TDA nanosheets. Regardless of whether 2D La-TDA nanosheets or 2D Ce-TDA nanosheets were used, their dominant binding energy peaks moved to lower positions compared with previous research.19 This is following the principal theory about the decrease in coordination number in proportion to the amount of binding energy.49 Therefore, the prepared 2D Ln-TDA demonstrated a remarkable removal efficiency of phosphate based on its greater exposure of active sites. The main mechanism is ligand exchange, which depends on the coordination unsaturation number of the prepared 2D Ln-TDA nanosheets.
Fig. 16 illustrates the schematic diagram based on DFT calculations. This result lends support to the FTIR and XPS results, indicating that the adsorption mechanism is ligand exchange and electrostatic interaction (S1†). First, the orbital populations demonstrated that the charges of the 2D La-TDA nanosheet and 2D Ce-TDA nanosheet increased from 188 e and 190 e to 218 e and 220 e, respectively. This further indicated that phosphate was adsorbed in the 2D Ln-TDA nanosheets. Additionally, the atomic populations (Mulliken) displayed two species of La and Ce in units of 2D Ln-TDA nanosheets, whose charge (e) performance before and after adsorption ranged from 1.90 to 1.98 (La 1), 1.92 to 2.03 (La 2), 1.67 to 1.68 (Ce 1) and 1.67 to 1.84 (Ce 2). Moreover, the La 3d charge growth led to the formation of outer-orbital-type coordination compounds, while Ce 3d decreased the 0.6 e to the 2p atomic orbital and finally formed an inner-orbital coordination compound. Additionally, the total and partial density of states showed that Ln 3d was the main contributor to the growth of the energy (eV) and peak integration areas. Furthermore, oxygen vacancies are normally considered to be the key indicator of the degree of lattice defects, and thereby, the higher valent metal can tend to have a lower valence.50,51 This explained why Ce3+ and Ce5+ coexisted in the 2D Ce-TDA nanosheet. Thus, the adsorption process can be attributed to the activated oxygen ions with a lower coordination situation, which contributed to more unsaturated sites in the system. Finally, three new Ln–O (Ln = La, Ce) covalent bonds (one Ln–H replaced by Ln–O, with the remaining two Ln–O being newly formed) appeared after adsorption, which further proved ligand exchange during the dosage process. That is, positively charged Ln (Ln = La, Ce) ions and negatively charged phosphate tend to interact through electrostatic interactions, and ligand exchange occurs between hydroxyl and phosphate during protonation.
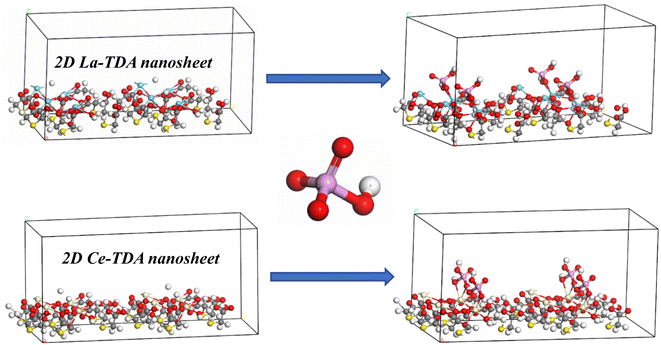 | ||
| Fig. 16 Schematic diagram of phosphate adsorption by 2D Ln-TDA (Ln = La, Ce) nanosheets: ligand exchange and electrostatic interaction. | ||
Based on the above, the prepared 2D Ln-TDA nanosheets have more unsaturated sites, and the main mechanism was eventually ascribed to ligand exchange and electrostatic interactions in this study. The products clearly showed a strong capacity for phosphate capture.
4. Conclusions
With the introduction of a more effective and cleaner method and a new organic ligand into the 2D Ln-MOF (Ln = La, Ce) research system, two novel 2D Ln-TDA (Ln = La, Ce) nanosheets have been successfully designed, prepared and applied as high-capacity adsorbents for phosphate removal. Moreover, on the premise of the 2D structure, H2TDA was creatively discovered as a new organic ligand that achieved growth in terms of the coordinative unsaturation degree in the designed 2D La-based MOF nanosheets via microwave- and ultrasonic-assisted synthesis. Based on this, the ultrathin 2D MOF nanosheets exhibit greater performance as superior adsorbents for wastewater purification. Compared with previous reports, the advantages of the nanosheets include exposing more metal sites (abundance of surface OH functional groups), greatly reducing the mass transfer resistance, rapid equilibrium time (15 min), wide pH range (pH = 3–9, no leakage of metal ions), and higher adsorption capacity (253.5 mg g−1 and 259.5 mg g−1). From the FTIR, XPS, and DFT measurements, the authors also confirmed that ligand exchange and electrostatic interactions are the core mechanism of phosphate capture. In addition, the present work provides a new synthesis method for 2D MOF materials, which not only exhibits engineering application potential but also offers a cleaner production model for MOF development. In summary, in addition to enhancing the adsorption performance in 2D MOF nanomaterials, this work greatly promotes the coordinated study of strong adsorption capacity with easy commercial promotion and central mechanism research (including bonds). This new insight provides a novel strategy to prepare 2D MOF adsorbents to achieve effective phosphate removal.Conflicts of interest
There are no conflicts to declare.Acknowledgements
This work was funded by the National Natural Science Foundation of China (No. 22065036). The authors also thank the Research Center of Lake Restoration Technology Engineering for Universities of Yunnan Province (Yunjiaofa [2019]-57), Workstation of Academician Chen Jing of Yunnan Province (No. 202105AF150012), Science and Technology Department of Yunnan Province (No. 202105AC160055) and Xindian Talent Plan for financial support.References
- N. Wei, X. Zheng, Q. Li, C. Gong, H. Ou and Z. Li, J. Colloid Interface Sci., 2020, 565, 337–344 CrossRef CAS PubMed.
- C. Huang, H. Zhang, K. Zheng, Z. Zhang, Q. Jiang and J. Li, Sci. Total Environ., 2021, 785, 147382 CrossRef CAS.
- C. Lu, W. Ji, M. Hou, T. Ma and J. Mao, Agric. Water Manag., 2022, 266, 107605 CrossRef.
- D. Huang, G. Wang, M. Cheng, G. Zhang, S. Chen, Y. Liu, Z. Li, W. Xue, L. Lei and R. Xiao, Chem. Eng. J., 2020, 421, 127817 CrossRef.
- M. Liu, S. Li, N. Tang, Y. Wang, X. Yang and S. Wang, J. Cleaner Prod., 2020, 265, 121782 CrossRef CAS.
- Z. Yan, S. Zheng, H. Xue and H. Pang, Adv. Funct. Mater., 2018, 28, 1804950 CrossRef.
- D. Zacher, O. Shekhah, C. Wöll and R. A. Fischer, Chem. Soc. Rev., 2009, 38, 1418 RSC.
- P. Kumar, A. Pournara, K. Kim, V. Bansal, S. Rapti and M. Manos, Prog. Mater. Sci., 2017, 86, 25–74 CrossRef CAS.
- Q. Xie, Y. Li, Z. Lv, H. Zhou, X. Yang, J. Chen and H. Guo, Sci. Rep., 2017, 7, 3316 CrossRef PubMed.
- Q. Mu, W. Zhu, X. Li, C. Zhang, Y. Su, Y. Lian, P. Qi, Z. Deng, D. Zhang, S. Wang, X. Zhu and Y. Peng, Appl. Catal., B, 2020, 262, 118144 CrossRef CAS.
- Y. Bai, Y. Dou, L. Xie, W. Rutledge, J. Li and H. Zhou, Chem. Soc. Rev., 2016, 45, 2327–2367 RSC.
- Q. Yang, J. Wang, W. Zhang, F. Liu, X. Yue, Y. Liu, M. Yang, Z. Li and J. Wang, Chem. Eng. J., 2017, 313, 19–26 CrossRef CAS.
- R. Liu, L. Chi, X. Wang, Y. Wang and Y. Sui, Chem. Eng. J., 2019, 357, 159–168 CrossRef CAS.
- H. Ramezanalizadeh and F. Manteghi, J. Cleaner Prod., 2018, 172, 2655–2666 CrossRef CAS.
- Y. G. Ko, T. Do, Y. Chun, C. H. Kim, U. S. Choi and J. Y. Kim, J. Hazard. Mater., 2016, 307, 91–98 CrossRef CAS PubMed.
- S. Li, X. Huang, J. Liu, L. Lu and R. Bhattarai, J. Hazard. Mater., 2019, 384, 121457 CrossRef.
- Z. Hasan and S. H. Jhung, ACS Appl. Mater. Interfaces, 2015, 7, 10429–10435 CrossRef CAS.
- G. Arroyos and R. Frem, CrystEngComm, 2020, 22, 2439–2446 RSC.
- J. He, Y. Xu, P. Shao, L. Yang, Y. Sun, Y. Yang, F. Cui and W. Wang, Chem. Eng. J., 2020, 394, 124912 CrossRef CAS.
- M. Hassan, R. Stanton, J. Secora, D. Trivedi and S. Andreescu, ACS Appl. Mater. Interfaces, 2020, 12, 52788–52796 CrossRef CAS PubMed.
- H. Liu, W. Guo, Z. Liu, X. Li and R. Wang, RSC Adv., 2016, 6, 105282–105287 RSC.
- Z. Jiang, Y. Zou, T. Zhao, J. Shu, Y. Li and C. Huang, Angew. Chem., Int. Ed., 2019, 132, 3326–3332 CrossRef.
- F. F. Wang, L. Fan, Z. Liu and Z. L. Cheng, Mater. Lett., 2019, 257, 126757 CrossRef CAS.
- L. Li, J. Yi, Z. Fang, X. Wang and R. Cao, Chem. Mater., 2019, 31, 7584–7589 CrossRef CAS.
- J. Duan, Y. Li, Y. Pan, N. Behera and W. Jin, Coord. Chem. Rev., 2019, 395, 25–45 CrossRef CAS.
- F. Li, P. Wang, X. Huang, D. Young and H. Wang, Angew. Chem., 2019, 131, 7125–7130 CrossRef.
- R. Natour, Z. Ali, A. Assoud and M. Hmadeh, Inorg. Chem., 2019, 58, 10912–10919 CrossRef CAS PubMed.
- P. Li, Y. Maeda and X. Qiang, Chem. Commun., 2011, 47, 8436–8438 RSC.
- B. Wu, J. Wan, Y. Zhang, B. Pan and I. M. C. Lo, Environ. Sci. Technol., 2020, 54, 50–66 CrossRef CAS.
- H. Wang, J. Li, J. Li, K. Wang, Y. Ding and X. Xia, NPG Asia Mater., 2017, 9, 1–9 Search PubMed.
- L. Fang, Q. Shi, J. Nguyen, B. Wu, Z. Wang and I. M. C. Lo, Environ. Sci. Technol., 2017, 51, 12377–12384 CrossRef CAS PubMed.
- Z. Jiang, Y. Zou, T. Zhao, S. Zhen, Y. Li and C. Huang, Angew. Chem., Int. Ed., 2020, 59, 3300–3306 CrossRef CAS.
- S. M. Prabhu, S. Imamura and K. Sasaki, ACS Sustainable Chem. Eng., 2019, 7, 6917–6928 CrossRef CAS.
- J. He, Y. Xu, W. Wang, B. Hu, Z. Wang, X. Yang, Y. Wang and L. Yang, Chem. Eng. J., 2020, 379, 122431 CrossRef CAS.
- K. Koh, S. Zhang and J. Paul Chen, Chem. Eng. J., 2020, 380, 122153 CrossRef CAS.
- B. Wu and I. M. C. Lo, Environ. Sci. Technol., 2020, 54, 4601–4608 CrossRef CAS.
- X. Liu, F. Shen, R. L. Smith Jr and X. Qi, Bioresour. Technol., 2019, 294, 122198 CrossRef CAS.
- J. Li, B. Li, H. Huang, X. Lv, N. Zhao, G. Guo and D. Zhang, Sci. Total Environ., 2019, 687, 460–469 CrossRef CAS PubMed.
- W. Huang, X. Yu, J. Tang, Y. Zhu, Y. Zhang and D. Li, Microporous Mesoporous Mater., 2015, 217, 225–232 CrossRef CAS.
- L. Kong, Y. Tian, Z. Pang, X. Huang, M. Li, N. Li, J. Zhang, W. Zuo and J. Li, Chem. Eng. J., 2020, 382, 122963 CrossRef CAS.
- B. Liu, J. Nan, X. Zu, X. Zhang, W. Huang and W. Wang, Chemosphere, 2020, 255, 127010 CrossRef CAS.
- X. Li, J. Chen, Z. Zhang, Y. Kuang, R. Yang and D. Wu, Water Res., 2020, 181, 115941 CrossRef CAS PubMed.
- X. Li, Y. Kuang, J. Chen and D. Wu, J. Colloid Interface Sci., 2020, 574, 197–206 CrossRef CAS PubMed.
- P. Koilraj and K. Sasaki, Chem. Eng. J., 2017, 317, 1059–1068 CrossRef CAS.
- X. Zhang, W. Wang, S. Dai and F. Cui, RSC Adv., 2018, 8, 11754–11763 RSC.
- Z. Wang, D. Shen, F. Shen and T. Li, Chemosphere, 2016, 150, 1–7 CrossRef CAS PubMed.
- X. Xu, Y. Cheng, X. Wu, P. Fan and R. Song, Appl. Clay Sci., 2020, 190, 105547 CrossRef CAS.
- B. Wu, J. Wan, Y. Zhang, B. Pan and I. M. C. Lo, Environ. Sci. Technol., 2020, 54, 50–66 CrossRef CAS PubMed.
- X. Min, X. Wu, P. Shao, Z. Ren, L. Ding and X. Luo, Chem. Eng. J., 2019, 358, 321–330 CrossRef CAS.
- P. Shao, L. Ding, J. Luo, Y. Luo, D. You, Q. Zhang and X. Luo, ACS Appl. Mater. Interfaces, 2019, 11, 29736–29745 CrossRef CAS.
- Y. Zhao, C. Chang, F. Teng, Y. Zhao, G. Chen, R. Shi, G. I. N. Waterhouse, W. Huang and T. Zhang, Adv. Energy Mater., 2017, 7, 1700005 CrossRef.
Footnote |
| † Electronic supplementary information (ESI) available. See DOI: https://doi.org/10.1039/d2ra05506f |
| This journal is © The Royal Society of Chemistry 2022 |


