 Open Access Article
Creative Commons Attribution 3.0 Unported Licence
Mixed chloridometallate(II) ionic liquids with tunable color and optical response for potential ammonia sensors†
Karsten Behrensa,
Christian Balischewskia,
Eric Sperlich a,
Antonia Menski
 a,
Ruth Fabiola Balderas-Valadeza,
Claudia Pacholski
 a,
Christina Günterb,
Susanne Lubahna,
Alexandra Kellinga and
Andreas Taubert
 *a
*a
aInstitute of Chemistry, University of Potsdam, Karl-Liebknecht-Strasse 24-25, D-14476 Potsdam, Germany. E-mail: ataubert@uni-potsdam.de
bInstitute of Geosciences, University of Potsdam, Karl-Liebknecht-Strasse 24-25, D-14476 Potsdam, Germany
First published on 8th December 2022
Abstract
Eight d-metal-containing N-butylpyridinium ionic liquids (ILs) with the nominal composition (C4Py)2[Ni0.5M0.5Cl4] or (C4Py)2[Zn0.5M0.5Cl4] (M = Cu, Co, Mn, Ni, Zn; C4Py = N-butylpyridinium) were synthesized, characterized, and investigated for their optical properties. Single crystal and powder X-ray analysis shows that the compounds are isostructural to existing examples based on other d-metal ions. Inductively coupled plasma optical emission spectroscopy measurements confirm that the metal/metal ratio is around 50![[thin space (1/6-em)]](https://www.rsc.org/images/entities/char_2009.gif) :
:![[thin space (1/6-em)]](https://www.rsc.org/images/entities/char_2009.gif) 50. UV-Vis spectroscopy shows that the optical absorption can be tuned by selection of the constituent metals. Moreover, the compounds can act as an optical sensor for the detection of gases such as ammonia as demonstrated via a simple prototype setup.
50. UV-Vis spectroscopy shows that the optical absorption can be tuned by selection of the constituent metals. Moreover, the compounds can act as an optical sensor for the detection of gases such as ammonia as demonstrated via a simple prototype setup.
Introduction
Ionic Liquids (ILs) have technologically relevant properties and have been explored for their use as solvents,1–3 in catalysis,4 separation,5 photoluminescence,6 drug delivery,7 and electrochemistry.8–10 One of the main features of ILs is the fact that their properties can be adjusted by carefully selecting the constituting anions and cations.11 Consequently, ILs can be tuned for their melting points, thermal and chemical stability, volatility, (non-)flammability, ionic conductivity, or electrochemical stability windows.12–16Metal containing ILs (MILs) built around the MX42− anion (M = Fe, Co, Ni, Cu, Zn, Al, In, Au, …; X = Cl, Br, I, SCN, …) have shown an especially widespread diversity of properties. This is due to the fact that the simple exchange of a metal ion for another one leads to significant changes in the optical, electronic, magnetic, electrochemical, or catalytic properties.17–19 Moreover, also the exchange of the X− anion directly affects the properties of the resulting IL.20–23
One of the striking features of these tetrahalidometallate compounds (both their complexes and their ILs) is their intense color and color change upon exchange of a cation or ligand in the MX42− unit. MX42− based compounds also show a strong solvato- or vapochromism,24,25 suggesting applications in gas or solvent sensing. Moreover, the reaction of gases like ammonia with MX42− can be exploited for both sensing and gas separation.26,27
Extending this concept, ILs combining two or more metals in one IL may be of interest for optical sensing because the combination of different metals provides access to different optical windows. This can lead to improved sensitivities or selectivities for different solvent or gas molecules in the detection process. Indeed, Balischewski et al. have recently shown that the combination of two or three metal ions in MX42−-based ILs leads to ILs with a range of colors from blue to green to yellow and orange, although no tests on their sensing capabilities have been made so far.23,28
The current article extends the previous work in two directions: (1) it expands the pool of mixed d-metal-based ILs to new bimetallic ILs built around Ni(II) and Zn(II) and (2) the article also demonstrates that the compounds can be used as the active component in an optical setup for the detection of ammonia gas using a fiber optic probe and a simple IL-coated glass slide.
Results
The ILs bis-N-butylpyridinium tetrachlorido nickelate(II), (C4Py)2[NiCl4] and bis-N-butylpyridinium tetrachlorido zincate(II), (C4Py)2[ZnCl4] were synthesized according to published protocols.22,29 The new mixed d-metal-based ILs with a nominal composition (C4Py)2[Ni0.5M0.5Cl4] and (C4Py)2[Zn0.5M0.5Cl4] (M = Cu, Co, Mn, Ni, Zn) were synthesized by employing appropriate mixtures of the respective metal chlorides using the same protocol. These compounds exhibit a range of colors depending on their composition, Fig. 1.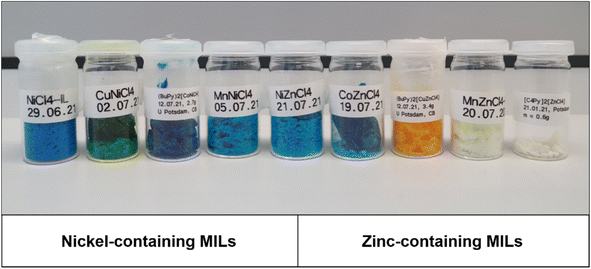 | ||
| Fig. 1 Ni- and Zn-based mixed metal ILs. Nominal composition is always (C4Py)2[Ni0.5M0.5Cl4] or (C4Py)2[Zn0.5M0.5Cl4]. For precise metal contents see Table 1 below. | ||
Table 1 summarizes the ILs investigated in this study. Inductively coupled plasma optical emission spectroscopy (ICP OES) shows that the metal contents and metal![[thin space (1/6-em)]](https://www.rsc.org/images/entities/char_2009.gif) :
:![[thin space (1/6-em)]](https://www.rsc.org/images/entities/char_2009.gif) metal ratios are in good agreement with the synthetic protocol. A 50
metal ratios are in good agreement with the synthetic protocol. A 50![[thin space (1/6-em)]](https://www.rsc.org/images/entities/char_2009.gif) :
:![[thin space (1/6-em)]](https://www.rsc.org/images/entities/char_2009.gif) 50 metal ratio was the target and in most cases, the ILs exhibit ratios that are very close to this target ratio. Furthermore, some of the ILs exhibit an overall lower metal content than what is expected for a clean and pure IL. This lower total metal content can be assigned to water uptake. For example, IL 2 contains 5.68 and 6.16 wt% of Ni and Cu, respectively. The theoretical values are slightly higher at 6.17 and 6.68 wt% for a 50
50 metal ratio was the target and in most cases, the ILs exhibit ratios that are very close to this target ratio. Furthermore, some of the ILs exhibit an overall lower metal content than what is expected for a clean and pure IL. This lower total metal content can be assigned to water uptake. For example, IL 2 contains 5.68 and 6.16 wt% of Ni and Cu, respectively. The theoretical values are slightly higher at 6.17 and 6.68 wt% for a 50![[thin space (1/6-em)]](https://www.rsc.org/images/entities/char_2009.gif) :
:![[thin space (1/6-em)]](https://www.rsc.org/images/entities/char_2009.gif) 50 metal ratio. A calculation taking into account the Ni and Cu fractions of 5.36 and 5.80 wt%, respectively, obtained from ICP OES for an exact 50
50 metal ratio. A calculation taking into account the Ni and Cu fractions of 5.36 and 5.80 wt%, respectively, obtained from ICP OES for an exact 50![[thin space (1/6-em)]](https://www.rsc.org/images/entities/char_2009.gif) :
:![[thin space (1/6-em)]](https://www.rsc.org/images/entities/char_2009.gif) 50 ratio and balancing this with water yields a composition of (C4Py)2[Ni0.5Cu0.5Cl4]·4H2O. Overall, ICP OES shows that the IL compositions are very close to their target composition. ICP OES data also indicates that some of the ILs do take up some water, similar to many other ILs.30–32
50 ratio and balancing this with water yields a composition of (C4Py)2[Ni0.5Cu0.5Cl4]·4H2O. Overall, ICP OES shows that the IL compositions are very close to their target composition. ICP OES data also indicates that some of the ILs do take up some water, similar to many other ILs.30–32
![[thin space (1/6-em)]](https://www.rsc.org/images/entities/char_2009.gif) :
:![[thin space (1/6-em)]](https://www.rsc.org/images/entities/char_2009.gif) metal ratios determined from ICP OES dataa
metal ratios determined from ICP OES dataa
| IL | Anion | Metal ion content [w%] | Metal![[thin space (1/6-em)]](https://www.rsc.org/images/entities/char_2009.gif) : :![[thin space (1/6-em)]](https://www.rsc.org/images/entities/char_2009.gif) metal ratio from ICP OES metal ratio from ICP OES |
|---|---|---|---|
| Measured (calculated) | |||
a Target metal![[thin space (1/6-em)]](https://www.rsc.org/images/entities/char_2009.gif) : :![[thin space (1/6-em)]](https://www.rsc.org/images/entities/char_2009.gif) metal ratio from synthesis is 50 metal ratio from synthesis is 50![[thin space (1/6-em)]](https://www.rsc.org/images/entities/char_2009.gif) : :![[thin space (1/6-em)]](https://www.rsc.org/images/entities/char_2009.gif) 50 in all cases 50 in all cases |
|||
| 1 | [NiCl4]2− | Ni: 11.23 ± 0.15 (12.41) | n/a |
| 2 | [Ni0.5Cu0.5Cl4]2− | Ni: 5.68 ± 0.58 (6.17) | 50![[thin space (1/6-em)]](https://www.rsc.org/images/entities/char_2009.gif) : :![[thin space (1/6-em)]](https://www.rsc.org/images/entities/char_2009.gif) 50 50 |
| Cu: 6.16 ± 0.65 (6.68) | |||
| 3 | [Ni0.5Co0.5Cl4]2− | Ni: 6.69 ± 0.56 (6.20) | 50![[thin space (1/6-em)]](https://www.rsc.org/images/entities/char_2009.gif) : :![[thin space (1/6-em)]](https://www.rsc.org/images/entities/char_2009.gif) 50 50 |
| Co: 5.77 ± 0.68 (6.23) | |||
| 4 | [Ni0.5Mn0.5Cl4]2− | Ni: 6.54 ± 0.28 (6.23) | 51![[thin space (1/6-em)]](https://www.rsc.org/images/entities/char_2009.gif) : :![[thin space (1/6-em)]](https://www.rsc.org/images/entities/char_2009.gif) 49 49 |
| Mn: 5.62 ± 0.14 (5.83) | |||
| 5 | [Ni0.5Zn0.5Cl4]2− | Ni: 5.99 ± 0.38 (6.16) | 49![[thin space (1/6-em)]](https://www.rsc.org/images/entities/char_2009.gif) : :![[thin space (1/6-em)]](https://www.rsc.org/images/entities/char_2009.gif) 51 51 |
| Zn: 6.97 ± 0.33 (6.86) | |||
| 6 | [Zn0.5Cu0.5Cl4]2− | Zn: 6.31 ± 0.48 (6.83) | 47![[thin space (1/6-em)]](https://www.rsc.org/images/entities/char_2009.gif) : :![[thin space (1/6-em)]](https://www.rsc.org/images/entities/char_2009.gif) 53 53 |
| Cu: 6.57 ± 0.13 (6.64) | |||
| 7 | [Zn0.5Co0.5Cl4]2− | Zn: 6.85 ± 0.28 (6.86) | 52![[thin space (1/6-em)]](https://www.rsc.org/images/entities/char_2009.gif) : :![[thin space (1/6-em)]](https://www.rsc.org/images/entities/char_2009.gif) 48 48 |
| Co: 6.18 ± 0.34 (6.19) | |||
| 8 | [Zn0.5Mn0.5Cl4]2− | Zn: 6.82 ± 0.07 (6.89) | 50![[thin space (1/6-em)]](https://www.rsc.org/images/entities/char_2009.gif) : :![[thin space (1/6-em)]](https://www.rsc.org/images/entities/char_2009.gif) 50 50 |
| Mn: 5.58 ± 0.05 (5.79) | |||
Single crystal structure analysis was performed for compounds 1, 3, and 7 at 210 K. Table 2 summarizes the relevant crystallographic data of their crystal structures. All ILs crystallize in the monoclinic space group P21/n, consistent with earlier data.28,33 The asymmetric unit contains four N-butylpyridinium cations and two tetrachloridometallate(II) anions. For compounds 3 and 7, there is a mixed occupation by the two transition metals on both symmetry-independent atomic positions. The modeling of the occupation of these positions in the final structure refinement was done by using two split positions, where the occupation of the atomic position was fixed to 100%. For compound 3, the refinement resulted in an atomic occupation of Co and Ni of 50![[thin space (1/6-em)]](https://www.rsc.org/images/entities/char_2009.gif) :
:![[thin space (1/6-em)]](https://www.rsc.org/images/entities/char_2009.gif) 50 and for compound 7, an atomic occupation of Co and Zn in the ratio 0.46
50 and for compound 7, an atomic occupation of Co and Zn in the ratio 0.46![[thin space (1/6-em)]](https://www.rsc.org/images/entities/char_2009.gif) :
:![[thin space (1/6-em)]](https://www.rsc.org/images/entities/char_2009.gif) 0.54 is obtained.
0.54 is obtained.
| Compounds | (C4Py)2[NiCl4] (1) | (C4Py)2[Ni0.5Co0.5Cl4] (3) | (C4Py)2[Zn0.54Co0.46Cl4] (7) |
|---|---|---|---|
| Molecular formula | C18H28Cl4N2Ni | C18H28Cl4Co0.50N2Ni0.50 | C18H28Cl4Co0.46N2Zn0.54 |
| M [g mol−1] | 472.93 | 473.04 | 476.64 |
| Temperature [K] | 210 | 210 | 210 |
| Crystal system | Monoclinic | Monoclinic | Monoclinic |
| Space group | P21/n (14) | P21/n (14) | P21/n (14) |
| a [Å] | 15.4965(3) | 15.3911(4) | 15.3694(4) |
| b [Å] | 18.4666(4) | 18.7389(5) | 18.7506(5) |
| c [Å] | 16.7917(3) | 16.7383(4) | 16.7373(4) |
| β [°] | 110.529(1) | 110.494(2) | 110.442(2) |
| V [Å3] | 4500.08(16) | 4522.00(20) | 4519.7(2) |
| Z | 8 | 8 | 8 |
| Dcalcd [g cm−3] | 1.396 | 1.390 | 1.401 |
| μ [mm−1] | 1.34 | 1.29 | 1.41 |
| Reflection collected | 82![[thin space (1/6-em)]](https://www.rsc.org/images/entities/char_2009.gif) 567 567 |
157![[thin space (1/6-em)]](https://www.rsc.org/images/entities/char_2009.gif) 362 362 |
157![[thin space (1/6-em)]](https://www.rsc.org/images/entities/char_2009.gif) 574 574 |
| Independent reflection | 7897 | 7950 | 7947 |
| Reflections I > 2σ(I) | 7041 | 5903 | 6229 |
| Rint | 0.031 | 0.054 | 0.043 |
| No. refined parameters | 456 | 485 | 529 |
| R[F2 > 2σ(F2)], wR(F2), S | 0.026, 0.072, 1.03 | 0.025, 0.060, 0.92 | 0.023, 0.058, 0.97 |
| Δρmax, Δρmin [e Å−3] | 0.90, −0.33 | 0.60, −0.24 | 0.66, −0.26 |
| CCDC | 2157870 | 2157871 | 2157879 |
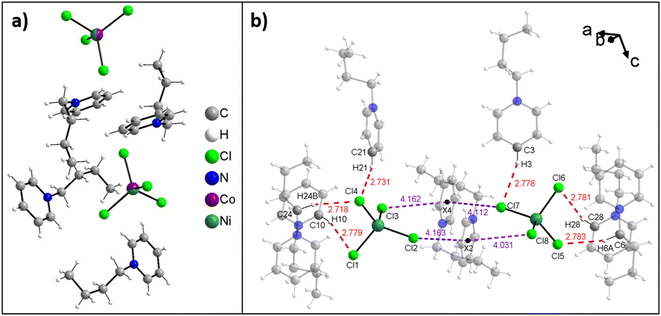
Fig. 2a shows the asymmetric unit of compound 3. All structures of the ILs are isotypic and the arrangement of anions and cations in the solid state occurs with the formation of weak C–H⋯Cl hydrogen bridges and anion⋯π interactions. Moreover, no water is observed in the crystal structure, indicating that the water uptake detected from ICP-OES data (Table 1) is reversible.
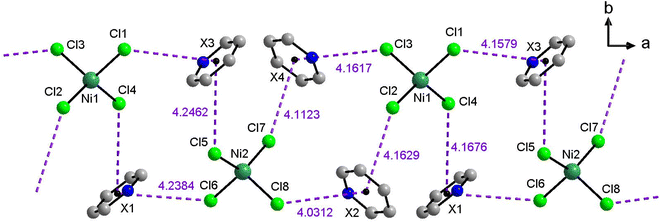
Fig. 2b shows all hydrogen bonds up to a proton-acceptor distances of 2.8 Å for IL 1. Six such symmetry independent hydrogen bonds between the cations and the anions are present. Only two of the four chloride atoms of each anion form hydrogen bonds because the other two chlorides are involved in anion⋯π interactions to the aromatic rings of the cation. Overall, each chloride forms one such anion⋯π interaction and each cation forms two such anion⋯π interactions leading to intermolecular chains along the crystallographic a-axis. In each compound eight symmetry independent anion⋯π interactions are present and the distances vary from 4.0 Å to 4.3 Å (Fig. 3). Further figures of the structures, packing, and interactions in the crystals of 1, 3, and 7 are shown in the ESI, Fig. S1–S18, Tables S1–S3.†
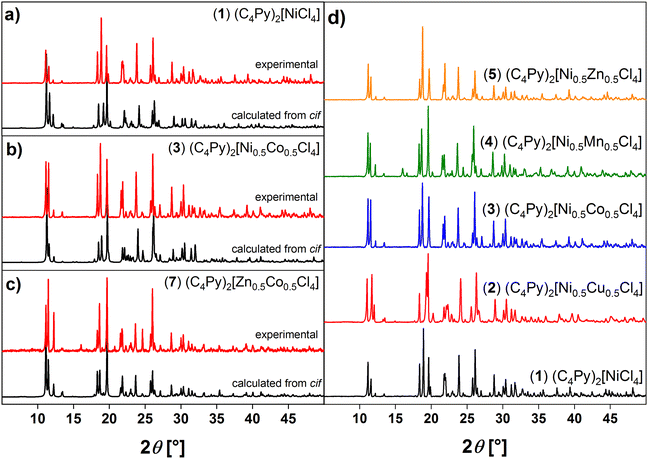
Additional powder X-ray diffraction (XRD) data show that powders obtained from the synthesis have the same crystal structure as the single crystals. Comparison of the XRD patterns with patterns computed from the respective single crystal structures show a very good agreement with the experimental XRD patterns thus confirming identical structures, Fig. 4a–c. All ILs are isostructural to one another and show a relatively good crystallinity (Fig. 4). These data also agree very well with previous data.28,33 Fig. S19† also shows that these patterns agree well with those obtained from the compounds based on only one metal.
Fig. 5 shows representative Fourier-transform infrared (FT-IR) spectra of the ILs. Bands between 3100 and 2800 cm−1 can be assigned to vibrations in the n-butyl group and bands between 1650 and 1450 cm−1 can be assigned to vibrations of the pyridinium ring (aromatic C![[double bond, length as m-dash]](https://www.rsc.org/images/entities/char_e001.gif) N, C
N, C![[double bond, length as m-dash]](https://www.rsc.org/images/entities/char_e001.gif) C), in analogy to previous data.28,33 Additional broad bands between 3500 and 3100 cm−1 indicate the presence of water, thus confirming the ICP-OES data, Table 1.
C), in analogy to previous data.28,33 Additional broad bands between 3500 and 3100 cm−1 indicate the presence of water, thus confirming the ICP-OES data, Table 1.
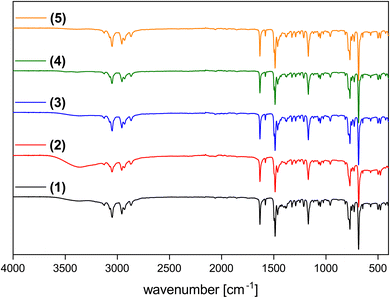 | ||
| Fig. 5 IR spectra of (C4Py)2[NiCl4] (1, black), (C4Py)2[Ni0.5Cu0.5Cl4] (2, black), (C4Py)2[Ni0.5Co0.5Cl4] (3, black), (C4Py)2[Ni0.5Mn0.5Cl4] (4, black) and (C4Py)2[Ni0.5Cu0.5Cl4] (5, black). Additional IR spectra of compounds 6, 7, 8 are shown in Fig. S20.† Data are shifted vertically to show all spectra clearly; y-axis shows transmission. | ||
The thermal stability of the ILs was analyzed via thermogravimetric analysis (TGA), Fig. 6a and S21.† Under conventional dynamic heating conditions with a heating rate of 10 K min−1, the ILs 1–8 are thermally stable up to ca. 250 °C. Most ILs show a first mass loss below 5% up to 200 °C. This loss can be attributed to water and solvent evaporation. Between 250 and ca. 370 °C a significant weight loss is observed. This loss can be attributed to the decomposition of the N-butylpyridinium ion, especially the elimination of the butyl side chain. The last two overlapping steps between ca. 370 and 800 °C can be attributed to further decomposition of the IL. Table 3 summarizes the TGA data for all compounds. Similar thermal properties were observed for imidazolium-based MILs including zinc and nickel. Here, Clarke et al.34 studied the thermal properties and stability of multiple MILs consisting of different metal halide anions and imidazolium or phosphonium-based cations. As shown here, the MILs presented by Clarke et al. are all thermally stable up to 200 °C. Moreover, a two-step degradation process shown in this publication is comparable to the one presented in the current article. This indicates a similar degradation mechanism including reverse Menshutkin decomposition, chloride dissociation and inorganic metal halide formation.
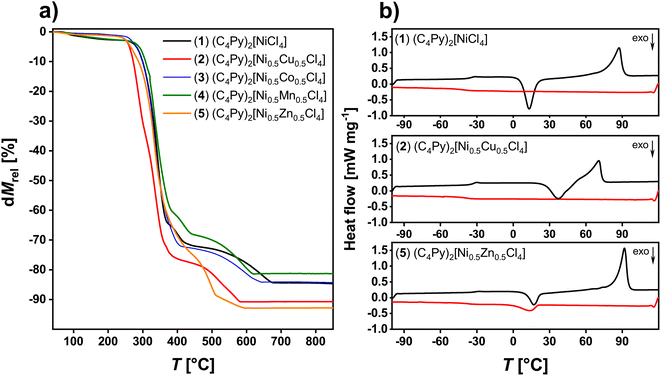 | ||
| Fig. 6 (a) TGA data of ILs 1 to 5 and (b) representative DSC data (2nd heating, black and 2nd cooling, red) of IL 1, 2, and 5. | ||
| IL | Heating | Cooling | ||||||||
|---|---|---|---|---|---|---|---|---|---|---|
| Tga [°C] | ΔCp [J mol−1 K−1] | Txtb [°C] | ΔH [kJ mol−1] | Tmc [°C] | ΔH [kJ mol−1] | Tga [°C] | ΔCp [J mol−1 K−1] | Txtd [°C] | ΔH [kJ mol−1] | |
| a All measurements were done with a heating rate of 10 K min−1 from −100 to 120 °C. All temperatures are the onset temperatures, [a] glass transition temperature, [b] melting temperature, [c] melting temperature (heating cycle), [d] crystallization temperature (cooling cycle). Empty fields indicate that transitions were not observed. | ||||||||||
| 1 | −31.9 ± 0.4 | 150.7 ± 12.6 | 6.6 ± 0.7 | −24.1 ± 2.1 | 76.6 ± 0.4 | 29.0 ± 0.2 | −60.2 ± 1.2 | 136.8 ± 11.0 | −10.35 | −3.6 ± 0.3 |
| 2 | −35.5 ± 0.2 | 167.3 ± 2.3 | 26.4 ± 0.5 | −18.8 ± 1.8 | 58.2 ± 0.3 | 18.1 ± 1.7 | −44.4 ± 0.2 | 189.4 ± 3.8 | ||
| 3 | 87.7 ± 0.3 | 31.6 ± 0.1 | 23.7 ± 5.0 | −30.2 ± 0.1 | ||||||
| 4 | 94.1 ± 0.1 | 31.3 ± 0.3 | 46.0 ± 3.6 | −30.2 ± 0.1 | ||||||
| 5 | −33.4 ± 0.3 | 0.09 ± 0.02 | 9.5 ± 0.9 | −19.1 ± 5.1 | 84.8 ± 0.2 | 31.3 ± 0.3 | −55.4 ± 4.0 | 0.1 ± 0.0 | −0.9 ± 3.0 | −9.5 ± 6.8 |
| 6 | 79.5 ± 0.2 | 31.2 ± 0.1 | 33.4 ± 1.0 | −30.0 ± 0.1 | ||||||
| 7 | 89.4 ± 0.4 | 31.1 ± 0.3 | 19.4 ± 2.3 | −33.8 ± 0.3 | ||||||
| 8 | 94.8 ± 0.2 | 35.0 ± 0.2 | 40.5 ± 2.5 | −34.4 ± 0.3 | ||||||
The phase behavior of the ILs 1–8 was determined via differential scanning calorimetry (DSC), Fig. 6b. Upon heating, some ILs exhibit glass transitions (Tg) at around −35 °C, while some ILs do not exhibit any signal at these temperatures. Upon further heating, some ILs (ILs 1, 2 and 5) show a cold crystallization, typically at around 6 to ca. 26 °C. Again, this process is not observed for all compounds. Finally, all ILs exhibit a clear melting transition between 70 to 100 °C. Upon cooling, all ILs exhibit a strong undercooling typical of ILs. While most ILs do show a crystallization there is one example, IL 2, which does not show a direct crystallization signal. Also Tg is not always observed upon cooling. These observations are very similar to previous examples.28,33
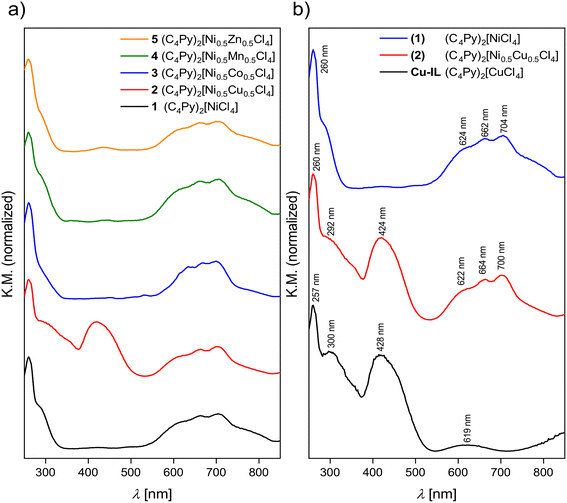
Fig. 7 shows UV-Vis solid-state reflectance measurements of the nickel-containing ILs. All ILs have an absorption band at ca. 260 nm, which stems from the n → π* and π → π* transitions of the cation.28 In addition to the typical bands from tetrahedrally coordinated Ni2+ between 550 and 750 nm, all spectra show additional bands that can be assigned to the second metal in the ILs. For example, in the case of IL 2, in addition to the transitions in the range from 550 to 750 nm that can be ascribed to the Ni2+ 3T1(F) → 3T1(P) transition,35 there is also a band at 424 nm. This transition can be assigned to the d–d transition of tetrahedrally coordinated Cu2+.36–38
In the case of IL 3 the absorption bands of the Co2+ and Ni2+ transitions overlap between 550 to 750 nm and cannot be observed separately. In the case of the Ni2+/Mn2+ combination, essentially only the Ni-centered transitions can be observed and the Mn-centered signals are very weak. This is due to the well-known fact that d–d transitions in Mn2+ are parity forbidden.39 Zn2+ does not contribute to the spectra because these are d10 systems and therefore no transitions can be observed in the respective spectra. The combination of the two contributions to the overall spectra is demonstrated in Fig. 7b for the Ni/Cu pair. Spectra of all ILs are shown in Fig. S22.†
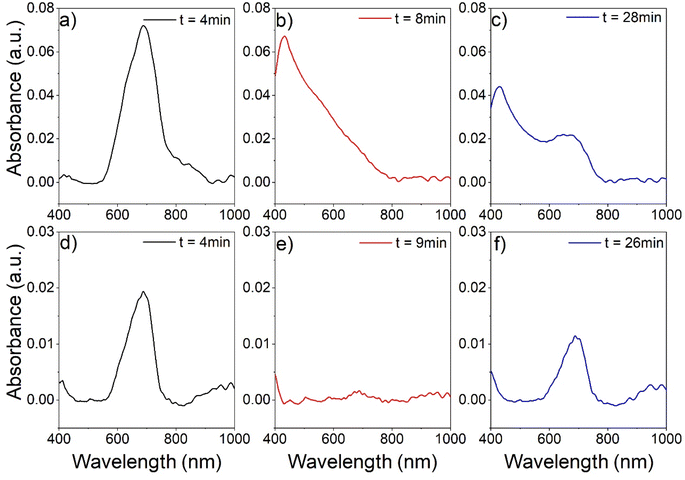
Since the central unit in these ILs is essentially a metal complex, ligand exchange reactions, e.g., with gaseous molecules, can occur. These ligand exchange or addition reactions can be accompanied by quite strong color changes, and application in gas sensing would be possible.40 A previous study by Bagdahn et al. of a copper-based MIL-hybrid material showed a color change after the material was exposed to ammonia vapor.41 For example, Fig. 8 shows the analysis of the absorbance of a layer of (C4Py)2[Ni0.5Zn0.5Cl4] deposited on glass and exposed to nitrogen-assisted ammonia vapor. The sample was placed in a transparent flow cell and then exposed to a stream of N2 for 5 minutes. Fig. 8a shows the absorption spectrum of the sample in the N2 stream (4 minutes after the start of the experiment). Only one main peak is observed at 680 nm. After three minutes of exposure to ammonia vapor (minute 8 of the experiment, Fig. 8b), the peak at 680 nm has disappeared and an intense peak at 420 nm predominates in the absorption spectrum. In minute 10 of the experiment, the gas stream is switched back to pure N2. Fig. 8c shows the absorption spectrum of the sample after 28 minutes of the experiment, corresponding to the ammonia desorption phase. This spectrum is a convolution of the two previously observed peaks, with the peak at 420 nm losing intensity and the peak at 680 nm gaining intensity.
However, examination of the change in the absorption spectrum as a function of time shows that the spectrum in Fig. 8c has reached a nearly steady state. A similar analysis was performed with wet N2 (nitrogen stream containing water vapor). As in the previous case, the ionic liquid layer shows a main absorption peak at 680 nm at the beginning of the analysis (Fig. 8d). When the sample is exposed to wet N2 (Fig. 8e), the intensity of the peak decreases. However, the appearance of another peak at 420 nm as in the case of ammonia exposure is not observed. In the desorption phase (Fig. 8f), the peak at 680 nm recovers by slightly more than 50% of the original intensity. A more comprehensive analysis of the behavior of the absorption peaks in the presence of ammonia or wet nitrogen is presented in the ESI Fig. S23,† as well as the behavior of other ionic liquids.
Discussion
We have previously shown that metal containing ILs can be modified by combining more than one metal into the MX42− anion, even at different ratios. For example, proper combination of metals enables the synthesis of ILs exhibiting colors from light blue to red.28 The current article explores two further aspects: (1) the use of additional d-metals that have not been studied in detail so far and (2) the exploitation of the UV-Vis absorption of these ILs to generate a prototype optical sensor for ammonia gas sensing.Clearly, the addition of further metal ions to the existing pool of M2+ (M = Cu, Co, Zn, etc.) broadens the accessible color range and the current ILs exhibit additional colors, especially in the blue to green range, Fig. 1. This simple observation can also be corroborated by solid state UV-Vis spectroscopy. The spectra of the ILs are a combination of the spectra of the individual d-metal present in the ILs, Fig. 7 and S22.† As a result, the combination of two different metal ions in the current ILs provides an ever increasing pool of strongly colored ILs with melting points below ca. 100 °C, Fig. 6, Table 3. Finally, ICP OES (Table 1) and IR spectroscopy (Fig. 5, S20†) show that while some ILs take up some water, the uptake is reversible and all solvent or water is released below 200 °C, consistent with TGA, Fig. 6a and S21.†
At this point it must be noted that, contrary to previous data,28 these ILs do not exhibit a band gap. Rather, the UV-Vis spectra clearly show that there are individual contributions from separated metal centers and there is no indication of the formation of bands or band gaps.
The crystal structures are closely related to the existing examples23,28,33,42 and these data clearly show that the process and approach towards these ILs is highly reproducible, flexible, and adaptable. Moreover, like on the previous examples, all structures of the single crystals (Fig. 2, 3, Table 1, Fig. S1–S18, Tables S1–S3†) match those observed in the powders isolated directly from the synthesis (Fig. 4 and S19†).
As a result, the approach towards multi-metallic ILs is extremely flexible, adaptable, and robust. Moreover, the optical properties lend themselves for exploitation in, e.g., sensing or gas sequestration. Indeed, our preliminary experiments (Fig. 8 and S23†) show that an efficient gas detection can be realized using a very simple optical setup. This clearly demonstrates the high potential of multi-metallic ILs for the development of, e.g. gas sensors. However, a detailed analysis of the data shows that there is a need to further develop and optimize the gas sensor design. For example, the variation in optical response of different ionic liquids to ammonia vapor and water vapor suggest (see Fig. S23 and S24†) to explore the potential of arrays of colorimetric sensors based on different ionic liquids for detecting volatile gases and their mixtures in air (optical nose).43
Besides sensing, one must not forget that (ammonia) gas sequestration or gas separation (membranes) are topics of high current interest.44,45 Given the fact that the ammonia uptake is quite effective, these materials could also be candidates for gas sequestration, but this is a subject beyond the scope of this article and will be evaluated in the future.
Conclusion
The current study further expands the pool of metal-based ILs, in particular in terms of the color and chemical space. The process towards these interesting and diverse ILs is extremely robust and highly flexible. The ILs can easily be adapted to a certain property and composition and the synthesis can easily be scaled to (at least) a multi-gram scale. Moreover, the ILs can be processed into a sensor suitable for the detection of ammonia (other gases will certainly follow suit) and the system therefore represents a versatile prototype for a highly flexible and adaptable sensor platform or possibly for gas sequestration.Experimental section
Materials
N-Butylpyridinium chloride (≥98%, Merck, CAS), CuCl2 (99.995%, ABCR, CAS), CoCl2 (99.95%, ABCR, CAS), MnCl2 (99.95%, ABCR, CAS), NiCl2 (99.95%, ABCR, CAS), ZnCl2 (99.95%, ABCR, CAS), 2-propanol (99.5%, Carl Roth, CAS) and hydrochloric acid (37%, VWR Chemicals, CAS) were used without further purification.General IL synthesis route
IL synthesis was done according to ref. 25. The synthesis procedure was repeated up to five times for reproducibility. 2.00 g (8.31 mmol) of N-butylpyridinium chloride were dissolved in 50 mL 2-propanol. For monometallic and bimetallic ILs, 4.16 mmol of anhydrous metal salts (M = Cu, Co, Mn, Ni, Zn) and 0.1 mL of HCl (37%) was added to the solution and the mixture was stirred for 30 to 60 minutes under reflux. The solvent was removed by rotary evaporation and the resulting products were dried under vacuum (10−3 mbar). The products were used without further purification. For single crystal growth, a few grains of the compounds were dissolved in various solvents, e.g. methanol, acetonitrile, or 2-propanol. The solvents were allowed to slowly evaporate and after several days to weeks, crystals could be collected.Inductively coupled plasma optical emission spectrometry
ICP OES measurements were performed on a PerkinElmer Optical Emission Spectrometer Optima 5300 DV (Scott-Chamber/Cross-Flow-Nebulizer). Read time was 2 to 10 s with a power of 1400 W and plasma gas flow of 17 L min−1, auxiliary gas flow of 0.2 L min−1 and nebulizer gas flow of 0.6 L min−1. The measurement was performed axially. The signals of Cu, Co, Mn, Ni and Zn were observed at λ = 327.393, 238.892, 257.610, 231.604, and 213.8 nm. The metal content of the ILs was measured three times per sample and two different batches of the ILs were used for comparability.Single-crystal X-ray diffraction
Suitable single crystals were selected using a light microscope and separated with perfluoropolyalkylether oil. The X-ray diffraction experiment was carried out on a Stoe Stadivari (four circle goniometer) with a Genix Microfocus X-ray source (Mo-Kα-radiation, λ = 0.71073 Å) and a Pilatus 200 K detector. The measurements were done at 210 K using an Oxford Cryosteam cooling device. The data were corrected for absorption as well as for Lorentz and polarization effects using the program X-area and the structure was solved by direct methods and refined against F2 on all data by full-matrix least-squares using the SHELX suite of programs.46,47 The crystal structure was visualized with Diamond.48 The crystallographic data (1: CCDC 2157870; 2: CCDC 2157871; 3: CCDC 2157879) are available from the CCDC website.Powder X-ray diffraction
XRD data were collected on a Panalytical Empyrean powder X-ray diffractometer operating at 40 kV and 40 mA. The diffractometer was configured with a focusing X-ray mirror for Cu radiation (λ = 1.5419 Å) and a pixcel 1D detector. Scans were performed from 4 to 70° in 2θ with a step size of 0.0131°.Infrared spectroscopy
IR spectra were recorded on a Thermo Nicolet FT-IR Nexus with a SmartOrbit ATR attachment from 4000 to 400 cm−1 with a resolution of 4 cm−1 and 64 scans. The resulting data were evaluated and refined (H2O, CO2 and ATR correction) with the program Omnic V6.2 (Thermo Nicolet).Thermogravimetric analysis
TGA was done on a PerkinElmer TGA 4000 in air from room temperature to 900 °C. The heating rate was 10 K min−1 and data analysis was done with the Pyris software package (PerkinElmer).Differential scanning calorimetry
DSC measurements were performed on a Neztsch DSC 214 Polyma with heating rates of 1, 2, 5, or 10 K min−1 under nitrogen. A total of four cycles were measured for each sample. The resulting data were evaluated with the Proteus V7.1.0 software (Netzsch).UV-Vis spectroscopy and sensor prototype
A 0.21 mol L−1 solution of the IL (C4Py)2[Ni0.5Zn0.5Cl4] in methanol was prepared. Microscopy glass slides (20 × 20 mm2, Carl Roth) were treated with piranha solution (mixture of 96% H2SO4 and 30% H2O2, ratio 3![[thin space (1/6-em)]](https://www.rsc.org/images/entities/char_2009.gif) :
:![[thin space (1/6-em)]](https://www.rsc.org/images/entities/char_2009.gif) 1, v/v) for at least 2 hours, cleaned with deionized water, and dried in a stream of nitrogen. Afterwards, 80 μL of the methanolic solution were deposited on the glass slides and distributed as uniformly as possible over the complete surface of the slide with a pressure modulated stream of air.
1, v/v) for at least 2 hours, cleaned with deionized water, and dried in a stream of nitrogen. Afterwards, 80 μL of the methanolic solution were deposited on the glass slides and distributed as uniformly as possible over the complete surface of the slide with a pressure modulated stream of air.
Improved distribution of the IL on the glass slide was achieved by spin-coating using a custom-made spin coater with a DC Power Supply (Voltcraft, Model 2256) for 5 minutes with 13 V, which refers to ∼310 rpm. The slides were left to dry upright to avoid the formation of drying traces.
Before the measurement the coated glass slides were pretreated in the drying oven at 50 °C for several minutes and then directly inserted into a flow cell. They were flushed with nitrogen for 5 minutes. After that they were flushed for another 5 minutes with nitrogen that was bubbled through 5 mL of aqueous ammonia solution (25%, AnalaR NORMAPUR, VWR Chemicals). Afterwards, the glass slides were again flushed with nitrogen for 20 minutes. As a control experiment, the same measurements were also performed with 5 mL of water (here called wet nitrogen) instead of aqueous ammonia solution. The experimental setup can be found in Fig. S25.† All sensing experiments were repeated 3 times showing a high level of repeatability.
Time-resolved UV-Vis spectra were then recorded for 5 minutes with an absorbance spectrum collected every 2 seconds. UV/Vis spectra were measured using an Ocean Optics QE65 Pro Spectrometer (Ostfildern, Germany) with an Ocean Optics Halogen Lightsource HL-2000 (Ostfildern, Germany). The light source contained two filters (Absorptive ND Filter, NE21OB and NE205B, Thorlabs GmbH, Bergkirchen, Germany) to decrease the light intensity. The distance between the optical fiber coming from the light source and the sample was 12 cm and the distance between the sample and the optical fiber going to the spectrometer was 8 cm. The measurements were carried out using the program Ocean View (integration time 8 ms, scans to average 25, boxcar width 5, trigger mode: on demand, electric dark correction enabled, non-linearity correction disabled) and evaluated with the program Igor Pro 9.00 using the macro provided by Sailor.49,50
Conflicts of interest
There are no conflicts to declare.Acknowledgements
We thank the University of Potsdam (grant 53170000, A.T.) and the Deutsche Forschungsgemeinschaft (DFG, German Research Foundation, project number: 426213922, C.P.) for financial support. Publication was funded by the Deutsche Forschungsgemeinschaft (DFG, German Research Foundation) – Projektnummer 491466077.References
- M. Kar, N. V. Plechkova, K. R. Seddon, J. M. Pringle and D. R. MacFarlane, Ionic Liquids – Further Progress on the Fundamental Issues, Aust. J. Chem., 2019, 72, 3 CrossRef CAS.
- T. V. Doherty, M. Mora-Pale, S. E. Foley, R. J. Linhardt and J. S. Dordick, Ionic liquid solvent properties as predictors of lignocellulose pretreatment efficacy, Green Chem., 2010, 12, 1967 RSC.
- R. D. Rogers and K. R. Seddon, Ionic Liquids-Solvents of the Future?, Science, 2003, 302, 792–793 CrossRef PubMed.
- J. S. Wilkes, Properties of ionic liquid solvents for catalysis, J. Mol. Catal. A Chem., 2004, 214, 11–17 CrossRef CAS.
- S. Rezaei Motlagh, et al., Screening of Suitable Ionic Liquids as Green Solvents for Extraction of Eicosapentaenoic Acid (EPA) from Microalgae Biomass Using COSMO-RS Model, Molecules, 2019, 24, 713 CrossRef PubMed.
- P. Sun, et al., Photoluminescent sensing vesicle platform self-assembled by polyoxometalate and ionic-liquid-type imidazolium gemini surfactants for the detection of Cr3+ and MnO4− ions, J. Colloid Interface Sci., 2019, 547, 60–68 CrossRef CAS PubMed.
- E. E. L. Tanner, et al., Design Principles of Ionic Liquids for Transdermal Drug Delivery, Adv. Mater., 2019, 31, 1901103 CrossRef PubMed.
- N. Zdolšek, et al., Electrochemical investigation of ionic liquid-derived porous carbon materials for supercapacitors: pseudocapacitance versus electrical double layer, Electrochim. Acta, 2019, 298, 541–551 CrossRef.
- I. Ruggeri, C. Arbizzani, S. Rapino and F. Soavi, Oxygen Redox Reaction in Ionic Liquid and Ionic Liquid-like Based Electrolytes: A Scanning Electrochemical Microscopy Study, J. Phys. Chem. Lett., 2019, 10, 3333–3338 CrossRef CAS PubMed.
- S. Lerch and T. Strassner, Expanding the Electrochemical Window: New Tunable Aryl Alkyl Ionic Liquids (TAAILs) with Dicyanamide Anions, Chem.–Eur. J., 2019, 25, 16251–16256 CrossRef CAS PubMed.
- T. L. Greaves, A. Weerawardena, C. Fong, I. Krodkiewska and C. J. Drummond, Protic Ionic Liquids: Solvents with Tunable Phase Behavior and Physicochemical Properties, J. Phys. Chem. B, 2006, 110, 22479–22487 CrossRef CAS PubMed.
- K. A. Ghandi, Review of Ionic Liquids, Their Limits and Applications, Green Sustain. Chem., 2014, 04, 44–53 CrossRef CAS.
- R. L. Vekariya, A review of ionic liquids: applications towards catalytic organic transformations, J. Mol. Liq., 2017, 227, 44–60 CrossRef CAS.
- Z. Lei, B. Chen, Y.-M. Koo and D. R. MacFarlane, Introduction: Ionic Liquids, Chem. Rev., 2017, 117, 6633–6635 CrossRef PubMed.
- H. Zhao, Review: current studies on some physical properties of ionic liquids, Phys. Chem. Liq., 2003, 41, 545–557 CrossRef CAS.
- M. Galiński, A. Lewandowski and I. Stępniak, Ionic liquids as electrolytes, Electrochim. Acta, 2006, 51, 5567–5580 CrossRef.
- J. Estager, J. D. Holbrey and M. Swadźba-Kwaśny, Halometallate ionic liquids – revisited, Chem. Soc. Rev., 2014, 43, 847–886 RSC.
- R. Kore, et al., Group IIIA halometallate ionic liquids: speciation and applications in catalysis, ACS Catal., 2017, 7, 7014–7028 CrossRef CAS.
- M. Watanabe, et al., Application of Ionic Liquids to Energy Storage and Conversion Materials and Devices, Chem. Rev., 2017, 117, 7190–7239 CrossRef CAS PubMed.
- A. Taubert, CuCl Nanoplatelets from an Ionic Liquid-Crystal Precursor, Angew. Chem., Int. Ed., 2004, 43, 5380–5382 CrossRef CAS PubMed.
- R. Farra, et al., Tetrahalidocuprates(ii)—structure and EPR spectroscopy. Part 1: tetrabromidocuprates(ii), New J. Chem., 2011, 35, 2793 RSC.
- A. Winter, et al., Tetrahalidocuprates(ii) – structure and EPR spectroscopy. Part 2: tetrachloridocuprates(ii), New J. Chem., 2014, 38, 1019 RSC.
- C. Balischewski, et al., Tetrahalidometallate(II) ionic liquids with more than one metal: the effect of bromide vs. chloride, Chem.–Eur. J., 2022, 28, e202201068 CrossRef CAS PubMed.
- O. S. Wenger, Vapochromism in Organometallic and Coordination Complexes: Chemical Sensors for Volatile Organic Compounds, Chem. Rev., 2013, 113, 3686–3733 CrossRef CAS PubMed.
- P. De Vreese, et al., Speciation of Copper(II) Complexes in an Ionic Liquid Based on Choline Chloride and in Choline Chloride/Water Mixtures, Inorg. Chem., 2012, 51, 4972–4981 CrossRef CAS PubMed.
- S. Zeng, et al., Efficient adsorption of ammonia by incorporation of metal ionic liquids into silica gels as mesoporous composites, Chem. Eng. J., 2019, 370, 81–88 CrossRef CAS.
- J. Wang, et al., Metal chloride anion-based ionic liquids for efficient separation of NH3, J. Clean. Prod., 2019, 206, 661–669 CrossRef CAS.
- C. Balischewski, et al., Ionic liquids with more than one metal: optical and electrochemical properties vs. d-metal combinations, Chem.–Eur. J., 2020, 26(72), 17504–17513 CrossRef CAS PubMed.
- A. Zabel, A. Winter, A. Kelling, U. Schilde and P. Strauch, Tetrabromidocuprates(II)—Synthesis, Structure and EPR, Int. J. Mol. Sci., 2016, 17, 596 CrossRef PubMed.
- M. Deetlefs, K. R. Seddon and M. Shara, Predicting physical properties of ionic liquids, Phys. Chem. Chem. Phys., 2006, 8, 642–649 RSC.
- J. S. Torrecilla, C. Tortuero, J. C. Cancilla and P. Díaz-Rodríguez, Estimation with neural networks of the water content in imidazolium-based ionic liquids using their experimental density and viscosity values, Talanta, 2013, 113, 93–98 CrossRef CAS PubMed.
- W. Zhao, et al., Effect of water in ionic liquid on the separation performance of supported ionic liquid membrane for CO2/N2, J. Memb. Sci., 2010, 350, 279–285 CrossRef CAS.
- A. Abouserie, et al., Alkylpyridinium Tetrahalidometallate Ionic Liquids and Ionic Liquid Crystals: Insights into the Origin of Their Phase Behavior, Eur. J. Inorg. Chem., 2017, 5640–5649 CrossRef CAS.
- C. J. Clarke, et al., Halometallate ionic liquids: thermal properties, decomposition pathways, and life cycle considerations, Green Chem., 2022, 24, 5800–5812 RSC.
- C. Preti and G. Tosi, Complexes of Cobalt(II), Nickel(II), And Copper Acetates, Perchlorates, and Tetrafluoroborates with Heterocyclic Ligands Containing Va and Via Group Donor Atoms, Can. J. Chem., 1975, 53, 177–185 CrossRef CAS.
- J. Díaz-Visurraga, et al., Study on antibacterial alginate-stabilized copper nanoparticles by FT-IR and 2D-IR correlation spectroscopy, Int. J. Nanomedicine, 2012, 7, 3597–3612 CrossRef PubMed.
- M. A. Khan, J. Meullemeestre, M. J. Schwing and F. Vierling, Stability, spectra and structure of the copper(II) chloride complexes in acetic acid, Polyhedron, 1983, 2, 459–463 CrossRef CAS.
- K. Thiel, T. Klamroth, P. Strauch and A. Taubert, On the interaction of ascorbic acid and the tetrachlorocuprate ion [CuCl4]2− in CuCl nanoplatelet formation from an ionic liquid precursor (ILP), Phys. Chem. Chem. Phys., 2011, 13, 13537 RSC.
- A. El-Korashy and M. G. Brik, Crystal growth, spectroscopic and crystal field studies of [N(CH3)4]2MnCl4 and [N(CH3)4]2CoCl4 single crystals in the paraelectric phase, Solid State Commun., 2005, 135, 298–303 CrossRef CAS.
- Y. Funasako, T. Mochida, K. Takahashi, T. Sakurai and H. Ohta, Vapochromic Ionic Liquids from Metal-Chelate Complexes Exhibiting Reversible Changes in Color, Thermal, and Magnetic Properties, Chem.–A Eur. J., 2012, 18, 11929–11936 CrossRef CAS PubMed.
- C. Bagdahn and A. Taubert, Ionogel Fiber Mats: Functional Materials via Electrospinning of PMMA and the Ionic Liquid Bis(1-butyl-3-methyl-imidazolium) Tetrachloridocuprate(II), [Bmim]2[CuCl4], Z. Naturforsch., B: J. Chem. Sci., 2013, 68, 1163–1171 CrossRef CAS.
- A. Abouserie, U. Schilde and A. Taubert, The crystal structure of N-butylpyridinium bis(μ2-dichlorido)-tetrachloridodicopper(II), C18H28N2Cu2Cl6, Z. Kristallogr. - New Cryst. Struct., 2018, 233, 743–746 CrossRef CAS.
- H. Zhang, L. Lin, D. Liu, Q. Chen and J. Wu, Optical nose based on porous silicon photonic crystal infiltrated with ionic liquids, Anal. Chim. Acta, 2017, 953, 71–78 CrossRef CAS PubMed.
- A. Valera-Medina, et al., Review on Ammonia as a Potential Fuel: From Synthesis to Economics, Energy Fuels, 2021, 35, 6964–7029 CrossRef CAS.
- S. Ornes, Green ammonia could produce climate-friendly ways to store energy and fertilize farms, Proc. Natl. Acad. Sci. USA, 2021, 118, 1–4 Search PubMed.
- G. M. Sheldrick, A short history of SHELX, Acta Crystallogr., Sect. A: Found. Crystallogr., 2008, 64, 112–122 CrossRef CAS PubMed.
- G. M. Sheldrick, Crystal structure refinement with SHELXL, Acta Crystallogr., Sect. C: Struct. Chem., 2015, 71, 3–8 Search PubMed.
- K. Brandenburg and H. Putz, Diamond - Crystal and Molecular Structure Visualization, 2020, at https://www.crystalimpact.de/diamond Search PubMed.
- M. J. Sailor, Porous Silicon in Practice – Preparation, Characterization and Applications, Wiley-VCH, Weinheim, 2011 Search PubMed.
- S. R. Labs, Silicon Nanomaterials Resources, 2022, https://sailorgroup.ucsd.edu/research/porous_Si_resources.html Search PubMed.
Footnote |
| † Electronic supplementary information (ESI) available. CCDC 2157870, 2157871 and 2157879. For ESI and crystallographic data in CIF or other electronic format see DOI: https://doi.org/10.1039/d2ra05581c |
| This journal is © The Royal Society of Chemistry 2022 |

