 Open Access Article
One-pot room-temperature synthesis of a BiOCl hierarchical microsphere assembled from nanosheets with exposed {001} facets for enhanced photosensitized degradation
Liyan Wang *a,
Zhiqiang Miao†
a,
Fei Bia,
Shanshan Xiaoa,
Li Zhaoa,
Yongtao Lia,
Lingwei Konga,
Yingqi Li
 *b,
Jingxiu Yanga,
Xuejian Zhang*a and
Guangqing Gai*a
aKey Laboratory of Building Energy-Saving Technology Engineering of Jilin Provincial, School of Materials Science and Engineering, Jilin Jianzhu University, Changchun 130118, P. R. China. E-mail: wlynzy@163.com; zxj_0620@163.com; gaigq@163.com
bKey Laboratory of Polyoxometalate and Reticular Material Chemistry of Ministry of Education, Department of Chemistry, Northeast Normal University, Changchun 130024, P. R. China. E-mail: liyq164@nenu.edu.cn
First published on 15th December 2022
Abstract
BiOCl hierarchical microspheres assembled from nanosheets with exposed {001} facets were successfully synthesized using PEG-2000 as template by a one-pot room-temperature hydrolysis method. The PEG-modified BiOCl photocatalyst exhibits a significantly enhanced RhB photosensitized degradation activity under visible light. After 10 min white LED irradiation, the degradation efficiency of RhB by the PEG-modified BiOCl sample S0.07 reaches 99.5%. The degradation rate constant of the PEG-modified sample S0.07 over RhB is 0.4568 min−1, which is 6.76 times that of the unmodified sample S0 (0.0676 min−1). After 4 min of xenon lamp (λ ≥ 420 nm) irradiation, the degradation rate of RhB by S0.07 is almost 100%. The exposed {001} facets with surface defects contribute to the superior adsorption capacity of BiOCl towards RhB, which immensely accelerates the electron transfer efficiency from the excited RhB into the conduction band of BiOCl, forming superoxide radical (˙O2−) active species to degrade the pollutants. Moreover, the superior RhB-sensitized BiOCl system provides high photocatalytic degradation activity over MO. This work provides a facile and efficient BiOCl synthesis method that is conducive to large-scale production and simultaneously opens up new ideas for the synthesis of other photocatalysts.
Introduction
In the past few decades, unrestrained industrial growth worldwide has accelerated the consumption of fossil fuels and the release of greenhouse gas (CO2).1 The discharge of a large number of harmful pollutants and toxic gases inevitably contributes to water bodies and air pollution. Semiconductor photocatalytic technology, as one of the most appealing green and environmentally benign technologies, has been explored to tackle environmental issues involving the elimination of organic pollutants, decomposition of water to hydrogen, and CO2 photo-reduction for fuels.2,3 Until now, abundant photocatalysts have been widely investigated for sewage treatment and air purification.Recently, bismuth-based ternary metal oxide photocatalysts with visible light responsiveness, such as Bi2MoO6,4,5 Bi2WO6,6,7 BiFeO3,1,2 BiVO4,8 and BiOX (X = Cl, Br, I)2,9 have attracted substantial research interest. Among them, BiOCl has a tetragonal layered structural feature by [Bi2O2]2+ slabs interleaved by double slabs of halogen atoms.10 The inherent internal static electric fields caused by Cl atom layers and [Bi2O2]2+ layers can effectively facilitate the separation and transfer of electron–hole pairs along the [001] direction.11 Moreover, BiOCl possesses some advantages of the indirect band gaps, high dipole moment, high redox ability, and high electron–hole separation efficiency.12
Nevertheless, the wide bandgap of BiOCl limits its ability to collect visible light.9 Therefore, how to develop a kind of BiOCl photocatalyst with a wide visible light response has become a hot topic of research. Constructing heterojunction, doping with metal or non-metal, regulating bandgap, introducing surface defect, regulating crystal surface exposure, have been adopted to develop BiOCl photocatalysts capable of collecting visible light.9,13,14 At present, the research on BiOCl nanosheets with exposed {001} facets has indicated that the reactive {001} facets contribute to outstanding photocatalytic activity.15,16 Recently, it is generally considered that the exposed {001} facets can result in the formation of oxygen vacancies.17 Yang et al. revealed that surface oxygen vacancies could easily adsorb and activate molecular oxygen to generate oxygen ions (O−).18 The negative {001} facets with anionic oxygen can promote the efficient adsorption of cationic dyes RhB, which can substantially enhance the photosensitized degradation efficiency.
However, most of the reported synthesis methods of BiOCl are the hydrothermal or solvothermal methods at high temperature and pressure environments,19–21 which will tremendously increase the cost of production and limit the further application of products. Therefore, it is crucial to develop a simple and economical preparation method to expand the photo-response of BiOCl to visible light and improve its photocatalytic activity.
Many researches have revealed that the sensitization of semiconductors caused by adsorption of dye molecules plays a crucial role in broadening the visible light response.22 It is generally accepted that the photosensitization process involves the photoexcitation of dye molecules to produce excited states (dye*) and the subsequent electron injection from dye* into the conduction band of semiconductors.22,23 The dye photosensitized degradation efficiency mainly relies on the adsorption of colored dye molecules on semiconductors and the appropriate redox potentials between the excited dye* and the semiconductor.22 The essential problem of realizing high efficient photosensitization is to improve the light energy conversion efficiency, that to improve the electron transfer efficiency in dye photosensitization. The adsorption of dye sensitizer on the semiconductor can effectively promote electrons transfer.24 Much effort has been devoted to developing semiconductors with strong dye adsorption capacity. The research of RhB photosensitized BiOCl system has attracted much attention.10,12,15,25,26 Utilizing RhB photosensitization to expand the visible light response range of BiOCl is a convenient and effective method to improve its visible light catalytic activity. Exploring BiOCl with strong RhB adsorption capacity is the key to improving photosensitization efficiency.
The adsorption capacity of BiOCl largely depends on its microstructure and morphology. BiOCl photocatalysts with different controllable morphology are prepared, such as two-dimension (2D) nanosheets27,28 and nanoplates,29 three-dimension (3D) nano-flowers, and microspheres. The anisotropic layered structure leads to the tendency of BiOCl to grow 2D nanostructure, such as nanosheets/nanoplates. However, under the presence of special soft template solvents, the 2D nanostructures can assemble into 3D nanostructures. Bárdos et al. synthesized BiOCl photocatalysts with hierarchical microcrystalline structure applying different additives and solvothermal synthesis.30 Ding et al. synthesized BiOCl hierarchical microspheres assembled by nanosheets via a solvothermal method.21 In the process of synthesis, acetic acid, methanol, HCl solution, and concentrated ammonia solution are used. Wang et al. prepared porous BiOCl micro flowers constructed by ultrathin nanosheets by a solvothermal method using glycerol as solvent.19 Zhang et al. fabricated BiOCl nanoflowers by a solvothermal method using ethylene glycol as the solvent, and subsequent hydrolysis precipitation method, and HCl and Bi(NO3)3·5H2O as chlorine source and bismuth source.20 Li et al. fabricated BiOCl microspheres assembled from nanosheets by precipitation method at room temperature using ethanol as solvent, WCl6 and Bi(NO3)3·5H2O as chlorine source and bismuth source.31 Liu et al. obtained 3D flower-like BiOCl at room temperature using a mixed solvent consisting of ethylene glycol of 25 mL and water of 5 mL.32 Generally, 3D hierarchical microspheres are assembled from 2D nanosheets. These nanostructures possess larger specific surface area and shortened diffusion pathways, resulting in higher adsorption capacity and faster interfacial charge transfer.21 Therefore, this kind of 3D nanostructure is conducive to improving the efficiency of dye sensitization significantly, and further enhancing photocatalytic activity.
In the present work, a facile room-temperature hydrolysis method was developed to synthesize BiOCl hierarchical microsphere assembled from nanosheets with exposed {001} facets. The photocatalytic activities of the obtained samples were explored by using the decomposition of rhodamine B (RhB) under the irradiation of an white LED lamp and a xenon lamp (λ ≥ 420 nm). The resultant PEG-modified BiOCl samples exhibit excellent photocatalytic activities towards RhB degradation under visible light irradiation, which are mainly due to the self-photosensitized degradation of RhB dyes. Besides, singlet oxygen species from dye photosensitization are also responsible for pollutant degradation.
Experimental
Materials
Bismuth nitrate pentahydrate (Bi(NO3)3·5H2O, AR, 99%), potassium chloride (KCl, 99.5%) and polyethylene glycol (PEG, Mn = 2000), tryptophan (TRP, 98%), 1,4-benzoquinone (BQ, 97%), isopropanol (IPA, AR, 99.5%), rhodamine B (RhB, AR), methyl orange (MO, 96%), carbon tetrachloride (CCl4, 98%) were purchased from Shanghai Macklin Reagent Company. Nitro blue tetrazolium chloride (NBT, 98%) was obtained from Hefei Bomei Biotechnology Co., Ltd. 9,10-Diphenyl anthracene (DPA, 98%) was purchased from Shanghai Bide Pharmaceutical Technology Co., Ltd. Triethanolamine (TEOA, AR) was purchased from Aladdin Reagent (Shanghai) Co., Ltd. All the chemicals are used without further purification. The deionized water is self-made in the experiment.Preparation of BiOCl samples
BiOCl photocatalysts were prepared by using the hydrolysis method at room temperature. The specific preparation process is as follows. Firstly, a certain amount of PEG-2000 was dissolved in an appropriate amount of deionized water, then a certain amount of Bi(NO3)3·5H2O was added to the above solution. At ambient conditions, the mixture was stirred magnetically for about 60 min. Finally, the same stoichiometric amount of KCl aqueous solution as Bi(NO3)3·5H2O was mixed with the above mixture and kept stirring for 60 min. The molar ratios of PEG and Bi(NO3)3·5H2O (np/nb) are 0/1, 0.01/1, 0.03/1, 0.05/1, 0.07/1, 0.1/1, 0.2/1, 0.3/1, 0.5/1, and 0.7/1, respectively. The white powders were obtained by centrifugation, washing with deionized water to neutralize. Finally, the products were dried in a vacuum drying oven at 50 °C for 12 h. The obtained BiOCl samples were labelled as S0 (np/nb = 0), S0.01 (np/nb = 0.01), S0.03 (np/nb = 0.03), S0.05 (np/nb = 0.05), S0.07 (np/nb = 0.07), S0.1 (np/nb = 0.1), S0.3 (np/nb = 0.3), S0.5 (np/nb = 0.5), and S0.7 (np/nb = 0.7). Schematic of synthesis process is shown in Fig. 1a.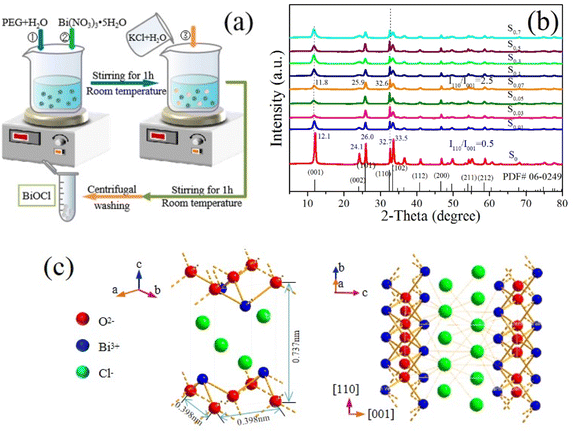 | ||
| Fig. 1 (a) Schematic of synthesis process, (b) XRD patterns of BiOCl samples and (c) simulated crystal structure diagram of the PEG-modified BiOCl. | ||
Characterization
The X-ray diffraction (XRD) patterns were recorded using a Rigaku Ultima IV X-ray diffractometer (Japan) (Cu-Kα radiation, λ = 1.5406 Å). Scanning electron microscopy (SEM) was determined by an XL-30 ESEM-FEG (FEI Company). The energy dispersive spectroscopy (EDS) and dot mapping images were obtained using an Oxford Instruments X-Max. Transmission electron microscopy (TEM) and high-resolution transmission electron microscopy (HRTEM) images were conducted using an FEI TECNAI F20 S-TWIN. The acceleration voltage is 200 kV. A Nicolet iS5 spectrometer was applied to test Fourier transform infrared (FT-IR) spectra of samples. X-ray photoelectron spectroscopy (XPS) was used to analyze electronic states by using a Thermo ESCALAB 250. The ultraviolet-visible diffuse reflectance spectroscopy (UV-vis DRS) was recorded on a TU-1900 UV-vis spectrophotometer with the reference of BaSO4. Brunauer–Emmett–Teller (BET) surface areas were carried out using nitrogen adsorption apparatus (Micromeritics, ASAP 2020). A Bruker A300 EPR spectrometer was applied to obtain the electron paramagnetic resonance (EPR) spectra.Evaluation of photocatalytic activity
The photocatalytic activities of BiOCl samples are evaluated under different light source irradiation, including visible light provided by a white LED lamp (32 W) and a xenon lamp (λ ≥ 420 nm, 300 W) and indoor sunlight using RhB as a model water pollutant agent. Typically, the concentration of RhB solution is 10 mg L−1, and 15 mg catalyst powders was put to 30 mL RhB solution. During the photocatalytic reaction, within a certain interval, stop stirring and stand still for a period of time, absorb the supernatant and centrifuge to remove a small amount of suspended solids. Time dependent absorption spectra of RhB solution were monitored by using a UV-vis spectrophotometer. According to the relational expression D (%) = [(C0 − C)/C0] × 100% = [(A0 − A)/A0] × 100%, the degradation rate (D) of RhB can be obtained. Wherein, A0, A, C0, and C represent the absorbance and the concentration of RhB at the initial time and at a certain reaction time, respectively.Detection of photocatalytic reactive species
To determine the main active species produced in the photocatalytic reaction, the effects of hydroxyl radical (˙OH), singlet oxygen (1O2), superoxide radical (˙O2−), and hole (h+) in the photocatalytic degradation reaction were studied employing four radical scavengers such as isopropanol (IPA), tryptophan (TRP), 1,4-benzoquinone (BQ)33 and triethanolamine (TEOA).34 15 mg of photocatalyst and 0.1 mmol of different scavengers were placed into 30 mL of RhB solution.In addition, the ˙O2− content in the system was semi-quantitatively analyzed using nitro-tetrazolium chloride blue (NBT, 0.025 mM) as the scavenger of ˙O2−. The yields of ˙O2− in the process of photocatalytic reaction were indirectly obtained by measuring the concentration of the NBT on a UV-vis spectrophotometer.33 The characteristic absorption peak of NBT molecule is at about 259 nm.
The singlet oxygen active species produced in photosensitization were verified by using a DPA capture agent.35 Specifically, DPA–CCl4 solution with a concentration of 1.936 × 10⁻⁴ mol L−1 and RhB aqueous solution with a concentration of 10 mg L−1 is poured into a beaker in turn in equal volume to form a heterogeneous capture system, respectively. Then the mixture is placed under LED irradiation with magnetic stirring. The absorbance value at 375 nm of DPA in the organic phase is measured by a UV-vis spectrophotometer every specific certain time. The reduced amount of DPA is calculated according to the absorbance reduction value.
Results and discussion
Characterization
The crystallinity and phase purity of the samples were confirmed by XRD analysis. XRD patterns of the samples are exhibited in Fig. 1b. Clearly, for sample S0, the diffraction peaks are located at around 12.1°, 24.1°, 26.0°, 32.7°, and 33.5°, which are well indexed to (001), (002), (101), (110), and (102) planes of the tetragonal phase of BiOCl with the lattice parameters of a = b = 0.389 nm and c = 0.737 nm (JCPDS no. 06-0249). However, for the PEG-modified samples S0.01, S0.03, S0.05, S0.07, S0.1, S0.3, S0.5, and S0.7, their diffraction peaks have slight blue shifts, the intensities become weaker. The full width at half-maximum (FWHM) of diffraction peak becomes wider significantly, which is due to hierarchical microsphere structures assembled with thinner nanosheets, which is consistent with the SEM images. According to the Scherrer formula D = Kλ/β![[thin space (1/6-em)]](https://www.rsc.org/images/entities/char_2009.gif) cos
cos![[thin space (1/6-em)]](https://www.rsc.org/images/entities/char_2009.gif) θ, the reduction of nanosheet thickness can cause the diffraction peaks to move to a low angle and the FWHM to increase. This phenomenon shows that PEG plays an essential role in the nucleation and growth of BiOCl. No characteristic peaks of any other phases and impurities are observed, indicating the high purity of the samples. It is worth noting that, the broad and weak (001) diffraction peaks suggest that the samples have a high exposure ratio of {001} crystal plane.36 Moreover, the intensity ratios of the diffraction peaks of the (110) plane and the (001) plane for all the PEG-modified samples are significantly higher than the corresponding peaks in sample S0. The ratio of I110/I001 has been marked in Fig. 1b. It indicates that the PEG-modified BiOCl samples preferably grow along the [110] orientations that are perpendicular to the c axis,32 while presenting a thin state along the [001] direction. The exposed {001} facets may lead to the generation of surface defect states, such as oxygen vacancies and chlorine vacancy. The existence of surface defect states makes BiOCl has more active sites, resulting in the higher adsorption capacity, which is conducive to improving the dye photosensitization. The simulated crystal structure diagram of the PEG-modified BiOCl was indicated in Fig. 1c. Schematic illustration of BiOCl unit cell shows that BiOCl crystal has lamellar structure. The cell parameters of tetragonal BiOCl are a = b = 0.389 nm, c = 0.737 nm. The crystal character along the [110] orientation may lead to more exposed {001} facets, resulting in the generation surface defects.
θ, the reduction of nanosheet thickness can cause the diffraction peaks to move to a low angle and the FWHM to increase. This phenomenon shows that PEG plays an essential role in the nucleation and growth of BiOCl. No characteristic peaks of any other phases and impurities are observed, indicating the high purity of the samples. It is worth noting that, the broad and weak (001) diffraction peaks suggest that the samples have a high exposure ratio of {001} crystal plane.36 Moreover, the intensity ratios of the diffraction peaks of the (110) plane and the (001) plane for all the PEG-modified samples are significantly higher than the corresponding peaks in sample S0. The ratio of I110/I001 has been marked in Fig. 1b. It indicates that the PEG-modified BiOCl samples preferably grow along the [110] orientations that are perpendicular to the c axis,32 while presenting a thin state along the [001] direction. The exposed {001} facets may lead to the generation of surface defect states, such as oxygen vacancies and chlorine vacancy. The existence of surface defect states makes BiOCl has more active sites, resulting in the higher adsorption capacity, which is conducive to improving the dye photosensitization. The simulated crystal structure diagram of the PEG-modified BiOCl was indicated in Fig. 1c. Schematic illustration of BiOCl unit cell shows that BiOCl crystal has lamellar structure. The cell parameters of tetragonal BiOCl are a = b = 0.389 nm, c = 0.737 nm. The crystal character along the [110] orientation may lead to more exposed {001} facets, resulting in the generation surface defects.
SEM images of the samples S0, S0.01, S0.03, S0.05, S0.1, S0.3, S0.5, and S0.7 modified with different PEG amounts were presented in Fig. 2. One can observe from Fig. 2a that the sample S0 without PEG is mainly composed of nanosheets. Most nanosheets are in a dispersed state, and there are also some stacking phenomena. Fig. 2b shows the SEM image of sample S0.01. Some irregular spherical structures have formed. Of course, there are still nanoflake structures. It indicates that when the molar ratio of PEG to Bi(NO3)3 is 0.01, BiOCl nanoflakes can be partially assembled into microspheres. However, the formed microsphere structure is very irregular due to the low amount of PEG. When the molar ratios of PEG to Bi(NO3)3 are 0.03, 0.05, and 0.1, the number of microspheres increases significantly, and the microsphere structures are compact and complete. Moreover, the particle size distribution tends to be uniform, as shown in Fig. 2c–e. In addition, a small number of irregularly arranged nanosheets are also observed. However, with the further increase in PEG dosage, the number of regular microsphere structures decreased, as indicated in Fig. 2f–h. The samples S0.3, S0.5, and S0.7 in Fig. 2f–h are obtained at the molar ratios of 0.3, 0.5, and 0.7 of PEG to Bi(NO3)3. In particular, when the molar ratio of PEG to Bi(NO3)3 increases to 0.7, the number of intact microsphere structures is significantly decreased, and the aggregation is obvious. This phenomenon shows that in the synthesis process of BiOCl, the excessive amount of PEG affects the assembly of BiOCl nanosheets into microsphere structures.
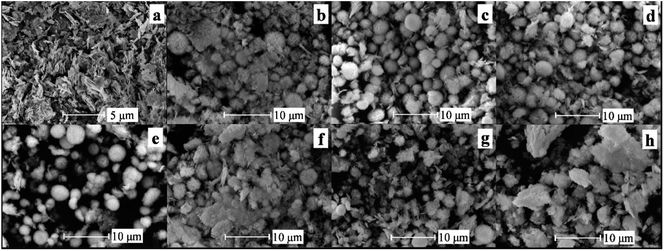 | ||
| Fig. 2 SEM images of samples S0 (a), S0.01 (b), S0.03 (c), S0.05 (d), S0.1 (e), S0.3 (f), S0.5 (g), and S0.7 (h). | ||
When the molar ratio of PEG to Bi(NO3)3 increases to 0.07, the regularity and homogeneity of the formed microspheres are the best, and the detailed study of micromorphology of S0.07 is further shown in Fig. 3. Fig. 3a presents a high-magnification SEM image of sample S0. We can observe that sample S0 consists of nanosheets with a thickness of about 20 nm and a width range of 100 nm–1 μm. Fig. 3b shows that in the low-magnification SEM image of sample S0.07, many microspheres are observed except for a small number of hemispheric structures and nanosheets. The inset in Fig. 3b shows a histogram of the particle size distribution of the microsphere. The mean particle size is 2.53 μm. From the high-magnification images of S0.07 in Fig. 3c–f, we can observe that this kind of microsphere is regularly assembled from nanosheets with a width of hundreds of nanometers and a thickness of about 10 nm. All the nanosheets are staggered regularly and tightly to form hierarchical microspheres. The formation of the hierarchical microsphere structure is mainly due to the addition of polyethylene glycol in the synthesis reaction. As a kind of surfactant and complexing agent, polyethylene glycol plays an essential role in dispersing and controlling morphology. Besides, one can find that there are a small number of hemispheric structures in Fig. 3b, and their high-magnification images observed from different angles are presented in Fig. 3e and f. Fig. 3e and f show that the nanosheets are arranged parallel to the cross-section at the cross-section of the microspheres. The formation of hemispheres may come from the splitting caused by stirring. Another possible reason is that the hemispherical structure may form due to uneven stirring. The unique hierarchical microspheres constructed by the staggered arrangement of nanosheets not only significantly improve the mass transfer of pollutant molecules but also tremendously restrain the aggregation of BiOCl nanosheets, which is beneficial to providing rich active sites. Moreover, compared with the nanosheet structures, the hierarchical microsphere structures possess stronger adsorption capacity, thus exhibiting better dye-sensitized photocatalytic degradation activity.
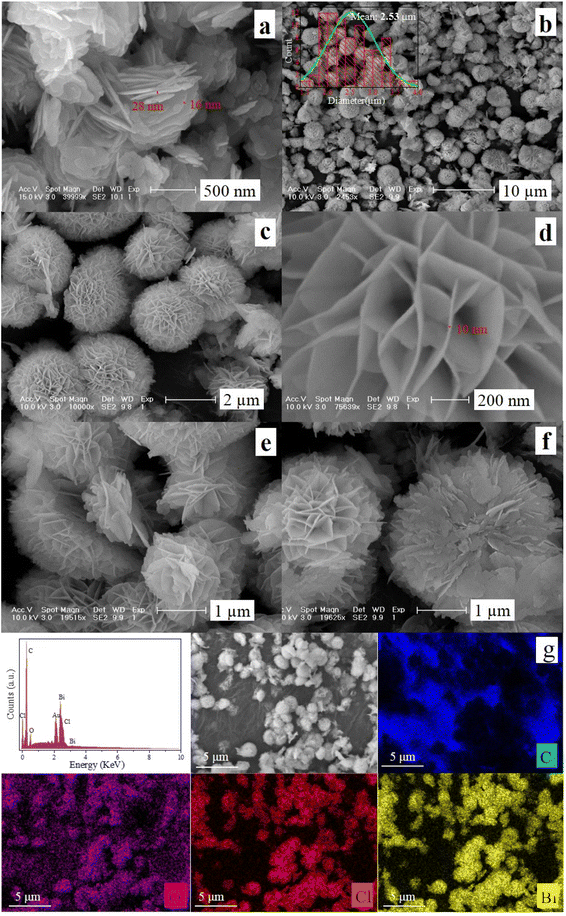 | ||
| Fig. 3 SEM images of samples (a) S0 and (b–f) S0.07, (g) EDS spectrum and dot mapping images of S0.07 (the inset in (b) is the histogram of the diameter distribution of microspheres). | ||
To study the surface chemical composition and distribution of elements on the surface of sample S0.07, the EDS spectrum and EDS mapping images are displayed in Fig. 3g. We can observe that the sample was composed of C, Bi, O, and Cl elements. The carbon element mainly comes from the conductive adhesive used for testing except that a small proportion comes from PEG on the surface of the sample. The mapping images show Bi, O, and Cl elements are uniformly distributed.
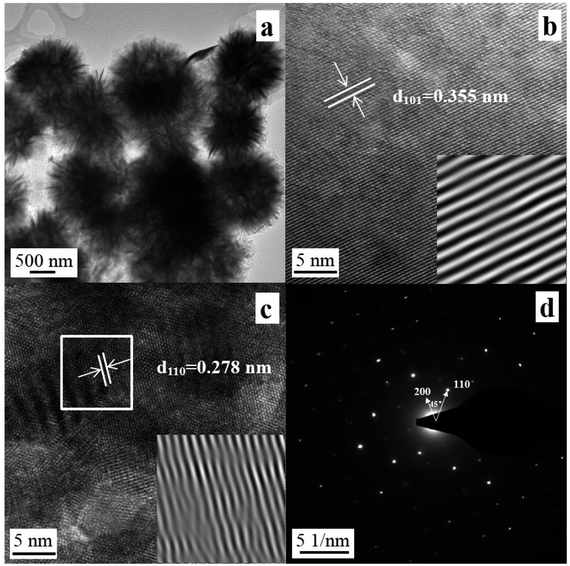
The microstructure of sample S0.07 was confirmed by TEM. One can find that from Fig. 4a the average diameter of the hierarchical microsphere is about 1–2 μm. The nanosheets that assembled the microspheres are very thin and appear to be transparent in the TEM image. The sample S0.07 was further investigated by HRTEM. Fig. 4b and c exhibit good crystalline and clear lattice fringes. The continuous lattice fringes with an interplanar lattice spacing of 0.355 nm are observed in Fig. 4b, which is consistent with the d-spacing of the [101] reflection (0.344 nm). Fig. 4c displays the lattice fringes with an interplanar spacing of 0.278 nm, which is identical to the d-spacing of the [110] reflection (0.275 nm). In addition, the dislocation defects on the sample surface are found in lattice fringes in Fig. 4c. The corresponding selected area electron diffraction (SAED) pattern is depicted in Fig. 4d, and a spot pattern reveals the single-crystal natures of the nanosheets in the microsphere. The angle of adjacent spots labeled in the SAED pattern is 45°, which is identical to the theoretical value of the angle between the (110) and (200) planed of tetragonal BiOCl.
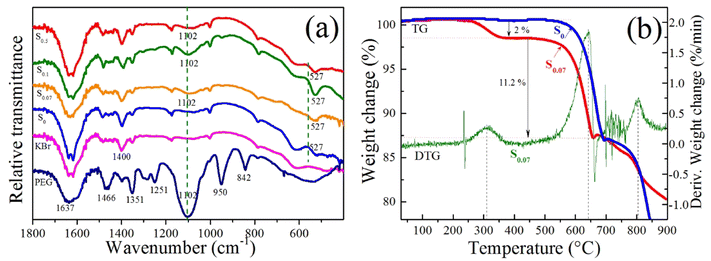
To verify the PEG content on the surface of BiOCl samples, FTIR spectra and TG analysis of some typical samples were conducted, as presented in Fig. 5. FTIR spectra of PEG, S0, S0.07, S0.1, and S0.5 were shown in Fig. 5a. From Fig. 5a, the strong absorption peaks at 1637 cm−1 and the peaks at 1300–1500 cm−1 come from the bending vibration of the hydroxyl group in adsorbed water. The absorption peak at 1466 cm−1 comes from the bending vibration of CH2 in polyethylene glycol. The absorption peaks at 1251 cm−1 and 1351 cm−1 come from the bending vibration of hydroxyl in polyethylene glycol. The absorption peak at 1102 cm−1 comes from the stretching vibration of C–O–C of polyethylene glycol, which is the most typical characteristic peak of polyethylene glycol. The absorption peaks at 950 cm−1 and 842 cm−1 belong to the stretching vibration mode of C–OH and the in-plane rocking vibration mode of CH2 in polyethylene glycol. For the samples S0.07, S0.1, and S0.5, we can observe the absorption peaks at 1102 cm−1, but no absorption peak at 1102 cm−1 for S0 and pure KBr. It indicates that the samples S0.07, S0.1, and S0.5 contain a small amount of PEG. For samples S0, S0.07, S0.1, and S0.5, the absorption peaks at 527 cm−1 belong to the stretching vibration of Bi–O in BiOCl.37
Fig. 5b presents TG curves of S0 and S0.07 and the DTG curve of S0.07. We can see from the TG curve that sample S0.07 shows three mass loss stages. The thermogravimetric analysis of sample S0.07 is described by combining TG and DTG curves. The temperature range of weight loss in the first stage is 250–360 °C, the weight change is maximum at 310 °C, and the weight change rate in this stage is 2%. The weight loss of S0.07 at this stage is mainly due to the decomposition of polyethylene glycol in sample. This indicates that the PEG content in sample S0.07 is about 2%. The weight loss of sample S0.07 in the second stage occurs at 530–650 °C. At 640 °C, the mass change rate reaches the maximum, that is, the decomposition rate is the fastest, and the weight change rate in this stage is 11.2%. The mass loss is mainly due to the decomposition of bismuth oxychloride to form Bi4O5Cl2. Then, with the increase in temperature, the weight loss in the third stage occurs. The weight change rate reaches the maximum at 810 °C. The weight change in this stage is 6.5%, mainly due to the further decomposition of Bi4O5Cl2 to form Bi4OCl2, Bi2O3, and BiCl3. However, the S0 sample has no weight loss in the range of 250–360 °C, and the weight loss begins at 550 °C. The weight-loss trend after 550 °C is similar to that of sample S0.07.
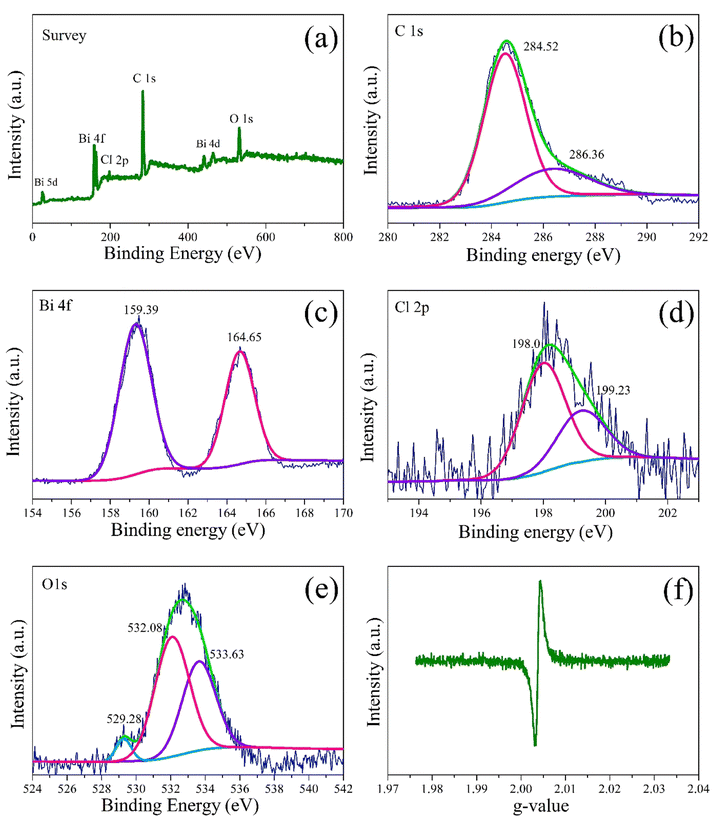
The elemental composition and atomic valence state of the S0.07 sample were analyzed by XPS, as presented in Fig. 6. The full spectrum in Fig. 6a reveals that the sample is composed of elements of C, Bi, O, and Cl, and no other impurity is found, indicating that the synthesized sample S0.07 is relatively pure. The high-resolution C 1s orbitals of sample S0.07 is presented in Fig. 6b. The peak centered at the binding energy of 284.52 eV is a signal derived from accidental hydrocarbons in the XPS instrument itself. The peak centered at 286.36 eV originate from carbon element of PEG on the surface of BiOCl. The high-resolution Bi 4f orbitals is presented in Fig. 6c. The peaks centered at 159.39 eV and 164.65 eV are indexed to Bi 4f7/2 and Bi 4f5/2 of Bi3+.38 The high-resolution of Cl 2p orbitals is indicated in Fig. 6d. The Cl 2p spectrum could be resolved into two peaks. The Cl 2p peaks at 198.0 eV and 199.23 eV correspond to Cl 2p3/2 and Cl 2p1/2, respectively. The high-resolution O 1s is presented in Fig. 6e. The O 1s spectrum could be well fitted separately into three peaks, which are centered at 529.28 eV, 532.08 eV, and 533.63 eV.32 The O 1s peak at 529.28 eV is assigned to lattice oxygen species from Bi–O bond in BiOCl and the peak at 533.63 eV should originate from the absorbed hydroxyl groups (OH)32 and ether groups (C–O–C) of PEG. The O 1s peak at 532.08 eV is due to the presence of oxygen vacancy.32 The surface atomic ratio of S0.07 by XPS analysis is given as Bi 4f![[thin space (1/6-em)]](https://www.rsc.org/images/entities/char_2009.gif) :
:![[thin space (1/6-em)]](https://www.rsc.org/images/entities/char_2009.gif) Cl 2p
Cl 2p![[thin space (1/6-em)]](https://www.rsc.org/images/entities/char_2009.gif) :
:![[thin space (1/6-em)]](https://www.rsc.org/images/entities/char_2009.gif) O 1s = 7
O 1s = 7![[thin space (1/6-em)]](https://www.rsc.org/images/entities/char_2009.gif) :
:![[thin space (1/6-em)]](https://www.rsc.org/images/entities/char_2009.gif) 7.09
7.09![[thin space (1/6-em)]](https://www.rsc.org/images/entities/char_2009.gif) :
:![[thin space (1/6-em)]](https://www.rsc.org/images/entities/char_2009.gif) 85.91.
85.91.
To more intuitively reveal oxygen vacancies in the sample S0.07, ambient temperature EPR spectrum is presented in Fig. 6f. The sample S0.07 indicates strong signal peak at g = 2.003, which could be regarded as the electrons trapped in oxygen vacancy.38 The molecular O2 was more favorably adsorbed and activated on surface oxygen vacancies via one-electron transfer to form monoatomic oxygen ions (O−).18 The negative {001} facets can promote the efficient adsorption of cationic RhB, which can substantially enhance the photosensitized degradation efficiency.
The study of the optical absorption characteristics of semiconductors is helpful to clarify the photocatalytic mechanisms. Generally, the optical properties of powder samples are measured by an integrating sphere attachment of UV-vis spectrophotometer. The obtained diffuse reflection spectrum is based on the principle of diffuse reflection. Fig. 7a presented the UV-vis diffuse reflection spectra of the typical samples S0, S0.01, S0.03, S0.05, and S0.07. In the visible light region of 360–500 nm, the reflectivity of these samples is about 85–95%, indicating that there is little absorption in the visible light region. The UV-vis absorption spectra of samples S0, S0.01, S0.03, S0.05, and S0.07 were also obtained, as shown in Fig. 7b. We can see that the light absorption edges of all the samples are located approximately 361–368 nm, which displays the absorption behavior of the broad bandgap semiconductor. In addition, the plot curves of (ahv)1/2 versus photon energy (hv) of samples were also given in Fig. 7c. It is generally believed that the optical absorption of the semiconductor follows the formula (ahν)2/n = A(hν − Eg), where a, h, ν, Eg, and A represent the absorption coefficient, Planck's constant, light frequency, bandgap energy, and a constant, respectively.39 The n is decided by the characteristics of the transition in a semiconductor. For the direct transition and the indirect transition, the n values are 1 and 4, respectively. Because of the indirect transition characteristic for BiOCl, its n value is 4.39 By linearly fitting the (ahv)1/2 vs. (hv) curve, the bandgap values of samples S0, S0.01, S0.03, S0.05, and S0.07 are located in the range of 3.26–3.36 eV, as shown in Fig. 7c. The bandgap energies of S0 and S0.07 are 3.36 eV and 3.26 eV. Based on the bandgap analysis, we can conclude that all the samples have little absorption of visible light. The subsequent photocatalytic experiments results show that the samples have high visible-light photocatalytic activity for RhB, which is mainly due to the photosensitization of dyes and the existence of oxygen vacancies.
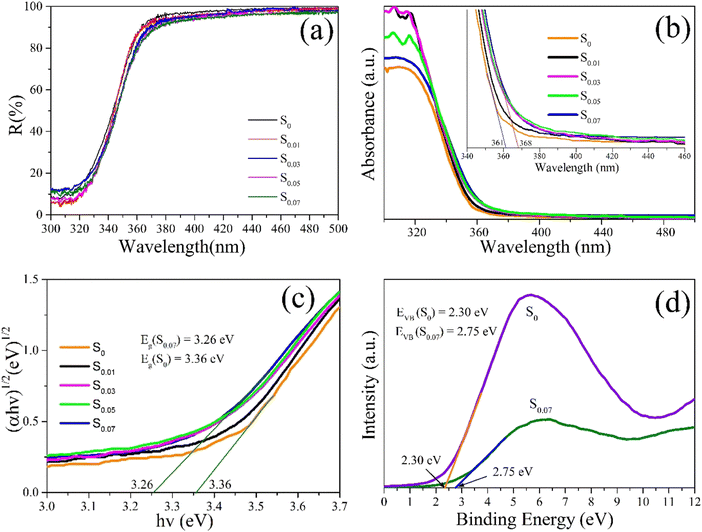 | ||
| Fig. 7 (a) UV-vis diffuse reflectance spectra, (b) UV-vis absorption spectra, (c) the plot of (ahv)1/2 versus the energy (hv) and (d) VB-XPS spectra. | ||
The band structure of semiconductors is the key factor affecting the generation and migration of carriers. Valence band spectra of XPS (VB-XPS) of S0 and S0.07 are obtained by using X-ray photoelectron spectra (XPS), as indicated in Fig. 7d. The potential energies of valence bands of S0 and S0.07 are as follows: EVB (S0) = 2.30 eV, EVB (S0.07) = 2.75 eV. Based on the DRS results and the formula: ECB = EVB − Eg, the potential energies of conduction bands (ECB) of S0 and S0.07 are obtained, ECB (S0) = −1.06 eV, ECB (S0.07) = −0.51 eV. It seems that BiOCl samples S0 and S0.07 have the favorable redox potentials for the degradation of organic pollution, which contributes to their outstanding UV catalytic activity.
The BET-specific surface areas of S0 and S0.07 samples were measured as 7.30 m2 g−1 and 26.6 m2 g−1, respectively, as indicated in Fig. 8a. The sample S0.07 has a larger BET-specific surface area than S0, which is ascribed to the particular hierarchical microsphere structure assembled from nanosheets of S0.07. The pore size distribution curves of S0 and S0.07 in shown in Fig. 8b. It can be seen that the sample S0.07 possess a large number of micropores, followed by mesopores. The sample S0 has a small amount of micropores and mesopores.
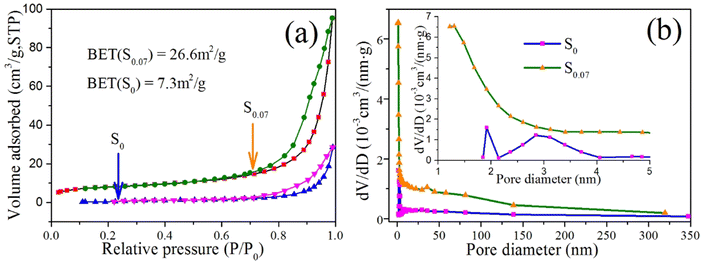 | ||
| Fig. 8 (a) N2 adsorption–desorption isotherms (surface area inset) and (b) the pore size distribution curves of S0 and S0.07 samples. | ||
Photocatalytic activity
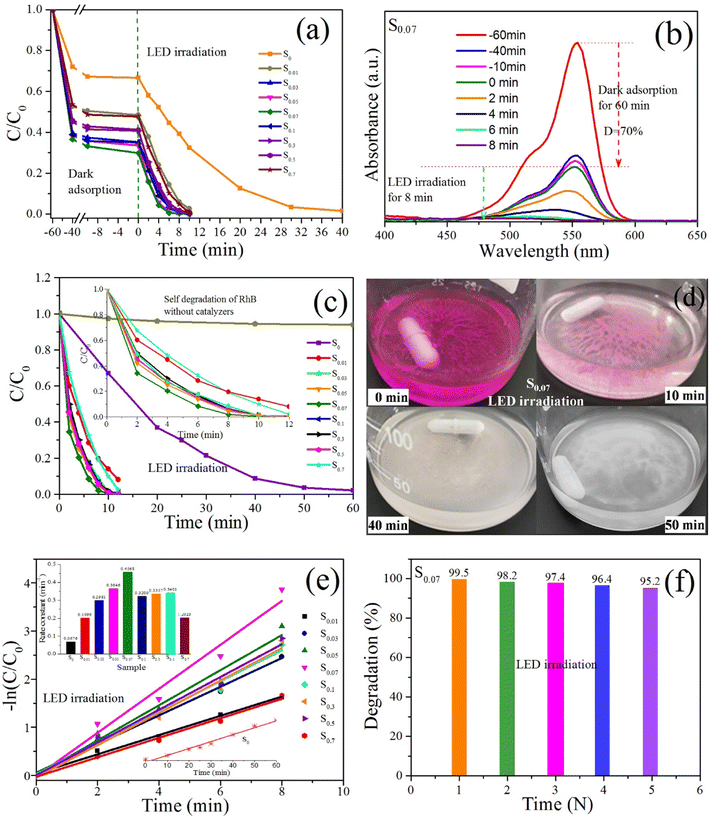
The photocatalytic behaviors of the obtained samples were evaluated under different light source irradiation, including visible light provided by the white LED lamp (32 W), xenon lamp (λ ≥ 420 nm, 300 W) and indoor sunlight using RhB as a target degradation in aqueous solution.Fig. 9a shows the time-resolved degradation of RhB with various BiOCl samples under dark and LED-irradiation conditions. Before LED irradiation, the RhB solution with sample is magnetically stirred for 5 minutes and still in the dark for 55 minutes. The absorbance of the RhB solution is detected at regular intervals. As shown in Fig. 9a, after the dark adsorption for 20 min, the concentration of the RhB solution decreases significantly. Then the concentration of the solution tends to decrease slowly, and after 60 min, the equilibrium of adsorption and desorption is completed. The adsorption degradation rates of the RhB solutions with the samples S0, S0.01, S0.03, S0.05, S0.07, S0.1, S0.3, S0.5, and S0.7 reach 33.4%, 51.6%, 64.9%, 66.5%, 70.2%, 65.0%, 59.3%, 58.8%, and 52.3%, respectively. The adsorption degradation rate of sample S0 is the lowest, and that of sample S0.07 is the highest, indicating that the PEG-modified BiOCl samples have superior adsorption capacity of RhB dye. The PEG-modified BiOCl samples possess a high proportion of exposed {001} crystal planes, which leads to the formation of surface defects of samples. XPS spectra have proved the existence of oxygen vacancies on the surface of the sample S0.07. The surface defects formed by exposed {001} crystal planes may have negative charges. The strong adsorption of RhB on the sample S0.07 may be due to the electrostatic interaction between the {001} crystal planes with negative charges and = N+–(CH2CH3)2 in cationic RhB.40 In addition, PEG-modified BiOCl with hierarchical microsphere structures has a large specific surface area. Fig. 8 shows that the BET of S0.07 is 26.6 m2 g−1, which is much larger than that of S0 (7.3 m2 g−1). The large specific surface area can provide more active sites for the adsorption of RhB. The synergistic effect of the electrostatic adsorption and hierarchical microsphere structure leads to the super adsorption of RhB on the surface of BiOCl, and tremendously promotes the photosensitization degradation of RhB dye by BiOCl.
When the reaction system with stirring is exposed to a LED lamp of 32 W, the concentration for all the RhB solutions decreases significantly. After 8 min LED irradiation, the photocatalytic degradation rates of RhB solutions with S0, S0.01, S0.03, S0.05, S0.07, S0.1, S0.3, S0.5, and S0.7 are 60.8%, 94.1%, 99.4%, 99.7%, 99.7%, 98.9%, 98.8%, 98.2%, and 95.2%, respectively. Quite evidently, the degradation efficiency of S0.03, S0.05, S0.07, S0.1, and S0.3 over RhB solution can reach up to 100%. By contrast, the photocatalytic efficiency of S0 is the lowest, and the degradation rate can reach up to 96.7% after 30 min LED irradiation. Time-resolved degradation curves of RhB indicate the PEG-modified BiOCl samples have outstanding photocatalytic activity under LED irradiation.
Fig. 9b shows the temporal UV-vis absorption spectral changes of the RhB solution with S0.07 under dark and LED irradiation conditions. The adsorption degradation rate of RhB solution by S0.07 is about 70% in the dark for 60 min. During the dark adsorption, the maximum absorption wavelength of RhB maintains at 554 nm. Under LED irradiation, the maximum absorption wavelength appears blue-shifted with the degradation of RhB. This phenomenon indicates that ethyl can disengage from N atoms and form a series of degrading intermediates in photochemical reactions. When the four ethyl groups on RhB are completely disengaged from N atoms, the color of RhB changes from red to green, and when RhB is completely degraded, the color becomes colorless.
Fig. 9c presents the time-resolved degradation of RhB with various BiOCl samples under direct LED irradiation without pre-absorption. The self-degradation curve of RhB without catalysts under LED irradiation is also given. After 60 min irradiation, only slight degradation occurred, which may be due to singlet oxygen produced by dye sensitization. This has been confirmed in the subsequent experimental studies. The degradation rate of RhB by S0 is only 33% after LED irradiation of 10 min and completely degraded after 60 min. By comparison, in the presence of samples S0.01, S0.03, S0.05, S0.07, S0.1, S0.3, S0.5, and S0.7, after LED irradiation of 10 min, the degradation rates of RhB could reach up to 86.1%, 98.6%, 98.7%, 99.5%, 99.0%, 98.4%, 99.2%, and 90.0%, respectively. The sample S0.07 shows the best photocatalytic degradation efficiency, which is consistent with the results obtained in the pre-absorption before LED irradiation conditions (Fig. 9a). By comparing Fig. 9a and c, we can conclude that pre-adsorption in the dark between catalysts and RhB molecules is advantageous to the degradation of RhB. However, it is not comprehensive to determine that RhB molecules have been fully degraded only by the degradation rate results obtained from the absorbance test of RhB solution. When a catalyst has strong adsorption on the dye molecules, the dyes can be adsorbed on the surface of the catalyst. At this time the absorbance of the solution can be greatly reduced, resulting in an illusion that dyes have been degraded. However, under the above irradiation conditions (32 W LED), when RhB solution begins to turn colorless, the RhB molecules are not completely degraded, but partially adsorbed on the surface of the catalyst powder. It is noteworthy that the strong adsorption of the BiOCl sample to RhB molecules does not inhibit its photocatalytic degradation efficiency for RhB. On the contrary, strong adsorption promotes the photocatalytic degradation of RhB dyes. This is mainly because the photosensitization of RhB dye plays a leading role for the photocatalytic degradation of RhB. Moreover, strong adsorption is the premise of high-efficiency dye photosensitization.
The promoting effect of adsorption on photocatalysis is confirmed by the color change of solution and catalyst powders during the photocatalytic reaction, as indicated in Fig. 9d. When the RhB solution becomes colorless, the dye molecules adsorbed by the catalyst powders are not completely degraded, which is mainly ascribed to the weak intensity of the irradiation light source. If the light intensity increases, the dye molecules adsorbed on catalyst powders will be degraded rapidly, which has been confirmed in the subsequent photocatalytic degradation experiment with a xenon lamp as the light source (Fig. 10a). Fig. 9d presents the color change process of the photocatalytic reaction system with sample S0.07 under direct LED irradiation. In the process of the experiment, we observed that when RhB solution and catalyst powders are mixed, the catalyst powders quickly turn pink, indicating that RhB molecules are quickly adsorbed to the surface of catalysts (0 min in Fig. 9d). At this time, the decrease in solution absorbance is ascribed to the adsorption of RhB molecules on catalyst surfaces. After 10 min of LED irradiation, the RhB solution becomes colorless, and the catalyst powders turn light pink, which manifests that RhB molecules dispersed in the solution and adsorbed on the catalyst powders have been significantly degraded (10 min in Fig. 9d). When LED irradiation continues for 40 min, the catalyst powders become almost colorless and completely become colorless after 50 min (50 min in Fig. 9d).
The degradation of RhB with various BiOCl samples under LED irradiation could be fitted as the pseudo-first-order kinetics model in Fig. 9e. The rate constants of S0, S0.01, S0.03, S0.05, S0.07, S0.1, S0.3, S0.5, and S0.7 are 0.0676, 0.1999, 0.2981, 0.3646, 0.4568, 0.3209, 0.3357, 0.3401, 0.2023 min−1, respectively (the inset). From S0 to S0.07, the rate constants increase gradually, and the rate constant corresponding to S0.07 is 6.76 times that of S0. Compared with S0.07, the rate constants corresponding to S0.1, S0.3, S0.5, and S0.7 decrease. For S0.1, S0.3, and S0.5, the rate constants are close, and for S0.7, the rate constant shows a substantial decline. The comparison of the rate constants further confirms that sample S0.07 has the best photocatalytic degradation efficiency. These results indicate that the influence of PEG dosage on the photocatalytic activity of BiOCl sample. The higher rate constant of S0.07 than other samples is likely attributed to the hierarchical microsphere structure, large specific surface area and the exposed {001} facet. To normalize the effect of specific surface area, the rate constants per unit area of S0.07 and S0 were further calculated, marked as kA. The kA value of S0.07 (0.01717 g min−1 m−2) is still higher than S0 (0.00926 g min−1 m−2), manifesting the intrinsic prominent photocatalytic activity of S0.07 other than the higher specific surface area. Therefore, the intrinsic prominent photocatalytic activity is mainly derived from the hierarchical microsphere structure assembled from ultrathin nanosheets and the exposed {001} facets.
Fig. 9f presents the degradation rate histogram of the cycle photocatalytic experiment of sample S0.07 to RhB under direct LED irradiation without pre-absorption. The photocatalytic reaction time is 10 min. As can be seen that under LED radiation, after five cycles of photocatalytic degradation experiment, the degradation rate of RhB decreases slightly, which is related to the loss of samples during the absorbance test. The cyclic photocatalytic experiment demonstrates that sample S0.07 has excellent photocatalytic stability.
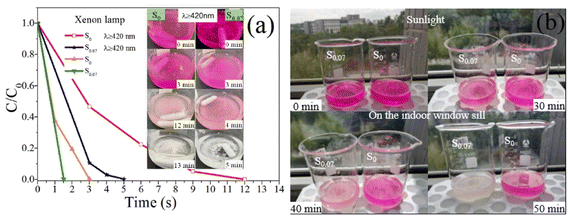
In most literature reports, the photocatalytic experiment takes a xenon lamp as the light source. To facilitate the comparison with relevant literature, the photocatalytic degradation characteristics of RhB with samples S0 and S0.07 are studied under the irradiation of a 300 W xenon lamp. The time-resolved degradation curves and the color change process of RhB with S0 and S0.07 are shown in Fig. 10a.
Under the irradiation of xenon lamp with 420 nm cut-off filter, after 4 minutes, the degradation rate of RhB solution with S0.07 is almost 100%, except that catalyst powders are still pink. After 5 minutes, the catalyst powders become colorless. While for RhB solution with S0, after irradiation of 12 minutes, the RhB solution becomes colorless, and after another 1 min, the catalyst powders become colorless. It is very clear that, when a xenon lamp is used as the light source, the photocatalytic degradation efficiency is significantly higher. The main reason is that the photocatalytic degradation rate is greatly affected by light intensity. The light intensity of the 300 W xenon lamp is 206![[thin space (1/6-em)]](https://www.rsc.org/images/entities/char_2009.gif) 000 Lux, while the light intensity of the 32 W LED lamp is only 14
000 Lux, while the light intensity of the 32 W LED lamp is only 14![[thin space (1/6-em)]](https://www.rsc.org/images/entities/char_2009.gif) 800 Lux. When the light intensity is large enough, the dye molecules adsorbed on the catalyst surface and dispersed in the solution can be both degraded. Comparison of RhB degradation over various BiOCl-based photocatalysts is indicated in Table 1. It is obvious by comparison that the photocatalyst prepared by our group has much better photocatalytic activity for RhB. Moreover, our preparation method is simple, energy-saving and environment-friendly, without using ethanol, ethylene glycol and other solvents, and without high temperature and pressure.
800 Lux. When the light intensity is large enough, the dye molecules adsorbed on the catalyst surface and dispersed in the solution can be both degraded. Comparison of RhB degradation over various BiOCl-based photocatalysts is indicated in Table 1. It is obvious by comparison that the photocatalyst prepared by our group has much better photocatalytic activity for RhB. Moreover, our preparation method is simple, energy-saving and environment-friendly, without using ethanol, ethylene glycol and other solvents, and without high temperature and pressure.
| No. | Catalyst | Illumination | C0 of RhB (mg L−1) | C of catalyst (g L−1) | Synthetic method | Removal rate of RhB | Rate constant (min−1) | Ref. |
|---|---|---|---|---|---|---|---|---|
| 1 | BiPO4/BiOCl (P-BOC-6) | 350 W Xe lamp (λ ≥ 420 nm) | 20 | 0.3 | Solvothermal method (160 °C, 12 h, 40 mL EG) | 98% in 30 min | 0.1260 | — |
| 2 | Bi2O2CO3/BiOCl | 500 W Xe lamp (λ ≥ 420 nm) | 10 | 0.5 | Solvothermal method (180 °C, 12 h, 70 mL ethanol) | 98% in 12 min | — | 12 |
| 3 | BiOCl nanoflowers | 500 W Xe lamp (λ ≥ 420 nm) | 20 | 0.5 | Solvothermal method (200 °C, 30 min, 32 mL EG) | 99% in 60 min | 0.0452 | 20 |
| 4 | BiOCl-25 nanoflowers | 500 W Xe lamp (λ ≥ 420 nm) | 15 | 0.3 | Room temperature hydrolysis (25 mL EG) | 100% in 50 min | 0.0530 | 32 |
| 5 | OV-BOC | 300 W Xe lamp (λ ≥ 400 nm) | 10![[thin space (1/6-em)]](https://www.rsc.org/images/entities/char_2009.gif) |
1.0 | Solvothermal method (160 °C, 16 h, 30 mL EG) | 92% in 60 min | 0.0446 | 33 |
| 6 | BiOCl microspheres (S0.07) | 300 W Xe lamp (λ ≥ 420 nm) | 10 | 0.5 | Room temperature hydrolysis (2 h, H2O) | 100% in 4 min | __ | This work |
| 32 W white LED lamp | 99.5% in 10 min | 0.4568 |
By comparison, under the irradiation of a xenon lamp without a cut-off filter (simulated sunlight), the RhB solutions with S0 and S0.07 can be degraded entirely after 3 minutes and 1.5 min, respectively. Meanwhile, the catalyst powders in the two solutions also become colorless. The photocatalytic activity of the as-prepared BiOCl catalysts under ultraviolet light is still higher than that under visible light.
Based on the consideration of the practical application environment of photocatalysts, the indoor windowsill sunlight is selected as the light source. It should be emphasized that the light source is the sunlight filtered by the ordinary transparent window glass. The photocatalytic degradation effects of the samples S0 and S0.07 to RhB have been monitored by tracking the color change process. However, the solar intensity is unstable, which makes it impossible to compare the research results with other literature. During irradiation, the change of sunlight intensity with time is regularly monitored, as shown in Table 2. Table 2 presents the sunlight intensity changes extensively, and the maximum intensity appears near the 30–40 min of photocatalytic reaction.
| Time intervals of irradiation per min | 0–10 | 10–20 | 20–30 | 30–40 | 40–50 |
| Light intensity ranges per Lux | 6515–13![[thin space (1/6-em)]](https://www.rsc.org/images/entities/char_2009.gif) 280 280 |
10![[thin space (1/6-em)]](https://www.rsc.org/images/entities/char_2009.gif) 270–26 270–26![[thin space (1/6-em)]](https://www.rsc.org/images/entities/char_2009.gif) 550 550 |
24![[thin space (1/6-em)]](https://www.rsc.org/images/entities/char_2009.gif) 260–7744 260–7744 |
31![[thin space (1/6-em)]](https://www.rsc.org/images/entities/char_2009.gif) 010–55 010–55![[thin space (1/6-em)]](https://www.rsc.org/images/entities/char_2009.gif) 170 170 |
10![[thin space (1/6-em)]](https://www.rsc.org/images/entities/char_2009.gif) 350–1546 350–1546 |
Fig. 10b shows the color change process of RhB solution with samples S0 and S0.07 under solar irradiation. When the catalyst powders are mixed with the RhB solution, the powders quickly adsorb RhB molecules and turn pink. When exposed to sunlight for 30 min, the color of RhB solutions catalyzed by both S0 and S0.07 become lighter, and the fading of RhB solution with S0.07 is more prominent. After sunlight irradiation of 50 min, RhB solution and catalyst powders in the beaker marked S0.07 become colorless ultimately. In contrast, the beaker marked S0 does not change significantly, indicating that the sample S0.07 has superior photocatalytic activity under sunlight compared with S0.
Photocatalytic mechanism
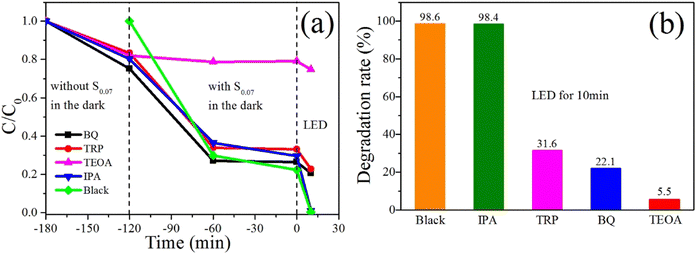
To identify the responsibility of the different active species for RhB degradation, radical scavenging experiments with sample S0.07 were conducted, as presented in Fig. 11. Due to the adsorption of sample S0.07 and scavengers on RhB, to more accurately study the effect of radical scavengers on the catalytic degradation of RhB by S0.07, various radical scavengers and sample S0.07 were added to RhB solutions in different periods, and the adsorption effect of RhB was studied in detail. The system was placed under LED irradiation after the equilibrium of adsorption and desorption for 120 min, and the photocatalytic degradation rates in the presence of different scavengers were detected.It can be seen from Fig. 11a that when the radical trapping agents are added to the reaction systems and stirred in the dark for 60 min, the concentration of RhB solution decreases by about 16.6%–24.7%. In addition, when BQ is used as the trapping agent, the concentration of RhB solution decreases the most (24.7%), indicating that BQ has the most significant adsorption effect on RhB. When the sample S0.07 was added to the above reaction system and stirred in the dark for 60 min, the concentration of RhB solution with BQ, TRP, and IPA decreased significantly, and the degradation rate reached 73%, 66.2%, and 63.5%. However, for the catalytic system with TEOA, the concentration of RhB solution did not decrease after stirring in the dark for 120 min, indicating that TEOA inhibited the adsorption of RhB molecule on BiOCl. The possible reason is that anionic TEOA has stronger electrostatic adsorption on cationic RhB than BiOCl. At the same time, the catalyst system without any capture agents was also studied for comparison, and the adsorption degradation rate was 70.2% in the darkness for 60 min. After continued stirring in the dark for another 60 min, all the solution concentration changes are tiny, manifesting that the systems have reached the equilibrium of adsorption and desorption after 60 min.
Then, the catalytic reaction system was placed under the irradiation of a LED lamp. The effects of the radical trapping agents on photocatalytic efficiency under LED irradiation were studied. Fig. 11b indicates the histograms of degradation rates of RhB in the presence of various radical trapping agents after 10 minutes of LED irradiation. For the catalytic reaction system without any capture agents, the RhB solution is wholly degraded after 10 minutes of LED irradiation, and the degradation rate reached 98.6%. Similarly, for the system with IPA as a capture agent, the degradation rate of RhB solution can also get 98.4% after 10 minutes of LED irradiation, demonstrating that OH˙ is not the fundamental active species. When TEOA was used as a capture agent, RhB solution is only slightly degraded after 10 minutes of LED irradiation, and the degradation rate is only 5.5%. However, at this time, we seem to conclude that holes are the main active species. However, in the subsequent experiments, we have concluded that the photosensitization of dyes is the leading cause of RhB degradation. It is generally believed that the strong adsorption of dyes on the semiconductor is the premise of efficient photosensitization. However, Fig. 11a has showed the adsorption of RhB on sample S0.07 in the presence of TEOA is negligible, which will significantly affect the photosensitization degradation of RhB. Holes generate from the excited RhB and the capture of holes has little effect on the photocatalytic efficiency. It is because that the superoxide radicals generated by the redox reaction of electrons injected into the conduction band and surface adsorbed oxygen should be the main active species during photosensitization. Mao's study showed that RhB adsorption on BiOCl decreased distinctly from pH 6 to 12.23 The addition of TEOA increases the pH of the system, resulting in decline RhB adsorption on BiOCl. This may be due to the strong charge attraction between OH− ions and cationic RhB, which hinders the adsorption of RhB on the surface of BiOCl. Therefore, the above results show that holes are not the main active species. For the systems in the presence of TRP and BQ, the degradation rates of RhB solutions are 31.6% and 22.1% after 10 minutes of LED irradiation, respectively. An evident quenching phenomenon of photocatalytic efficiency are observed, indicating that 1O2 and ˙O2− species are responsible for RhB degradation in the photocatalytic reaction process. Therefore, we can conclude that 1O2 and ˙O2− species play a significant role in photocatalytic degradation.
Further in-depth analysis of the various active species sources is fundamental to elucidate the photocatalytic mechanisms. Further study on the changes of ˙O2− species in the photocatalytic reaction is significant for profoundly understanding the photocatalytic mechanism. Free radical trapping experiments show that ˙O2− is the main active species of the photocatalytic reaction. Whether the BiOCl sample can produce superoxide radicals under visible light irradiation in the absence of RhB dyes was verified. NBT molecules can react with ˙O2− in a stoichiometric ratio of 1![[thin space (1/6-em)]](https://www.rsc.org/images/entities/char_2009.gif) :
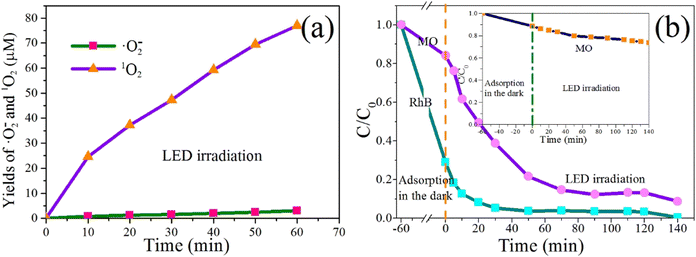
:![[thin space (1/6-em)]](https://www.rsc.org/images/entities/char_2009.gif) 4 to produce blue formamide. Therefore, the molecular concentration of NBT can be measured by UV-vis spectrophotometer, and the yields of ˙O2− can be calculated according to the NBT consumption. The characteristic absorption peak of the NBT molecule is at about 259 nm. The yields of ˙O2− of S0.07 under LED irradiation with time are shown in Fig. 12a. Before the irradiation, the system was placed in the dark and stirred for 60 min to eliminate the adsorption of NBT on sample S0.07. As presented in Fig. 12a, under the LED irradiation, the yield of ˙O2− is minimal, and is about 3 μM after 60 min irradiation, which can be almost negligible. However, the photocatalytic experimental results in Fig. 9 and 10 indicate that the photocatalytic degradation efficiency of RhB under LED irradiation is very high. It suggests the degradation of RhB under LED irradiation is mainly due to dye sensitization.
4 to produce blue formamide. Therefore, the molecular concentration of NBT can be measured by UV-vis spectrophotometer, and the yields of ˙O2− can be calculated according to the NBT consumption. The characteristic absorption peak of the NBT molecule is at about 259 nm. The yields of ˙O2− of S0.07 under LED irradiation with time are shown in Fig. 12a. Before the irradiation, the system was placed in the dark and stirred for 60 min to eliminate the adsorption of NBT on sample S0.07. As presented in Fig. 12a, under the LED irradiation, the yield of ˙O2− is minimal, and is about 3 μM after 60 min irradiation, which can be almost negligible. However, the photocatalytic experimental results in Fig. 9 and 10 indicate that the photocatalytic degradation efficiency of RhB under LED irradiation is very high. It suggests the degradation of RhB under LED irradiation is mainly due to dye sensitization.
Singlet oxygen, as a reactive oxidative species (ROS), is easy to be produced in the aqueous solution containing photosensitizer. Under the irradiation of the light source, the photosensitizer (RhB), initially in a singlet ground electronic state, absorbs light energy (hv) and is excited into an excited singlet state (1RhB). Subsequently, 1RhB can undergo intersystem crossing forming an excited triplet state (3RhB), which transfers the energy to the triplet ground state oxygen (3O2) and returns to the ground state (RhB), and boosts the formation of singlet oxygen (1O2).41 The formation process of singlet oxygen is illustrated as follows:
 | (1) |
 | (2) |
 | (3) |
It has been reported that 9,10-diphenyl anthracene (DPA), which is only soluble in the organic phase, has high efficiency and specificity for capturing singlet oxygen, and has a fast capture rate with a rate constant of 1.3 × 10⁶ M−1 s−1. It can combine with singlet oxygen at low temperatures and form a stable DPA peroxide (DPAO2) without side reaction.35 The reaction formula is as follows: DPA + 1O2 → DPAO2. The reaction is carried out according to the ratio of 1![[thin space (1/6-em)]](https://www.rsc.org/images/entities/char_2009.gif) :
:![[thin space (1/6-em)]](https://www.rsc.org/images/entities/char_2009.gif) 1, so the amount of 1O2 produced can be expressed by the reduction of DPA. DPA has a maximum absorption peak at 375 nm, but DPAO2 has no absorption. Therefore, the decrease of DPA can be calculated according to the decrease in absorbance at 375 nm of DPA. The photosensitization of RhB dyes can produce singlet oxygen active species, which was further verified by using the DPA capture agent. The absorbance value at 375 nm of DPA in the organic phase is measured by a UV-vis spectrophotometer every specific time. The reduced amount of DPA is calculated according to the absorbance reduction value. From Fig. 12a, we can find that the yields of 1O2 increase gradually with the extension of irradiation time. After 60 min, the yield of 1O2 reaches up to 77 μM. Therefore, we have confirmed that the photosensitization of RhB dye could produce singlet oxygen reactive species.
1, so the amount of 1O2 produced can be expressed by the reduction of DPA. DPA has a maximum absorption peak at 375 nm, but DPAO2 has no absorption. Therefore, the decrease of DPA can be calculated according to the decrease in absorbance at 375 nm of DPA. The photosensitization of RhB dyes can produce singlet oxygen active species, which was further verified by using the DPA capture agent. The absorbance value at 375 nm of DPA in the organic phase is measured by a UV-vis spectrophotometer every specific time. The reduced amount of DPA is calculated according to the absorbance reduction value. From Fig. 12a, we can find that the yields of 1O2 increase gradually with the extension of irradiation time. After 60 min, the yield of 1O2 reaches up to 77 μM. Therefore, we have confirmed that the photosensitization of RhB dye could produce singlet oxygen reactive species.
To further verify the dye sensitization of RhB, the photocatalytic degradation effects of MO/RhB mixed solution and pure MO solution by S0.07 were studied. The MO and RhB are 30 mg L−1 and 10 mg L−1 in MO/RhB mixed solution, respectively. The concentration of pure MO solution is 30 mg L−1. Fig. 12b shows the photocatalytic degradation curves of MO/RhB mixed solution with time, and the inset shows the degradation curve of pure MO solution. As shown in the inset, when stirring in the dark for 60 min, the adsorption degradation rate of MO by the catalyst is 12%. The weak absorption is mainly due to the physical adsorption between the anionic dye MO and BiOCl, rather than chemical adsorption. After the LED irradiation of 140 min, the degradation rate is only 26.3%, and the change of degradation rate caused by a LED light is only 14.3%. The lower degradation rate is ascribed to the generation of singlet oxygen active species from photosensitization. From the varying concentration curve with the time of MO/RhB mixed solution in Fig. 12b, we can find that the adsorption rate of RhB and MO by catalyst S0.07 is 70% and 15% after stirring in the dark for 60 min. Under LED irradiation, the concentration of MO solution decreased significantly. After 90 min, the degradation rate of MO is 86%, and the degradation rate of RhB is 98%. By comparing the degradation effects of MO pure solution and MO/RhB mixed solution, we can conclude that the existence of RhB significantly improves the degradation rate of MO under LED visible light irradiation, which is mainly due to the dye sensitization of RhB. In the MO/BiOCl system, the anionic MO is difficult to get close to the {001} facets of BiOCl with negative charges.15 Therefore, the photosensitization of MO could not effectively take place on BiOCl under visible light irradiation. However, in the RhB/MO/BiOCl system, BiOCl with exposed {001} facets has strong electrostatic adsorption on cationic RhB. The strong adsorption of semiconductors on dyes is the premise of dye photosensitization. Moreover, the reasonably matched band positions between the lowest unoccupied molecular orbital (LUMO) of dyes and the conduction band of semiconductor can accelerate electron transfer efficiency. The more negative redox potential of the conduction band of semiconductor play a vital role in the formation of ˙O2− radicals. Based on the above research results, we can conclude that the potentials of the CB and VB edges for sample S0.07 are −0.51 V and 2.75 V vs. normal hydrogen electrode (NHE), respectively. The potential of LUMO of RhB (the excited RhB*) is −1.42 V (vs. NHE),22 which is higher than the edge of the conduction band of BiOCl, providing a favorable driving force for electron injection. RhB molecules adsorbed on the surface of BiOCl are excited by visible light to produce photoelectrons. The photoelectrons from the excited RhB (RhB*) can be transferred to the conduction band of BiOCl. Due to the CB potential of BiOCl (−0.51 V) being more negative than O2/˙O2− (−0.33 V vs. NHE),10,12,34 the O2 adsorbed on the surface of BiOCl will be reduced by electrons to generate ˙O2− active species, which leads to the degradation of MO and RhB pollutants into CO2 and H2O. At the same time, the RhB photosensitizer losing an electron forms a radical cation (˙RhB+). The redox potentials of RhB/˙RhB+ and MO/˙MO+ are 0.95 V and 0.74 V vs. NHE,15 indicating ˙RhB+ can undergo redox reaction with MO to generate RhB and ˙MO+, promoting the regeneration of RhB and degradation of MO. In the RhB/MO/BiOCl system, the degradation of MO occurs firstly, and RhB begins to degrade when the concentration of MO is deficient. In RhB/BiOCl self-sensitized degradation system, the sensitizer radical cation (˙RhB+) finally self-degrades and/or is degraded by the reactive oxidative species (ROSs) such as ˙O2− or 1O2. The stronger the adsorption of RhB molecules on the surface of BiOCl, the more conducive to the transfer of photoelectrons to the conduction band of BiOCl.
Based on the above experimental data and analysis, we propose a possible photocatalytic degradation mechanism of RhB dyes over BiOCl under visible light irradiation, as schematically illustrated in Scheme 1.
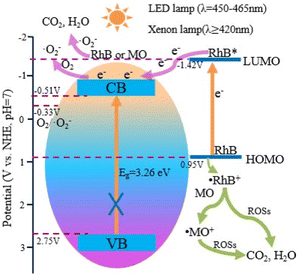 | ||
| Scheme 1 The possible photocatalytic degradation mechanism of RhB over BiOCl under visible light irradiation. | ||
The PEG-modified BiOCl sample S0.07 shows excellent photocatalytic degradation activity on RhB. Firstly, the RhB photosensitization plays an important role. The strong adsorption of RhB on BiOCl is the premise of efficient photosensitization. This strong adsorption is closely related to the morphology and exposed {001} facets characteristics of the as-prepared BiOCl. Under the visible light irradiation, the RhB is excited to RhB*, followed by an electron transfer from the RhB* to the conduction band of BiOCl. Then, the electron is trapped by O2 to produce ˙O2−, which results in the degradation of RhB into CO2 and H2O. The RhB sensitizer losing an electron forms ˙RhB+, which finally self-degrades and/or is degraded by various ROSs such as ˙O2− or 1O2. In addition, in the RhB/MO/BiOCl system, ˙RhB+ can also react with MO to generate RhB and ˙MO+, promoting the regeneration of RhB and degradation of MO. Secondly, singlet oxygen species from dye photosensitization also play a vital role in pollutant degradation. Therefore, the specific processes of the excellent RhB-sensitized degradation of are illustrated as follows:
| RhB + hv (λ ≥ 420 nm) → RhB* | (4) |
| RhB* + BiOCl → ˙RhB+ + BiOCl (e−) | (5) |
| O2 + BiOCl (e−) → ˙O2− | (6) |
| ˙RhB+, ˙MO+ + (˙O2−, 1O2) → CO2 + H2O | (7) |
| ˙RhB+ + MO → RhB + ˙MO+ | (8) |
| RhB, MO + (˙O2−, 1O2) → CO2 + H2O | (9) |
Conclusions
In conclusion, BiOCl hierarchical microspheres assembled from nanosheets with exposed {001} facets containing rich oxygen vacancies were successfully synthesized using PEG-2000 as template by an one-pot room-temperature hydrolysis method. Compared with the unmodified sample, the PEG-modified BiOCl sample exhibits significantly enhanced RhB photosensitized degradation activity under visible light irradiation. After 10 min LED irradiation, the degradation efficiency of RhB by PEG-modified BiOCl sample S0.07 reaches 99.5%, while the degradation efficiency of RhB by unmodified BiOCl sample S0 is only 33%. The degradation rate constant of the PEG-modified sample S0.07 over RhB is 0.4568 min−1, which is 6.76 times that of unmodified sample S0. After 4 min xenon lamp (λ ≥ 420 nm) irradiation, the degradation rate of RhB by S0.07 is almost 100%. The excellent degradation efficiency of RhB is mainly ascribed to the RhB self-photosensitized degradation. The hierarchical microsphere structure, exposed {001} facets and abundant oxygen vacancies co-contribute to the superior adsorption capacity of BiOCl towards RhB. The superior adsorption tremendously accelerates the electron transfer efficiency from the excited RhB into the CB of BiOCl, and then be captured by the adsorbed oxygen on the BiOCl surface to produce superoxide free radical (˙O2−) reactive oxygen species and realize the degradation of pollutants. Besides, singlet oxygen (1O2) species from dye photosensitization and oxygen vacancy also play an essential role in pollutant degradation. The superior RhB-sensitized BiOCl system possess high photocatalytic degradation activity over MO. After 90 min of LED irradiation, the degradation rates of MO and RhB are 86% and 98%, respectively. This work provides a facile and efficient BiOCl synthesis method that is conducive to large-scale production and simultaneously opens up new ideas for the synthesis of other photocatalysts.Author contributions
Prof. Liyan Wang: designed the research, performed the experiments, wrote and revised the manuscript. Dr Zhiqiang Miao: performed the experiments and characterization. Dr Fei Bi: performed the experimental characterization. Dr Shanshan Xiao: performed the experimental characterization. Prof. Li Zhao: advised on the manuscript. Dr Yongtao Li: advised on the manuscript. Dr Lingwei Kong: performed the experimental characterization. Dr Yingqi Li: performed the theoretical analysis. Dr Jingxiu Yang: performed the theoretical analysis. Prof. Xuejian Zhang: advised on the manuscript. Prof. Guangqing Gai: revised the manuscript.Conflicts of interest
There are no conflicts of interest to declare.Acknowledgements
This work was financially supported by the Fundamental Research Funds for the Central Universities (Grant number [2412021QD008]), National Natural Science Foundation of China (Grant No. 22271043,12104181), the Scientific Development Program of Jilin Province (20220203080SF, 20220101045JC, 20210101401JC, YDZJ202201ZYTS376), Industrial Technology Research and Development Projects of Jilin Province (Grant number [2019C059]), Project of the Ministry of Housing and Urban-Rural Development (Grant number [2019-K-050]), and the Scientific Research Project of Education Department of Jilin Province (JJKH20210291KJ).Notes and references
- L. Zhang, Y. Li, Q. Li, J. Fan and K. Lv, Chem. Eng. J., 2021, 419, 129484–129505 CrossRef CAS.
- Y. Liu, B. Yang, H. He, S. Yang, X. Duan and S. Wang, Sci. Total Environ., 2022, 804, 150215–150234 CrossRef CAS PubMed.
- N. M. Shinde, B. G. Ghule, S. D. Raut, S. H. Narwade, J. J. Pak and R. S. Mane, Energy Fuels, 2021, 35, 6892–6897 CrossRef CAS.
- Z. Du, L. Feng, Z. Guo, T. Yan and Y. Fang, J. Colloid Interface Sci., 2021, 589, 545–555 CrossRef CAS PubMed.
- G. Yin, Y. Jia, Y. Lin, C. Zhang, Z. Zhu and Y. Ma, New J. Chem., 2022, 46, 906–918 RSC.
- N. Song, S. Zhang, S. Zhong, X. Su and C. Ma, J. Cleaner Prod., 2022, 337, 130577 CrossRef CAS.
- F. Rao, H. Liu, J. Zhong and J. Li, Mater. Lett., 2022, 312, 131707–131710 CrossRef CAS.
- S. Chen, B. Li, D. Huang, P. Xu, Y. Chen, L. Lei, Z. Wang, R. Deng, L. Du and G. Wang, ACS Appl. Mater. Interfaces, 2021, 13, 17586–17598 CrossRef CAS PubMed.
- X. Yang, S. Sun, J. Cui, M. Yang, Y. Luo and S. Liang, Cryst. Growth Des., 2021, 21, 6576–6618 CrossRef CAS.
- J. Mei, Y. Tao, C. Gao, Q. Zhu and G. Li, Appl. Catal., B, 2020, 285, 119841–119850 CrossRef.
- M. Li, H. Huang, S. Yu, N. Tian, F. Dong, X. Du and Y. Zhang, Appl. Surf. Sci., 2016, 386, 285–295 CrossRef CAS.
- L. Yu, X. Zhang, G. Li, y. Cao, S. Yu and D. Li, Appl. Catal., B, 2016, 187, 301–309 CrossRef CAS.
- E. Grilla, M. N. Kagialari, A. Petala, Z. Frontistis and D. Mantzavinos, Catalysts, 2021, 11, 650–663 CrossRef CAS.
- S. Ge, D. Li, Y. Gao, J. Hou and Z. Zheng, J. Alloys Compd., 2021, 871, 159568–159577 CrossRef CAS.
- H. Chen, X. Yu, Y. Zhu, X. Fu and Y. Zhang, J. Nanopart. Res., 2016, 18, 225–237 CrossRef.
- H. Zhao, X. Liu, Y. Dong, Y. Xia, H. Wang and X. Zhu, ACS Appl. Mater. Interfaces, 2020, 12, 31532–31541 CrossRef CAS PubMed.
- H. Li, J. Shi, K. Zhao and L. Zhang, Nanoscale, 2014, 6, 14168–14173 RSC.
- J. Yang, S. Hu, Y. Fang, S. Hoang, L. Li, W. Yang, Z. Liang, J. Wu, J. Hu, W. Xiao, C. Pan, Z. Luo, J. Ding, L. Zhang and Y. Guo, ACS Catal., 2019, 9, 9751–9763 CrossRef CAS.
- D. H. Wang, G. Q. Gao, Y. W. Zhang, L. S. Zhou, A. W. Xu and W. Chen, Nanoscale, 2012, 4, 7780–7785 RSC.
- X. Zhang, L. Yuan, F. Liang, D. An and M. Xian, Environ. Chem. Lett., 2019, 18, 243–249 CrossRef.
- L. Ding, R. Wei, H. Chen, J. Hu and J. Li, Appl. Catal., B, 2015, 172–173, 91–99 CAS.
- J. Hu, W. Fan, W. Ye, C. Huang and X. Qiu, Appl. Catal., B, 2014, 158–159, 182–189 CrossRef CAS.
- X. Mao, C. Fan, Y. Wang, Y. Wang and X. Zhang, Appl. Surf. Sci., 2014, 317, 517–525 CrossRef CAS.
- J. Diaz-Angulo, J. A. Lara-Ramos and F. Machuca-Martínez, Nanostruct. Photocatal., 2021, 335–362 Search PubMed.
- D. Du, W. Li, S. Chen, T. Yan, J. You and D. Kong, New J. Chem., 2015, 39, 3129–3136 RSC.
- Y. Li, X. Zheng, J. Yang, Z. Zhao and S. Cui, J. Taiwan Inst. Chem. Eng., 2021, 119, 213–223 CrossRef CAS.
- L. Shao, Z. Yang, Y. Liu, X. Xia and C. Yang, Environ. Res., 2021, 197, 111056–111064 CrossRef CAS PubMed.
- Y. Wu, Y. Hu, M. Han, Y. Ouyang, L. Xia, X. Huang, Z. Hu and C. Li, Chem. Eng. J., 2021, 425, 130672–130680 CrossRef CAS.
- G. Han, D. Li, Y. Zheng and X. Song, J. Nanosci. Nanotechnol., 2018, 18, 5575–5581 CrossRef CAS PubMed.
- E. Bárdos, V. Márta, S. Fodor, E. Z. Kedves, K. Hernadi and Z. Pap, Materials, 2021, 14, 2261–2274 CrossRef PubMed.
- J. Li and Y. Li, ChemistrySelect, 2018, 3, 4512–4521 CrossRef CAS.
- J. Liu, S. Zhang and H. Zhao, Appl. Surf. Sci., 2019, 479, 247–252 CrossRef CAS.
- H. Zhao, X. Liu, Y. Dong, Y. Xia and H. Wang, Appl. Catal., B, 2019, 256, 117872 CrossRef CAS.
- Q. Su, L. Zhu, M. Zhang, Y. Li, S. Liu, J. Lin, F. Song, W. Zhang, S. Zhu and J. Pan, ACS Appl. Mater. Interfaces, 2021, 13, 32906–32915 CrossRef CAS PubMed.
- H. H. Wasserman, J. R. Scheffer and J. L. Cooper, J. Am. Chem. Soc., 1972, 94, 4991–4996 CrossRef CAS.
- G. Li, B. Jiang, S. Xiao, Z. Lian, D. Zhang, J. C. Yu and H. Li, Environ. Sci.: Processes Impacts, 2014, 16, 1975–1980 RSC.
- Z. Yang, D. Wang, Y. Zhang, Z. Feng, L. Liu and W. Wang, ACS Appl. Mater. Interfaces, 2020, 12, 8604–8613 CrossRef PubMed.
- D. Cui, L. Wang, K. Xu, L. Ren, L. Wang, Y. Yu, Y. Du and W. Hao, J. Mater. Chem. A, 2018, 6, 2193–2199 RSC.
- X. Zhang, Z. Ai, F. Jia and L. Zhang, J. Phys. Chem. C, 2008, 112, 747–753 CrossRef CAS.
- L. Zhang, C.-G. Niu, X.-F. Zhao, C. Liang, H. Guo and G.-M. Zeng, ACS Appl. Mater. Interfaces, 2018, 10, 39723–39734 CrossRef CAS PubMed.
- J. M. Allen, C. J. Gossett and S. K. Allen, J. Photochem. Photobiol., B, 1996, 32, 33–37 CrossRef CAS PubMed.
Footnote |
| † Co-first author. |
| This journal is © The Royal Society of Chemistry 2022 |

