 Open Access Article
Preparation and bifunctional properties of the A-site-deficient SrTi0.3Fe0.6Ni0.1O3−δ perovskite†
Na Xu ab,
Jiyuan Zhangab,
Shaohui Suab,
Jingdong Feng*b and
Zhanlin Xu*b
aKey Laboratory of Preparation and Applications of Environmental Friendly Materials of the Ministry of Education, Jilin Normal University, Changchun, 130103, China
bDepartment of Chemistry, Jilin Normal University, Siping, 136000, China. E-mail: xuzhanlin1964@163.com; tougaozzz@126.com
First published on 25th November 2022
Abstract
The development of efficient, non-noble metal electrocatalysts for oxygen reduction reaction (ORR) and oxygen evolution reaction (OER) is crucial for their application in energy storage devices, such as fuel cells and metal–air batteries. In this study, SrTi0.3Fe0.6Ni0.1O3−δ (STFN) perovskite was synthesized using the sol–gel method, and its electrocatalytic activity was evaluated using a rotating disk electrode (RDE) in an alkaline medium. STFN synthesized at the optimum synthesis temperature of 800 °C exhibited good ORR and OER performances. To further improve electrocatalytic activity, a series of Sr1−xTi0.3Fe0.6Ni0.1O3−δ (x = 0, 0.05, and 0.1) perovskites with A-site vacancies were synthesized at 800 °C. Material characterization results showed that the removal of the A-site from the perovskite led to an increase in surface oxygen vacancies, resulting in higher ORR and OER activities. The results of this study indicate that Sr1−xTi0.3Fe0.6Ni0.1O3−δ (x = 0.1) is a promising bifunctional oxygen electrocatalyst for Zn–air batteries.
1 Introduction
With the increasing global attention toward the energy crisis and environmental pollution, there is a need for clean and sustainable energy resources to meet the needs of modern society.1,2 In recent years, it has become necessary for catalysts to possess dual functionality for use in rechargeable metal–air batteries. The amount of oxygen in the surrounding air decreases during the discharge process, and an oxygen reduction reaction (ORR) occurs. Furthermore, oxygen is released from the anode during charging, and an oxygen evolution reaction (OER) occurs.3,4 However, the low ORR and OER rates of air cathodes during discharge and charge, respectively, considerably reduce the energy efficiency of batteries. Therefore, it is necessary to develop novel electrocatalysts with enhanced ORR and OER catalytic activities to minimize the electrode overpotential and thus reduce the additional energy required for the reactions.5–7Currently, noble metals and their compounds are considered the best electrocatalysts. Pt and Pd are the most widely used catalysts for the ORR; however, they exhibit poor OER activity. IrO2 and RuO2 are the most efficient OER catalysts; however, their ORR activity is poor.8 Moreover, these precious metal catalysts are not only expensive and limited in availability but also unstable under certain reaction conditions, which hinders their wide application. Therefore, the development of non-noble, metal-effective bifunctional oxygen electrocatalysts is crucial for improving the performance of Zn–air batteries.9 To date, some bifunctional oxygen electrocatalytic materials have been studied, including carbon-based materials and nonnoble metal oxides. However, owing to the poor stability of carbon-based materials in an oxidative environment compared to that of metal oxides, the latter are favored by researchers. Although mixed metal oxides, such as spinel structures, exhibit good catalytic performance owing to the synergistic effect of metal ions, their bifunctional electrocatalytic activity is relatively limited. Perovskite oxides are potential candidates owing to their unique electronic structure, inherently high activity, flexible composition, simple synthesis, and easy mass production methods. The general formula of perovskites is ABO3, where A is usually a rare earth or alkaline earth metal, and B is a transition metal. They have a cubic crystal structure, in which B is located at the center of the octahedron, and A fills the spaces between the octahedrons. As a new type of mixed metal oxide, perovskites have a new molecular formula, AA′1−aBB′1−bO3−x, owing to the generation of cation substitution sites or defects at the A- or B-sites. Approximately 90% of the elements in the periodic table can be used to replace the A- or B-sites of perovskite oxides; hence, they offer significant compositional and structural flexibility.10 In addition, the electronic structure of perovskite oxides can be manipulated using various methods to achieve the high electrocatalytic activity. Therefore, they are ideal electrocatalytic materials for the OER and ORR in alkaline medium.11–13 Hence, this study focuses on the use of a perovskite-based bifunctional oxygen electrocatalyst in a Zn–air battery.14,15
Recently, a cost-effective Ti-doped SrFeO3 oxide system, SrTiyFe1−yO3−δ (STF), has been reported to possess good chemical stability, high oxygen ionic conductivity, and good ORR activity at typical solid oxide fuel cell (SOFC) operating temperatures, rendering it suitable for metal–air battery cathodes.16–21 Perovskites with Ti and Fe at the B-sites were chosen because Sr0.95(Ti0.3Fe0.6Ni0.07)O3−δ has excellent electrochemical properties, possibly because of mixed ionic and electronic conductivity. Moreover, Ni-doped STF can effectively reduce the cathodic polarization resistance.22 In addition, the advantages of Ni-doping have been widely reported. For instance, Ni substitution can improve the oxygen vacancy concentration and oxygen permeability via charge compensation24,25 in BaFeO3 and Ba0.5Sr0.5Co0.7Fe0.2Ni0.1O3 (ref. 23). In addition, Sr1−xTi0.3Fe0.6Ni0.1O3−δ (STFN) perovskite was used as the cathode of the SOFC in this study. All STFN oxides have a cubic perovskite structure and high electrical conductivity in air. The introduction of Sr vacancies produces more O vacancies and lowers the thermal expansion coefficient.26
In this study, STFN perovskite was prepared by the sol–gel method as a bifunctional oxygen electrocatalyst for the ORR and OER. Moreover, the phase structure, elemental state, specific surface area, and electrochemical properties of the STFN were investigated.
2 Experimental
2.1 Material preparation
![[thin space (1/6-em)]](https://www.rsc.org/images/entities/char_2009.gif) :
:![[thin space (1/6-em)]](https://www.rsc.org/images/entities/char_2009.gif) EDTA
EDTA![[thin space (1/6-em)]](https://www.rsc.org/images/entities/char_2009.gif) :
:![[thin space (1/6-em)]](https://www.rsc.org/images/entities/char_2009.gif) metal ion molar ratio of 1.5
metal ion molar ratio of 1.5![[thin space (1/6-em)]](https://www.rsc.org/images/entities/char_2009.gif) :
:![[thin space (1/6-em)]](https://www.rsc.org/images/entities/char_2009.gif) 1
1![[thin space (1/6-em)]](https://www.rsc.org/images/entities/char_2009.gif) :
:![[thin space (1/6-em)]](https://www.rsc.org/images/entities/char_2009.gif) 1) were added to the mixed solution. The pH was adjusted to 4 using ammonia, and the mixture was stirred at 80 °C until a gel was formed. The gel was then dried in an oven at 90 °C for 12 h to form the gel precursor. The precursor was carbonized in air by heating in a box-type resistance furnace for 3 h. Finally, SrTi0.3Fe0.6Ni0.1O3−δ powders were obtained after calcination at 700, 800, 900, 1000, 1100, and 1200 °C with a 2 °C min−1 increase in the temperature in a muffle furnace; these were denoted as STFN-700, STFN-800, STFN-900, STFN-1000, STFN-1100, and STFN-1200, respectively.
1) were added to the mixed solution. The pH was adjusted to 4 using ammonia, and the mixture was stirred at 80 °C until a gel was formed. The gel was then dried in an oven at 90 °C for 12 h to form the gel precursor. The precursor was carbonized in air by heating in a box-type resistance furnace for 3 h. Finally, SrTi0.3Fe0.6Ni0.1O3−δ powders were obtained after calcination at 700, 800, 900, 1000, 1100, and 1200 °C with a 2 °C min−1 increase in the temperature in a muffle furnace; these were denoted as STFN-700, STFN-800, STFN-900, STFN-1000, STFN-1100, and STFN-1200, respectively.2.2 Characterization
The crystalline structure of the samples was analyzed using X-ray diffraction (XRD; PC2500, Rigaku, Japan) with a Cu Kα radiation source in the 2θ range of 10–90°. The Brunauer–Emmett–Teller (BET) method was used to determine the specific surface area using the nitrogen adsorption/desorption isotherms of the two samples (Autosorb-iQ-C, USA Conta Instrument Company). The surface chemical composition of each sample was studied using X-ray photoelectron spectroscopy (XPS; Escalab 250Xi, Thermo Scientific). The morphology was observed via scanning electron microscopy (SEM; ZEISS Sigma 500). Oxygen vacancy analysis was performed by thermogravimetric analysis (TGA; American TA Company, STD650).2.3 Electrochemical measurements
The electrochemical catalytic activity of the samples was measured at room temperature using a rotating disk electrode (RDE) system (Pine Instruments, Inc.). RDE measurements were performed on an electrochemical workstation (CHI760E) with a conventional three-electrode system in 0.1 M KOH electrolyte solution. The working, counter, and reference electrodes were the RDE (GC, 0.196 cm2), Pt (1 × 1 cm), and Hg/HgO (1 mol per L KOH), respectively.Perovskite oxide (5 mg) and acetylene black (5 mg) were dispersed in 800 μL anhydrous ethanol, mixed with 40 μL Nafion (5 wt%, Dupont) solution, and placed in an ultrasonic bath for 1 h to obtain a uniform ink. Subsequently, 14 μL of the catalyst ink was dropped onto the glassy carbon electrode and dried in air for 5 min. The catalyst loading was 0.425 mg cm−2.
A 0.1 mol per L KOH solution was used as the electrolyte, which was saturated with oxygen for 30 min before the test. The test was conducted under an oxygen atmosphere. The scanning speed for the linear sweep voltammetry (LSV) test was 10 mV s−1, and the electrode rotation speed was 1600 rpm. The working electrode was electrochemically activated in the range −1.0–1.0 V vs. Hg/HgO at a scan rate of 50 mV s−1 to expose a stable surface.
The ORR was carried out at a scan rate of 10 mV s−1 in the range −1.0–0.2 V and a ring voltage of 0.5 V vs. Hg/HgO. The ORR stability was measured by chronoamperometry (CA) at −0.7 V vs. Hg/HgO for 10![[thin space (1/6-em)]](https://www.rsc.org/images/entities/char_2009.gif) 000 s.
000 s.
In the OER test, the voltage scanning range was 0.4–1.0 V vs. Hg/HgO at a rate of 10 mV s−1 and the internal resistance was compensated by iR. Electrochemical impedance spectroscopy (EIS) was performed using an AC impedance amplitude of 10 mV in the frequency range 100![[thin space (1/6-em)]](https://www.rsc.org/images/entities/char_2009.gif) 000–0.1 Hz. The accelerated stability of Hg/HgO was evaluated in 0.1 M KOH saturated with O2 at a scan rate of 100 mV s−1 for 1000 cycles between 0.4 and 1 V.
000–0.1 Hz. The accelerated stability of Hg/HgO was evaluated in 0.1 M KOH saturated with O2 at a scan rate of 100 mV s−1 for 1000 cycles between 0.4 and 1 V.
The measured potential vs. Hg/HgO was converted to potential vs. RHE using the Nernst eqn (1), and iR compensation was performed based on eqn (2), as follows:
| E(RHE) = E(Hg/HgO) + 0.0591 × pH + 0.098 | (1) |
| EiRcorrected = E − iR | (2) |
3 Results and discussion
3.1 Results for perovskites calcined at different temperatures
The crystal structure of the prepared samples was determined by XRD. As shown in Fig. 1a, the required single-phase crystal structure of perovskite can only be formed at calcination temperatures above 800 °C without any detectable impurities. Consequently, the diffraction patterns of the STFN samples formed at temperatures greater than 800 °C are in good agreement with the characteristic peaks of the perovskite phase. However, with an increase in calcination temperature, the particles agglomerate more easily, as shown in Fig. S1† SEM. The resultant larger particle sizes lead to smaller mesopore sizes for the nanofibers, which is not beneficial for electrocatalytic activity.27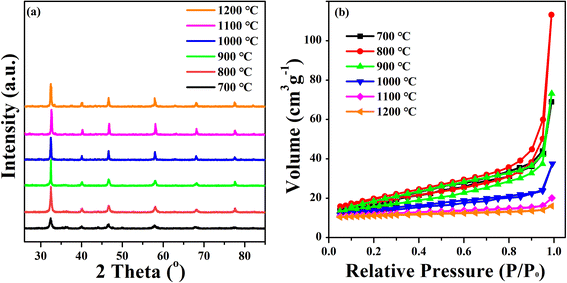 | ||
| Fig. 1 (a) XRD patterns and (b) nitrogen adsorption–desorption isotherms of STFN samples at different calcination temperatures. | ||
The BET surface area of the perovskite samples was characterized by N2 adsorption. With an increase in the specific surface area of the catalyst, more active sites are exposed, and the adsorption capacity is enhanced. As a result, the contact area between the catalyst and oxygen increases, which further improves the efficiency of the oxygen catalysis, as shown in Table S1 (ESI†). The STFN perovskite exhibits a V-type isothermal line and hysteresis loop, which implies that a gap is formed owing to the accumulation of the nanoparticles. The BET surface areas of STFN-700, STFN-800, STFN-900, STFN-1000, STFN-1100, and STFN-1200 are 32.839, 33.933, 25.549, 17.106, 8.404, and 6.001 m2 g−1, respectively. The mesopore and macropore structure may be related to secondary pores formed by the accumulation of primary particles and voids between these aggregates. Fig. 1b shows that when the calcination temperature was 800 °C, the specific surface area of the catalyst was the largest. With an increase in the calcination temperature, the specific surface area and pore size of the catalyst decrease gradually. When the calcination temperature reached 1000 °C, the specific surface area and pore size decreased sharply, which may have been due to the accumulation of native samples at higher calcination temperatures.
The ORR and OER catalytic activities of the STFN samples were evaluated using an RDE measurement system in a 0.1 mol per L KOH solution saturated with O2 at 1600 rpm. Fig. 2a shows the ORR linear sweep voltammetry (LSV) curves of the perovskite catalysts at various temperatures. The initial potential (Eonset; potential at 100 μA cm−2) and half-wave potential (E1/2) are the most important performance indices for measuring ORR activity. The higher the potential, the higher the ORR activity. E1/2 is commonly used to evaluate the ORR catalytic activity of catalysts because it is considered one of the most effective ORR trend indicators. It can be seen from the Fig. 2a that STFN-800 has the largest E1/2 of 0.6411 V vs. RHE compared to the other catalysts (STFN-700 (0.6151 V), STFN-800 (0.6411 V), STFN-900 (0.5961 V), STFN-1000 (0.5678 V), STFN-1100 (0.5318 V), and STFN-1200 (0.5221 V)) (Table S2†). The initial potential decreases with an increase in the calcination temperature. This indicates that STFN-800 exhibits a more positive onset potential and exhibits ORR performance closest to that of Pt/C. Oxygen is expected to be effectively reduced to OH− via a four-electron pathway.
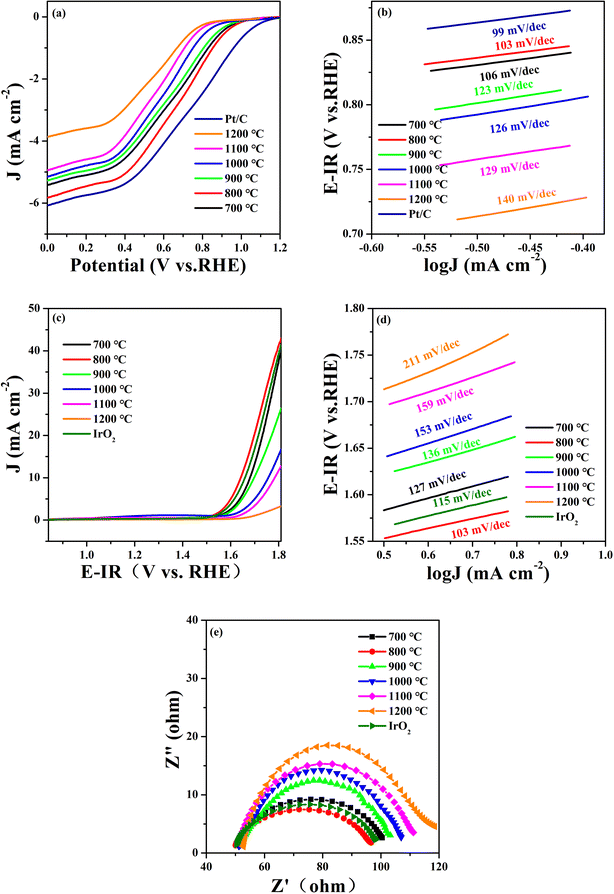 | ||
| Fig. 2 Pt/C, IrO2 and STFN at different calcination temperatures: (a) ORR LSV curves, (b) ORR Tafel curves, (c) OER LSV curves, (d) OER Tafel curves, and (e) EIS plots. | ||
Tafel curves were used to evaluate the reaction rate of the ORR/OER, where the slope of the Tafel plot represents the overpotential required to increase the current density (J) by an order of magnitude.28 The Tafel diagrams of all the catalyst samples are shown in Fig. 2b. Here, the y-axis represents the potential and the x-axis represents the logarithm of the current density (log![[thin space (1/6-em)]](https://www.rsc.org/images/entities/char_2009.gif) J). A lower Tafel slope indicates a faster current density increase, smaller changes in overpotential, and a higher reaction rate. The results show that STFN-800 has the smallest Tafel slope (103 mV dec−1) and the highest ORR catalytic rate, which is the lowest among the four samples and is close to that of Pt/C (99 mV dec−1).
J). A lower Tafel slope indicates a faster current density increase, smaller changes in overpotential, and a higher reaction rate. The results show that STFN-800 has the smallest Tafel slope (103 mV dec−1) and the highest ORR catalytic rate, which is the lowest among the four samples and is close to that of Pt/C (99 mV dec−1).
Fig. 2c shows the OER polarization curves of the prepared samples compensated by iR in 0.1 M KOH saturated with O2. The overpotential is another important parameter commonly used to determine the performance of electrocatalysts. Ideally, the action potential of the driving reaction should equal the reaction potential at equilibrium. However, owing to inherent dynamic barriers or electrode (solid)/electrolyte interface resistance, the applied potential is typically higher than the equilibrium potential. According to a report in the literature, the OER overpotential (η) at 10 mA cm−2 is an important indicator for evaluating catalytic activity.29 The overpotential is calculated using the formula η = Ej = 10 mA cm−2 − 1.23 V (vs. RHE), where 1.23 V (vs. RHE) is the O2/H2O equilibrium potential.30 Therefore, a lower overpotential indicates the better electrocatalytic activity of the catalyst. Based on this analysis, among the SrTi0.3Fe0.6Ni0.1O3−δ samples calcined at different temperatures, STFN-800 had the lowest overpotential (η = 412.0 mV) with a geometric current density of 10 mA cm−2. It was found that STFN-800 was superior to the other samples and exhibited excellent OER activity.
To further confirm the good OER catalytic kinetics of the STFN-800 perovskite, Tafel slope and EIS measurements were performed using catalysts prepared at different temperatures.31 The corresponding Tafel plots were obtained from iR-corrected LSV curves. As shown in Fig. 2d, the Tafel slope of STFN-800 is the smallest and close to that of IrO2, thereby confirming its higher OER catalytic rate compared to the other samples. The EIS plot in Fig. 2e shows a semicircle in the low-frequency region, representing the diffusion process, and a small ring in the high-frequency region, representing the charge transfer process. EIS curves of the STFN electrode were recorded at 1600 rpm. The figure shows that STFN-800 has the best mass transfer ability among the six catalysts. In the high-frequency region, charge transfer dominates the OER process. For the OER catalytic activity, the smaller the semicircle, the better the charge transfer ability. The EIS results confirm that STFN-800 has the lowest impedance in the OER, and hence, the best catalytic activity and highest OER activity among the perovskite electrocatalysts prepared at different temperatures. Thus, STFN-800 exhibited the highest OER activity among all the perovskite samples.
In addition, a good bifunctional OER/ORR electrocatalyst should exhibit a low loss and high stability for both reactions in the same electrolyte. To evaluate the bifunctional electrocatalytic performance of the catalysts, their catalytic activity was assessed by calculating the potential difference (ΔE) between the ORR current density at 3 mA cm−2 and OER current density at 10 mA cm−2. In general, the smaller the potential difference (ΔE), the lower the total overpotential of the two reactions. A lower overpotential implies that less energy is required to initiate the reaction and hence, the bifunctional catalytic activity of the electrocatalyst is better.32,33 Among the prepared samples (Table S3†), the ΔE value (1.0296 V) of STFN-800 is the lowest. Thus, the optimal synthesis temperature is 800 °C.
3.2 Results for perovskite with an A-site vacancy
The above results showed that the electrode powder calcined at 800 °C exhibited the best performance. To optimize electrode performance, vacancy optimization was conducted at a calcination temperature of 800 °C. The phase and crystal structure of the Sr1−xTi0.3Fe0.6Ni0.1O3−δ (x = 0, 0.05, and 0.1) perovskite oxides were determined using XRD. Fig. 3a shows that all the samples are pure. The main peak indicates a cubic structure. No impurities are detected, indicating that the absence of A-sites has no effect on the crystal structure of the perovskites. The diffraction peak of the A-site cation-deficient Sr1−xTi0.3Fe0.6Ni0.1O3−δ is shifted to a slightly higher angle compared to that of the defect-free SrTi0.3Fe0.6Ni0.1O3−δ (Fig. 3b), implying lattice shrinkage due to the creation of smaller Fe cations (from 0.645 Å for Fe3+ to 0.585 Å for Fe4+).34,35 An A-site defect (Sr vacancy) was successfully introduced into the lattice structure of the SrTi0.3Fe0.6Ni0.1O3−δ.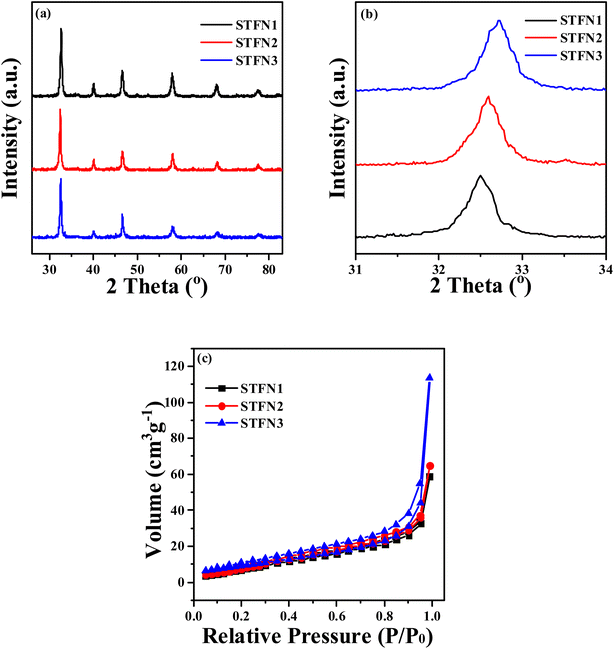 | ||
| Fig. 3 (a) XRD pattern of S1−xTFN with an A-site vacancy, (b) magnified XRD pattern in the region 2θ = 31–34°, (c) nitrogen adsorption–desorption isotherm of S1−xTFN with an A-site vacancy. | ||
As shown in Fig. 3c, the BET specific surface areas of STFN3, STFN2, and STFN1 are 37.823, 34.957, and 32.839 m2 g−1, respectively. The specific surface area of STFN3 is the largest, indicating that the greater the A-site cation deficiency loss, the greater the specific surface area.36 (Table S4†).
TGA curves of the STFN1, STFN2, and STFN3 powders in a N2 atmosphere are shown in Fig. S2.† The three thermogravimetric curves show the same trend. In the entire test range, with an increase in A vacancy, the mass loss of the powder increases, and the mass loss of STFN3 was 11.6% between 30 °C and 772 °C, which indicates that the release of lattice oxygen forms more oxygen vacancies. At approximately 772 °C, with an increase in temperature, almost no change in weight or heat is detected, indicating that the powder is in a relatively stable state.
Traditionally, ORR and OER activities largely depend on the concentration of oxygen vacancies in bifunctional catalysts and the valence states of transition metals.37–39 The surface chemical composition and cation oxidation states of the perovskite samples were determined using XPS. The XPS profiles in Fig. 4a show peaks for Sr 3d, Ti 2p, Fe 2p, Ni 2p, and O 1s in the STFN1 and STFN3 samples at different binding energies. The O 1s spectra are mainly composed of four oxygen species, marked as A, B, C, and D, and are shown in Fig. 4b, with peak A representing lattice oxygen (Olat) appearing at 528.9 eV. Peak B at 531.1 eV and peak C at 531.48 eV are related to a higher oxidation state of oxygen (O22−/O−) and surface-adsorbed oxygen/hydroxyl (O2/OH−), respectively.40–42 Peak D (532.79 eV) was induced by surface molecular water or carbonate.43,44 O2/OH− replacement and OH− regeneration rate are the main factors influencing the ORR kinetics. Therefore, a relatively high O22−/O− ratio has a positive effect on the ORR activity of SrTi0.3Fe0.6Ni0.1O3−δ (STFN). In addition, the OER is induced by chemical adsorption or oxidation of surface OH− groups, and a high concentration of lattice hydroxides enhances OER activity. The relative ratios of the oxygen peak areas in different states are listed in Table S5.† The O22−/O− ratio (42.91%) for STFN3 is higher than that of STFN1 (35.37%). Because the concentration of the O22−/O− species is related to oxygen vacancies, it is the main component responsible for the electrochemical activity on the surface. Therefore, a slight increase in the chemometrics of the A-site is advantageous for improving bifunctional electrocatalytic activity.45 This also results in enhanced OER and ORR catalytic activity.
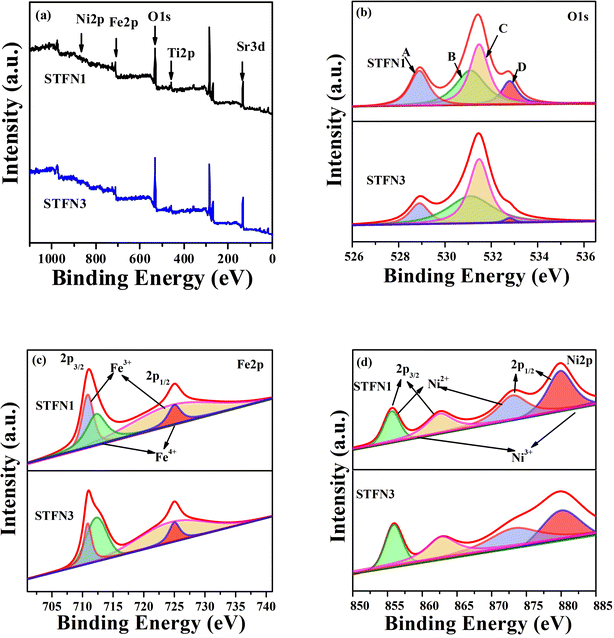 | ||
| Fig. 4 (a) XPS profiles of STFN1 and STFN3, (b) O 1s spectrum, (c) Fe 2p spectrum, and (d) Ni 2p spectrum. | ||
Fig. 4c shows the deconvoluted spectrum of Fe 2p for the STFN samples. The peaks with binding energies of ∼710.86 and ∼712.27 eV are related to Fe3+ 2p3/2 and Fe4+ 2p3/2, respectively. The binding energies of Fe3+ 2p1/2 and Fe4+ 2p1/2 are ∼724.46 and ∼725.02 eV, respectively.46,47 Fig. 4d shows the deconvoluted spectrum of the Ni 2p nuclear energy level of the STFN samples. The binding energies of Ni2+ 2p3/2 and Ni2+ 2p1/2 are ∼855.61 and ∼872.87 eV. The peaks at ∼862.46 and ∼879.71 eV are attributed to Ni3+ 2p3/2 and Ni3+ 2p1/2, respectively.48 The relative amounts of Fe species in different oxidation states are listed in Table S6.† The oxidation state of Fe also increases with an increase in A-site defects. The concentration of Fe4+ (40.08%) in STFN3 is higher than that of STFN1 (30.37%), that of the Ni3+ (64.42%) of STFN3 is higher than that of STFN1 Ni3+ (60.96%), and the Fe4+/Fe3+ ratio of STFN3 is 0.67, which makes eg filling closer to 1.49 This indicates that, with Ni doping, SrTi0.3Fe0.6Ni0.1O3−δ contains mixed oxidation states of Fe3+ and Fe4+ as well as Ni2+ and Ni3+. The presence of these mixed valence states is consistent with previous reports in which the B-site cations of perovskite materials were partially replaced by different cations. In STFN, the synergistic effect between Fe and Ni is better than that of other B-site elements, which may be the reason for the increase in Fe4+ species in the STFN. This leads to an increase in electrocatalytic activity.50,51 The XPS results show that the A-site defect of the perovskite catalyst can change the oxidation state and oxygen species of the transition metals, thereby improving the catalytic activity.
The ORR activity of the perovskite samples was determined using a traditional three-electrode system and the RDE technique at 1600 rpm in a 0.1 M KOH solution. Fig. 5a shows the ORR LSV curves for all the perovskite catalysts. In this figure, the initial potential of the catalyst (at 0.1 mA cm−2) is shifted to a slightly more positive value with an increase in the number of A-deficient sites. When the stoichiometric ratio at the A-site is 0.95, the initial potential of STFN2 is 0.8912 V vs. Hg/HgO, which is higher than that of 0.8857 V vs. Hg/HgO for the original STFN1 sample. When the stoichiometric ratio at the A site is 0.9, the initial potential further increases to 0.8934 V vs. Hg/HgO. To further understand the ORR catalytic activity of the A-site-vacant STFN catalysts and verify their ORR electron transfer path, Fig. 5b shows a typical LSV curve of the STFN3 perovskite catalyst at 400–2000 rpm. With an increase in the rotation speed, the current density increases gradually, owing to a higher diffusion rate. As shown in Fig. 5c, the ORR occurs in a mixed state, and dynamic diffusion control is achieved in the potential range of −0.1–0.5 V. The number of transferred electrons (n) was determined using the Koutecky–Levich (K–L) equation:52
| i−1 = iL−1 + iK−1 = (Bω1/2)−1 + iK−1 | (3) |
| B = 0.62nFC0D02/3μ−1/6 | (4) |
![[thin space (1/6-em)]](https://www.rsc.org/images/entities/char_2009.gif) 485 C mol−1); C0 is the volume concentration of O2 in 0.1 M KOH (1.21 × 10⁻⁶ mol cm−3); D0 is its diffusion coefficient in 0.1 M KOH (1.86 × 10⁻⁵ cm2 s−1); and, μ is the kinematic viscosity of the electrolyte (0.01 cm2 s−1). When the rotational speed is expressed in radians (rad s−1), the constant in eqn (4) is 0.62. The linear relationship of the K–L curve implies first-order reaction kinetics for the dissolved oxygen and a similar transfer electron number n in the ORR at different potentials.53,54 With a linear relationship between i−1 and ω−1/2, the intercept is equal to iK−1, and n can be calculated using the slope of the line. Fig. 5c shows that the fitting curve is almost parallel to the n = 4 curve, indicating that the STFN3 catalyst follows a four-electron reaction pathway in the ORR. Furthermore, the Tafel slope is related to the electrocatalytic kinetics of the reaction. The smaller the Tafel slope, the higher the reaction rate. According to the Tafel equation, the density increases rapidly, and the overpotential changes only slightly. As shown in Fig. 5d, the Tafel slopes of STFN2 and STFN3 are smaller than that of STFN1, and the minimum Tafel slope of STFN3 is 97 mV dec−1. The current density of STFN3 is the highest, at approximately 8.6094 mA cm−2 (Table S7†). This indicates that the ORR rate of the samples is highest for STFN3. Thus, we can conclude that A-site cation deficiency can significantly improve ORR activity.
485 C mol−1); C0 is the volume concentration of O2 in 0.1 M KOH (1.21 × 10⁻⁶ mol cm−3); D0 is its diffusion coefficient in 0.1 M KOH (1.86 × 10⁻⁵ cm2 s−1); and, μ is the kinematic viscosity of the electrolyte (0.01 cm2 s−1). When the rotational speed is expressed in radians (rad s−1), the constant in eqn (4) is 0.62. The linear relationship of the K–L curve implies first-order reaction kinetics for the dissolved oxygen and a similar transfer electron number n in the ORR at different potentials.53,54 With a linear relationship between i−1 and ω−1/2, the intercept is equal to iK−1, and n can be calculated using the slope of the line. Fig. 5c shows that the fitting curve is almost parallel to the n = 4 curve, indicating that the STFN3 catalyst follows a four-electron reaction pathway in the ORR. Furthermore, the Tafel slope is related to the electrocatalytic kinetics of the reaction. The smaller the Tafel slope, the higher the reaction rate. According to the Tafel equation, the density increases rapidly, and the overpotential changes only slightly. As shown in Fig. 5d, the Tafel slopes of STFN2 and STFN3 are smaller than that of STFN1, and the minimum Tafel slope of STFN3 is 97 mV dec−1. The current density of STFN3 is the highest, at approximately 8.6094 mA cm−2 (Table S7†). This indicates that the ORR rate of the samples is highest for STFN3. Thus, we can conclude that A-site cation deficiency can significantly improve ORR activity.
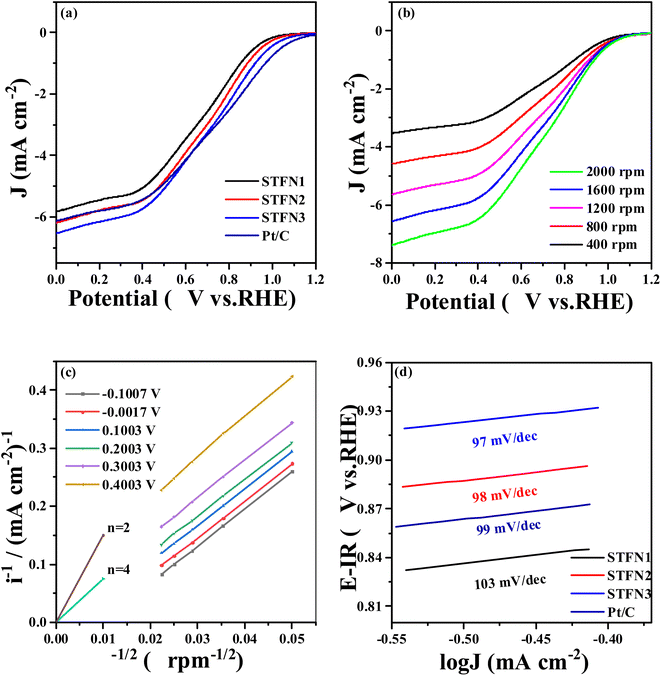 | ||
| Fig. 5 ORR performance of A-site-deficient S1−xTFN and Pt/C (a) LSV curves, (b) LSV curves of STFN3 at different speeds, (c) K–L plot, and (d) Tafel curves. | ||
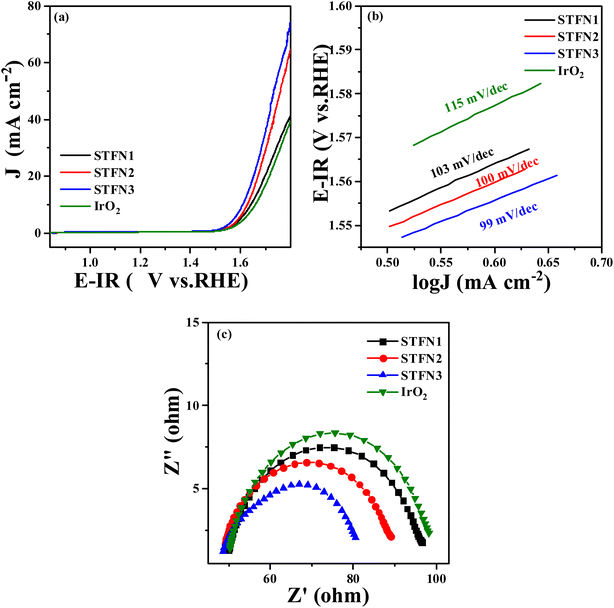
The OER activity of the prepared samples was evaluated to explore their application as bifunctional oxygen electrocatalysts. OER LSV curves are shown in Fig. 6a, where the overpotential (η) of STFN3 with a current density of 10 mA cm−2 is the lowest (399.9 mV), followed by that of STFN2 (408 mV), which is lower than that of the most primitive STFN1, and significantly lower than that of IrO2 (413 mV). This indicates that the A-site-vacant perovskite has a higher current density and better OER catalytic activity in the same potential range. In addition, the Tafel plot (Fig. 6b) and EIS results (Fig. 6c) confirm the kinetics of the enhancement of OER activity by the catalyst. STFN3 has a smaller Tafel slope and lower Rct, followed by those of STFN2, indicating that A-site-deficient STFN perovskite nanocomposites have lower sensitivity to direct current bias and higher activity. Therefore, STFN3 has a higher OER rate and better charge-transfer ability than the other catalysts. Thus, we can conclude that A-site cation deficiency can significantly improve OER activity. In addition, among the prepared A-site-vacant samples, the ΔE (0.9217 V) of STFN3 is the lowest, and its ΔE is smaller (Table S8†). This indicates that the total overpotential of the two reactions is even smaller than that of a recently reported perovskite catalyst, leading to better bifunctional catalytic activity (Table S9†).
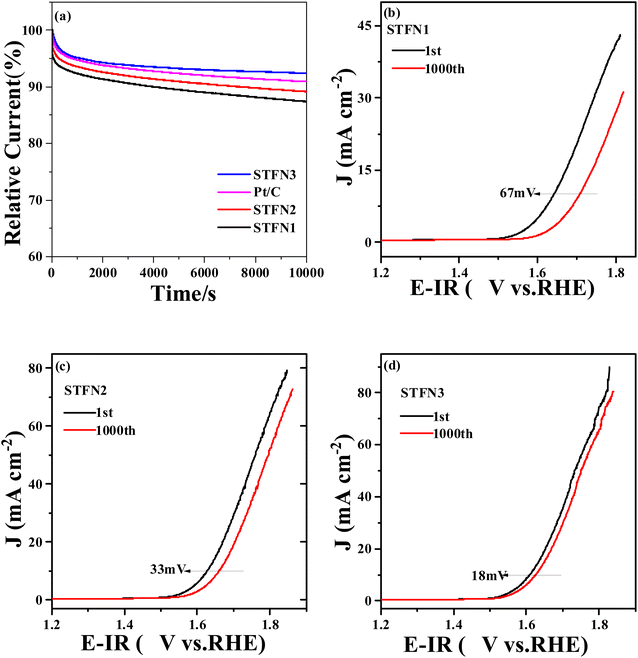
In addition to the activity of the catalyst, its long-term stability is an important indicator for evaluating ORR and OER performance.55 To measure the durability of the ORR, CA was performed for 10![[thin space (1/6-em)]](https://www.rsc.org/images/entities/char_2009.gif) 000 s at −0.7 V (vs. Hg/HgO) at 1600 rpm. As shown in Fig. 7a, the relative current of STFN3 only slightly decreases after 10
000 s at −0.7 V (vs. Hg/HgO) at 1600 rpm. As shown in Fig. 7a, the relative current of STFN3 only slightly decreases after 10![[thin space (1/6-em)]](https://www.rsc.org/images/entities/char_2009.gif) 000 s, and the current retention rate is 92.4%, which is higher than that of commercial Pt/C (90.9%). The current retention rates of STFN2 and STFN1 are 89.2% and 87.4%, respectively. The OER durability of the STFN1, STFN2, and STFN3 catalysts was also evaluated by 1000 cycles of continuous cyclic potential between 0.4 and 1 V (vs. RHE) in 0.1 M KOH saturated with O2 at a scanning rate of 100 mV s−1. After 1000 cycles, as shown in Fig. 7(b–d), at a current density of 10 mA cm−2, the LSV curves of STFN3, STFN2, and STFN1 show positive shifts of 18, 33, and 67 mV, respectively. Again, perovskite STFN3 shows the highest activity after the accelerated stability test, owing to its excellent activity and good stability. The A-site removal strategy can effectively improve the stability of the original STFN perovskite for the ORR and OER.
000 s, and the current retention rate is 92.4%, which is higher than that of commercial Pt/C (90.9%). The current retention rates of STFN2 and STFN1 are 89.2% and 87.4%, respectively. The OER durability of the STFN1, STFN2, and STFN3 catalysts was also evaluated by 1000 cycles of continuous cyclic potential between 0.4 and 1 V (vs. RHE) in 0.1 M KOH saturated with O2 at a scanning rate of 100 mV s−1. After 1000 cycles, as shown in Fig. 7(b–d), at a current density of 10 mA cm−2, the LSV curves of STFN3, STFN2, and STFN1 show positive shifts of 18, 33, and 67 mV, respectively. Again, perovskite STFN3 shows the highest activity after the accelerated stability test, owing to its excellent activity and good stability. The A-site removal strategy can effectively improve the stability of the original STFN perovskite for the ORR and OER.
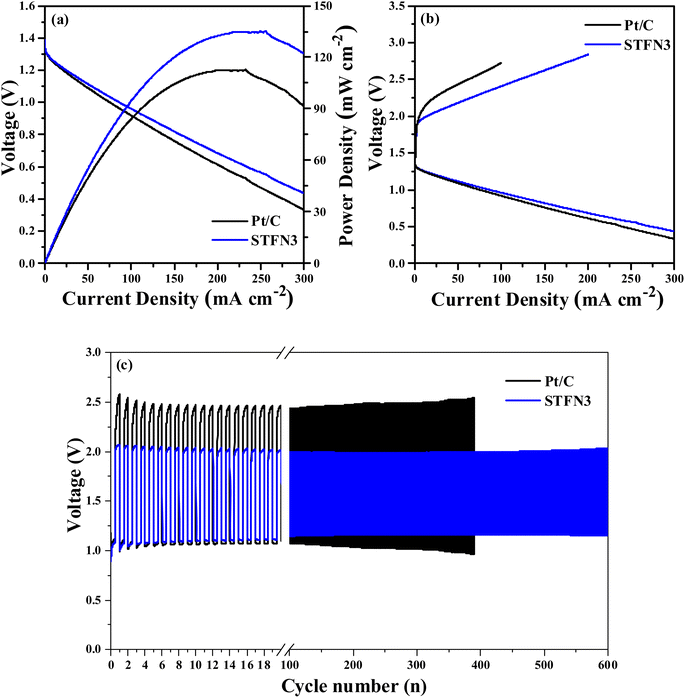
For practical applications, a zinc–air battery was assembled with STFN3 and 20 wt% commercial Pt/C as the air cathode. Fig. 8a shows the I–V–P polarization curves, and it can be seen that the voltage of the batteries decreases with increasing current density. The power density of the STFN3 batteries reaches a maximum of 135 mW cm−2. This value is higher than the maximum Pt/C battery power density of 113 mW cm−2. To further study the discharge capacity of the zinc–air battery, an electrochemical workstation was used to acquire charge–discharge polarization curves. As shown in Fig. 8b, the first charge and discharge curves of the zinc–air battery were obtained when STFN3 and Pt/C were used as cathode catalysts. A comparison of the charge–discharge polarization curves of the Pt/C zinc–air battery and the STFN3 zinc–air battery suggests the latter has better charging capacity and weaker discharge capacity. In general, compared to the Pt/C zinc–air battery, the STFN3 zinc–air battery has a smaller charge–discharge voltage gap and higher charge–discharge efficiency. The cycling stability was evaluated by pulse charge–discharge measurements at a high current density of 5 mA cm−2. As shown in Fig. 8c, the initial discharge voltages of the STFN3 zinc–air battery and Pt/C zinc–air battery are 1.07 and 1.12 V, respectively, and the initial charging voltages are 2.03 and 2.44 V, respectively. The voltage gaps can be calculated as 0.96 and 1.32 V, showing that the STFN3 zinc–air battery has a smaller charge–discharge voltage gap. The STFN3 zinc–air battery exhibited stable performance up to 600 charge and discharge cycles. After 600 cycles, the charge and discharge voltages were 1.13 V and 2.12 V, respectively, and the voltage gap was 0.99 V, which is different from the initial gap. There was almost no change in the charge–discharge voltage gap. The corresponding Pt/C zinc–air battery did not exhibit stable performance after 400 cycles of the voltage gap, and the voltage gap during cycling became significantly larger than that of the STFN3 zinc–air battery. Thus, the STFN3 catalyst exhibited excellent cycle stability when used in rechargeable zinc–air batteries.
4 Conclusions
In summary, STFN perovskites calcined at different temperatures and A-site cation-deficient perovskites Sr1−xTi0.3Fe0.6Ni0.1O3−δ (x = 0.05 and 0.1) were prepared using the sol–gel method. The electrochemical results showed that 800 °C was the optimal synthesis temperature for the STFN perovskite. The experimental results showed that Sr0.9Ti0.3Fe0.6Ni0.1O3−δ had the highest ORR and OER activities, thereby meeting the requirements for the best bifunctional catalyst in an alkaline medium. The number of oxygen vacancies and electrochemical performance were further improved. The perovskite exhibited a high power density and good stability, rendering it promising for use in Zn–air batteries.Conflicts of interest
There are no conflicts of interest to declare.Acknowledgements
This work was supported by Jilin Scientific and Technological Development Program (20210508032RQ) and National Natural Science Foundation of China Youth Program (52202238).References
- L. Wei, E. H. Ang, Y. Yang, Y. Qin, Y. Zhang, M. Ye, Q. Liu and C. C. Li, J. Power Sources, 2020, 477, 228696 CrossRef CAS.
- Z. Zhu, J. Cui, X. Cao, L. Yang, H. Sun, W. Liang, J. Li and A. Li, Int. J. Hydrogen Energy, 2022, 47, 9504–9516 CrossRef CAS.
- Z. Deng, Q. Yi, G. Li, Y. Chen, X. Yang and H. Nie, Electrochim. Acta, 2018, 279, 1–9 CrossRef CAS.
- M. Shao, Q. Chang, J.-P. Dodelet and R. Chenitz, Chem. Rev., 2016, 116, 3594–3657 CrossRef CAS PubMed.
- H. Wang, W. Xu, S. Richins, K. Liaw, L. Yan, M. Zhou and H. Luo, Electrochim. Acta, 2019, 296, 945–953 CrossRef CAS.
- P. Gu, M. Zheng, Q. Zhao, X. Xiao, H. Xue and H. Pang, J. Mater. Chem. A, 2017, 5, 7651–7666 RSC.
- A. Belotti, Y. Wang, A. Curcio, J. Liu, E. Quattrocchi, S. Pepe and F. Ciucci, Int. J. Hydrogen Energy, 2022, 47, 1229–1240 CrossRef CAS.
- S. Gupta, W. Kellogg, H. Xu, X. Liu, J. Cho and G. Wu, Chem.–Asian J., 2016, 11, 10–21 CrossRef CAS PubMed.
- X. He, J. Fu, M. Niu, P. Liu, Q. Zhang, Z. Bai and L. Yang, Electrochim. Acta, 2022, 413, 140183 CrossRef CAS.
- Q.-Q. Fu, H. Gu, J.-J. Xing, Z. Cao and J. Wang, Acta Mater., 2022, 229, 117785 CrossRef CAS.
- H. Osgood, S. V. Devaguptapu, H. Xu, J. Cho and G. Wu, Nano Today, 2016, 11, 601–625 CrossRef CAS.
- S. Zhuang, Z. Wang, J. He, D. Jia, Q. Wang, M. Lu and F. Tu, Sustainable Mater. Technol., 2021, 29, 00282 Search PubMed.
- D. Chen, J. Wang, Z. Zhang, Z. Shao and F. Ciucci, Chem. Commun., 2016, 52, 10739–10742 RSC.
- H. Miao, X. Wu, B. Chen, Q. Wang, F. Wang, J. Wang, C. Zhang, H. Zhang, J. Yuan and Q. Zhang, Electrochim. Acta, 2020, 333, 135566 CrossRef CAS.
- J. Gao, Y. Zhang, X. Wang, L. Jia, H. Jiang, M. Huang and A. Toghan, Mater. Today Energy, 2021, 20, 100695 CrossRef CAS.
- S.-L. Zhang, D. Cox, H. Yang, B.-K. Park, C.-X. Li, C.-J. Li and S. A. Barnett, J. Mater. Chem. A, 2019, 7, 21447–21458 RSC.
- G. Yang, C. Su, Y. Chen, F. Dong, M. O. Tade and Z. Shao, J. Eur. Ceram. Soc., 2015, 35, 2531–2539 CrossRef CAS.
- F. Schulze-Küppers, S. F. P. ten Donkelaar, S. Baumann, P. Prigorodov, Y. J. Sohn, H. J. M. Bouwmeester, W. A. Meulenberg and O. Guillon, Sep. Purif. Technol., 2015, 147, 414–421 CrossRef.
- L. dos Santos-Gómez, J. M. Porras-Vázquez, E. R. Losilla and D. Marrero-López, RSC Adv., 2015, 5, 107889–107895 RSC.
- X. Lv, G. Chen, K. Wei, R. Dai, M. Wang, K. Yu and S. Geng, Ceram. Int., 2022, 046, 110819 Search PubMed.
- J.-H. Zhang, F.-Z. Han, C.-X. Li and S.-L. Zhang, J. Eur. Ceram. Soc., 2022, 22, 004988 Search PubMed.
- T. Zhu, H. E. Troiani, L. V. Mogni, M. Han and S. A. Barnett, Joule, 2018, 2, 478–496 CrossRef CAS.
- L. Li, H. Yang, Z. Gao, Y. Zhang, F. Dong, G. Yang, M. Ni and Z. Lin, J. Mater. Chem. A, 2019, 7, 12343–12349 RSC.
- G. Zhu, X. Fang, C. Xia and X. Liu, Ceram. Int., 2005, 31, 115–119 CrossRef CAS.
- N. Dai, J. Feng, Z. Wang, T. Jiang, W. Sun, J. Qiao and K. Sun, J. Mater. Chem. A, 2013, 1, 14147 RSC.
- W. Ni, T. Zhu, X. Chen, Q. Zhong and W. Ma, J. Power Sources, 2020, 451, 227762 CrossRef CAS.
- X. Wu, H. Miao, R. Hu, B. Chen, M. Yin, H. Zhang, L. Xia, C. Zhang and J. Yuan, Appl. Surf. Sci., 2021, 536, 147806 CrossRef CAS.
- D. K. Bediako, Y. Surendranath and D. G. Nocera, J. Am. Chem. Soc., 2013, 135, 3662–3674 CrossRef CAS PubMed.
- C. C. McCrory, S. Jung, I. M. Ferrer, S. M. Chatman, J. C. Peters and T. F. Jaramillo, J. Am. Chem. Soc., 2015, 137, 4347–4357 CrossRef CAS PubMed.
- Q. Wang, Y. Xue, S. Sun, S. Li, H. Miao and Z. Liu, Electrochim. Acta, 2017, 254, 14–24 CrossRef CAS.
- S. Peng, X. Han, L. Li, S. Chou, D. Ji, H. Huang, Y. Du, J. Liu and S. Ramakrishna, Adv. Energy Mater., 2018, 8, 147806 Search PubMed.
- W. Xu, N. Apodaca, H. Wang, L. Yan, G. Chen, M. Zhou, D. Ding, P. Choudhury and H. Luo, ACS Catal., 2019, 9, 5074–5083 CrossRef CAS.
- Z. Du, P. Yang, L. Wang, Y. Lu, J. B. Goodenough, J. Zhang and D. Zhang, J. Power Sources, 2014, 265, 91–96 CrossRef CAS.
- Y. L. Zhu, W. Zhou, J. Yu, Y. B. Chen and M. L. Liu, Chem. Mater., 2016, 28, 1691–1697 CrossRef CAS.
- G. Q. Yang, J. Feng, W. Sun, N. N. Dai and M. Y. Hou, J. Power Sources, 2014, 2, 771–777 CrossRef.
- M. Yuasa, M. Nishida and T. Kida, J. Electrochem. Soc., 2011, 158, A605 CrossRef CAS.
- L. Yan, Y. Lin, X. Yu, W. Xu, T. Salas, H. Smallidge, M. Zhou and H. Luo, ACS Appl. Mater. Interfaces, 2017, 9, 23820–23827 CrossRef CAS PubMed.
- J. Tulloch and S. W. Donne, J. Power Sources, 2009, 188, 359–366 CrossRef CAS.
- Z. Wu, L.-P. Sun, T. Xia, L.-H. Huo, H. Zhao, A. Rougier and J.-C. Grenier, J. Power Sources, 2016, 334, 86–93 CrossRef CAS.
- Y. Zhu, W. Zhou, J. Yu, Y. Chen, M. Liu and Z. Shao, Chem. Mater., 2016, 28, 1691–1697 CrossRef CAS.
- Z. Li, Y. Zhang, T. Pan, H. Lu, M. Wu and J. Zhang, Aerosp. Sci. Technol., 2018, 82–83, 199–209 CrossRef.
- S. She, J. Yu, W. Tang, Y. Zhu, Y. Chen, J. Sunarso, W. Zhou and Z. Shao, ACS Appl. Mater. Interfaces, 2018, 10, 11715–11721 CrossRef CAS PubMed.
- R. Liu, F. Liang, W. Zhou, Y. Yang and Z. Zhu, Nano Energy, 2015, 12, 115–122 CrossRef CAS.
- Y. Zhu, W. Zhou, J. Sunarso, Y. Zhong and Z. Shao, Adv. Funct. Mater., 2016, 26, 5862–5872 CrossRef CAS.
- J. Hu, Q. Liu, Z. Shi, L. Zhang and H. Huang, RSC Adv., 2016, 6, 86386–86394 RSC.
- H. Falcon, Appl. Catal., B, 2004, 53, 37–45 CrossRef CAS.
- T. Yamashita and P. Hayes, Appl. Surf. Sci., 2008, 254, 2441–2449 CrossRef CAS.
- J. Suntivich and K. May, Science, 2011, 334, 1383–1385 CrossRef CAS PubMed.
- D. Zhang, Y. Song, Z. Du, L. Wang, Y. Li and J. B. Goodenough, J. Mater. Chem. A, 2015, 3, 9421–9426 RSC.
- S. Zhen, W. Sun, G. Tang, D. Rooney, K. Sun and X. Ma, Int. J. Hydrogen Energy, 2016, 41, 9538–9546 CrossRef CAS.
- B. Wang, G. Long, Y. Li, H. Jia, D. Qiu, J. Wang, G. Liu, K. Wang and Y. Ji, Int. J. Hydrogen Energy, 2018, 43, 6677–6685 CrossRef CAS.
- Z. Chen, A. Yu, D. Higgins, H. Li, H. Wang and Z. Chen, Nano Lett., 2012, 12, 1946–1952 CrossRef CAS PubMed.
- S. Sun and M. A. Karsdal, Biochem. Collagens, Laminins Elastin, 2016, 5, 49–55 Search PubMed.
- J. Yang, J. Hu, M. Weng, R. Tan, L. Tian, J. Yang, J. Amine, J. Zheng, H. Chen and F. Pan, ACS Appl. Mater. Interfaces, 2017, 9, 4587–4596 CrossRef CAS PubMed.
- Y. Zhu, W. Zhou, Z. G. Chen, Y. Chen, C. Su, M. O. Tade and Z. Shao, Angew. Chem., Int. Ed. Engl., 2015, 54, 3897–3901 CrossRef CAS PubMed.
Footnote |
| † Electronic supplementary information (ESI) available. See DOI: https://doi.org/10.1039/d2ra07014f |
| This journal is © The Royal Society of Chemistry 2022 |

