Highly efficient hydrogenation of phenol to cyclohexanol over Ni-based catalysts derived from Ni-MOF-74
Shuai
Wang
 a,
Lidong
Yang
b,
Tianhan
Zhu
a,
Nan
Jiang
a,
Feng
Li
a,
Huan
Wang
a,
Lidong
Yang
b,
Tianhan
Zhu
a,
Nan
Jiang
a,
Feng
Li
a,
Huan
Wang
 a,
Chunlei
Zhang
a and
Hua
Song
*a
aProvincial Key Laboratory of Oil & Gas Chemical Technology, College of Chemistry & Chemical Engineering, Northeast Petroleum University, Daqing 163318, Heilongjing, China. E-mail: songhua2004@sina.com; Tel: +0459 6503167
bChina Petroleum Technology and Development Corporation, Beijing 100028, China
First published on 5th October 2021
Abstract
The design of highly efficient noble-metal-free catalysts for fast hydrogenation of phenol to cyclohexanol is of great significance and quite challenging. Nickel-based Ni@C-T catalysts derived from Ni-MOF-74 with different pyrolysis temperatures (T) were prepared and characterized by various methods. The effect of T on the selective hydrogenation of phenol over Ni@C-T was studied. The results showed that metallic Ni is identified as the main activity site for the hydrogenation of phenol and the active metallic Ni was formed at the pyrolysis temperature higher than 400 °C. Ni@C-400 exhibited the best performance under mild conditions. The conversion of phenol reached 100% with a cyclohexanol selectivity of 100% under the reaction conditions of a temperature of 120 °C, a H2 pressure of 2.0 MPa and a time of 2 h, which are more excellent than those of reported catalysts. Furthermore, Ni@C-400 showed perfect reusability. The excellent catalytic performance of Ni@C-400 was associated with its high surface area and better dispersion of active sites due to the metal–organic framework.
1. Introduction
The hydrogenation of phenol constitutes one of the most desirable reactions due to the large demand for its hydrogenated products such as cyclohexanol.1 It is an indispensable intermediate to synthesize adipic acid and caprolactam, which are important raw materials for the production of nylon 6 and nylon 66 in the polymer industry.2 Particularly, cyclohexanol is also utilized to manufacture plasticizers, surfactants, detergents and emulsion stabilizers in industrial production.3 At present, the selective oxidation of cyclohexane and hydrogenation of phenol have been successfully applied to produce cyclohexanol.4 However, the oxidation of cyclohexane requires harsh reaction conditions and suffers from low product yields and complicated steps.5 Therefore, catalytic hydrogenation of phenol to produce cyclohexanol is considered as the most promising and efficient approach in view of higher atom utilization. Moreover, phenol is one of the most abundant raw materials from natural lignin,6 which provides sufficient feedstocks for the selective hydrogenation of phenol.Traditionally, catalytic hydrogenation reactions of phenol are usually carried out in the gas phase at higher temperatures and pressures employing supported Pd catalysts, which easily lead to the deactivation of the catalysts owing to coke deposition. Therefore, much attention over the last decades has been paid to exploring liquid phase hydrogenation reactions of phenol under relatively mild conditions using noble metal catalysts, such as Pt,7 Pd,8 Rh,9 and Ru.10 However, the scarcity and high price of precious metals limit their industrial applications. In terms of this issue, catalysts based on low price non-noble metals have attracted great attention. Among which, nickel-based catalysts showed an excellent hydrogenation performance with a desirable resistance to inactivation and poisoning due to their unique electronic structures.11 However, nickel nanoparticles can be easily oxidized when exposed to air without any protective measures, which seriously affects their applications. This can be addressed by confining the nickel nanoparticles in a carbon matrix to form a core–shell structure.
Metal–organic frameworks (MOFs) are a newly discovered class of porous materials with the characteristics of adjustable structure and tunable components. The derived metal nanoparticles via direct pyrolysis of MOFs precursor under nitrogen atmosphere exhibited unique advantages in preparation highly dispersed metal nanoparticles without the addition of additional carbon sources.12 Carbon-based metal catalysts derived from MOFs are widely used in many fields, such as gas adsorption separation,13 heterogeneous catalysis,14 photocatalysis,15 electrochemistry,16 and energy storage.17 Due to the strong coordination between metals and organic ligands, and the confinement effect of the network structure of MOFs, the metal nanoparticles derived from MOFs are confined in a narrow range, which can effectively prevent the nanoparticles from gathering and growing. This is beneficial to the synthesis of highly dispersed metallic active nanoparticles with high loading, which are different from the traditional supported metal catalysts.19 For instance, Wang et al.20 prepared Co/C–N-T (T is the pyrolysis temperature) catalysts by direct pyrolysis of ZIF-67 under a N2 atmosphere for the selective hydrogenation of nitroarenes. The as-prepared Co/C–N-600 showed >99% conversion with 97% selectivity to the target product 4-aminostyrene under optimal conditions. Ahsan et al.21 used Co-BDC MOFs as sacrifice templates to synthesize C@Co catalysts for the reduction of 4-nitrophenol and methyl orange. The results revealed that the Co@C catalysts could effectively promote the reduction of the two substrates and showed excellent recyclability. Li et al.22 synthesized bimetallic Ni–Co alloy nanoparticles (NPs) embedded in an N-doped carbon matrix from a MOF precursor. The as-prepared 1Co–1Ni@NC alloy catalyst showed 100% phenol conversion and over 99.9% cyclohexanol selectivity. However, the surface areas of the alloy catalysts are low (<91 m2 g−1), which would greatly affect the dispersion of active sites, and the reaction takes a longer time of 12 h. These successful applications of MOFs in hydrogenation reactions have motivated our great interest. Among various MOFs used to derive carbon-based metal catalysts, MOF-74 has attracted much attention due to its unique merit of coordinatively unsaturated (open) metal sites with various metals (Fe, Co, Ni and Cu), which can be changed without influencing the original framework structure.18 This special characteristic of MOF-74 provides a particular advantage for the preparation of catalysts with different active metal centers, which is needed for various catalytic reactions. Nickel-based catalysts are active metal catalysts commonly used in industries. However, the use of Ni-MOF-74 as a sacrificial template to prepare catalysts for phenol hydrogenation is rarely reported.
Herein, Ni-MOF-74, consisting of Ni2+ cations and the organic ligand dobdc4− (2,5-dioxido-1,4-benzenedicarboxylate), was chosen as the sacrificial template to prepare Ni@C-T catalysts for liquid phase phenol hydrogenation under mild conditions. The effect of pyrolysis temperatures on the phenol hydrogenation performance over the as-prepared catalysts was investigated systematically. The results exhibited that the catalyst obtained at a pyrolysis temperature of 400 °C showed the best hydrogenation performance. Under the reaction conditions of a temperature of 120 °C, a H2 pressure of 2.0 MPa and a time of 2 h, the conversion of phenol reached 100% with a cyclohexanol selectivity of 100%. It is worth noting that Ni@C-400 showed more excellent phenol hydrogenation performance than most of the reported non-noble metal catalysts.
2. Materials and methods
2.1 Reagents and materials
Nickel acetate (C4H6O4Ni·4H2O, AR) was purchased from Beijing Shuanghuan Chemical Reagent Company. 2,5-dihydroxyterephthalic acid (H4DOBDC, AR) was obtained from Sinopharm Chemical Reagent Co., Ltd., China. Tetrahydrofuran (THF, AR) was purchased from Harbin Chemical Reagent Factory. Phenol was bought from Guangdong Jinsha Chemical Plant. Decalin (C10H18, AR) was obtained from Beijing Chemical Plant. Deionized water (DI) used in the experiments was obtained from an ultrapure water polishing system, which was made by Shanghai Xunhui Environment Technology Co., Ltd. High purity hydrogen (H2) and nitrogen (N2) were purchased from Daqing Xuelong Company. All the chemicals were used directly without further purification.2.2 Preparation of the catalysts
Ni-MOF-74 was prepared using a green solvothermal method according to a reported procedure with a slight modification.23 Typically, 0.522 g of 2,5-dihydroxyterephthalic acid was dissolved in 35 ml tetrahydrofuran, and 1.306 g nickel acetate was dissolved in 35 ml deionized water, then the two solutions were mixed together and further stirred at room temperature for 30 min, and the mixed solution was further loaded into a 150 ml Teflon-lined stainless steel autoclave, which was heated to 110 °C for 1 day. Next, the autoclave was removed from the oven and allowed to cool down to room temperature, and the resulting precipitates were collected by filtration and washed with water and ethanol subsequently 3 times, and the finally obtained crystals were subjected to vacuum drying at 80 °C for 12 h to obtain Ni-MOF-74.The catalysts treated at different pyrolysis temperatures (T) were prepared by the direct pyrolysis of Ni-MOF-74 under a constant nitrogen flow of 50 ml min−1. Briefly, the prepared Ni-MOF-74 was placed into a tubular resistance furnace and heated to 300 °C, 400 °C, 500 °C, 600 °C, and 700 °C, respectively, at a heating rate of 3 °C min−1 and kept for 2 hours. After the pyrolysis process, Ni-MOF-74 was converted to nickel-based carbon materials. The obtained catalysts were denoted Ni@C-T, where T is the pyrolysis temperature of Ni-MOF-74.
2.3 Catalyst characterization
Thermogravimetric analysis (TGA) was carried out on a NETZSCH TG 209F3 instrument. The sample (∼10 mg) was placed in a ceramic crucible and heated from 20 °C to 600 °C with a ramp rate of 10 °C min−1 under air (flow rate = 30 ml min−1).The powder X-ray diffraction (XRD) patterns were recorded on an automated powder X-ray diffractometer (40 kV, 40 mA, Bruker-D8) using a Cu Kα radiation source (λ = 1.54056 Å) in the range of 5–80° with a step size of 2 °C min−1.
The surface area and pore volume were measured with low temperature nitrogen adsorption/desorption. The specific surface area was determined from the linear portion of the standard Brunauer–Emmett–Teller (BET) plot. The total pore volumes and the average pore sizes were calculated from the desorption branch of the adsorption isotherm using the Barrett–Joyner–Halenda (BJH) formula. Before the adsorption measurements, the sample was degassed at 180 °C under vacuum for 3 h. The pressure range used for the BET measurements was 9.849–100.566 kPa. The Ni metal contents were measured by inductively coupled plasma mass spectrometry (ICP-MS) using a PerkinElmer NexION 300 instrument. Prior to analysis, the sample was digested with nitric acid using a microwave heating system.
Scanning electron microscopy (SEM) with energy-dispersive X-ray spectroscopy (EDS) was utilized to study the morphology and the elemental compositions of the prepared nanocatalysts (Model: Hitachi S-4800).
Transmission electron microscopy (TEM) was performed to observe the morphologies and distribution of the Ni NPs (JEOL JEM-4000EX).
X-ray photoelectron spectroscopy (XPS) was conducted on a Thermo VG Scientific ESCA MultiLab-2000 spectrometer with a monochromatized Al Kα source (1486.6 eV) at a constant analyzer pass energy of 25 eV. The binding energy was estimated to be accurate within 0.2 eV. The Ni 2p and O 1s spectra were acquired, and C 1s was set at 284.6 eV and taken as a reference for binding energy (BE) calibration. The software XPS PEAK was used to fit the XPS spectra using a combination of Gaussian and Lorentzian functions in a 40/60 ratio and a Shirley background.
2.4 Catalytic activity tests
The selective hydrogenation of phenol over the Ni@C-T catalysts was performed in a 50 mL stainless steel autoclave equipped with a pressure gauge, temperature controller, and mechanical stirrer. A series of experiments were conducted to optimize the reaction conditions through the variation of the pyrolysis temperature and reaction temperature. In a typical experiment, 10 mg Ni@C-T catalyst and 10 mL decalin solution containing 3 wt% phenol were loaded into a stainless steel autoclave, then the autoclave was sealed and vacuumed, and it was purged three times with H2 and finally pressurized with 2.0 MPa of H2 gas. Subsequently, the mixture in the autoclave was stirred at a required temperature. After the reaction, the mixture solution was filtered through centrifugation to separate the catalyst. The resulting products were analyzed by gas chromatography to calculate the conversion and the selectivity to the products.The recyclability and reusability of the Ni@C-400 catalyst was investigated under the same conditions. After each run, the Ni@C-400 catalyst was separated from the mixture solution using a magnet, washed three times with deionized water, dried at 80 °C, and reused for the next run.
3. Results and discussion
3.1 TGA and differential thermogravimetric analysis (TGA-DTG)
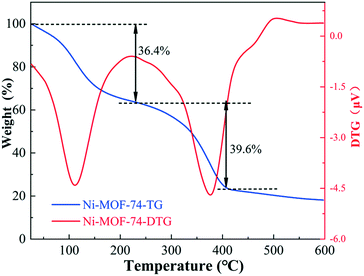
The most important factor in the acquisition of carbon-based materials derived from MOF materials is the pyrolysis temperature. The thermal stability of Ni-MOF-74 was investigated by using the TG-DTG method, and the result is presented in Fig. 1; it can be found that Ni-MOF-74 mainly undergoes two weight loss processes. The first weight loss of 36.4% before 230 °C is considered as the result of the dehydration of the physically adsorbed water and remaining small molecule organics. The successive weight loss of 39.6% from 228 °C to 405 °C is attributed to the decomposition of the organic framework. As the temperature increases to higher than 400 °C, the weight loss becomes very slow, demonstrating that the decomposition of the organic framework is basically completed.3.2 X-ray diffraction (XRD)
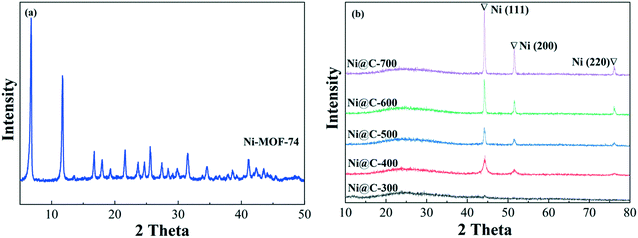
Fig. 2 displays the XRD patterns of the pristine Ni-MOF-74 and Ni@C-T. The XRD pattern of Ni-MOF-74 (Fig. 2a) showed two significant peaks at 2θ = 6.8° and 11.8°, which can be ascribed to the typical crystal faces of MOF-74(Ni).24 The XRD pattern matched perfectly with that reported in the literature,25 proving the successful preparation of Ni-MOF-74. The XRD patterns of the Ni@C-T catalysts showed a broad peak at 25 °C, which may be assigned to the graphitic carbon. No significant peaks can be seen for Ni@C-300, which indicated that the Ni species has not transformed into any crystalline state owing to the lower temperature. By further increasing the pyrolysis temperature to 400 °C, the XRD patterns (Fig. 2b) of the Ni@C-T catalysts showed three prominent peaks at approximately 44.5°, 51.8° and 76.4°, which can be assigned to the (111), (200) and (220) crystal planes of the metallic Ni (JCPDS No. 04-0850), respectively.26 Combined with the TG result, it can be concluded that the transformation of Ni species into metallic Ni is basically completed at 400 °C. With the further increase of the pyrolysis temperature, the peaks of metallic Ni become sharper, indicating the increase in the crystallinity and size of the Ni particles (Dc) (Table 1). The Dc values can be further calculated from the Scherrer equation, which decreased in the order Ni@C-700 (24.7 nm) > Ni@C-600 (10.9 nm) > Ni@C-500 (8.4 nm) > Ni@C-400 (5.9 nm). This result showed that a lower temperature is beneficial to the formation of smaller and highly dispersed Ni particles.| Sample | S BET (m2 g−1) | V p (cm3 g−1) | Pore sizea (nm) | Particle sizeb (nm) | Ni contentc (wt%) |
|---|---|---|---|---|---|
| a Obtained by 4VBJH/SBET. b Interplanar spacing, calculated using the Scherrer equation. c Obtained by ICP-MS analysis. | |||||
| Ni-MOF-74 | 530.7 | 0.271 | 1.61 | — | — |
| Ni@C-300 | 195.0 | 0.156 | 3.19 | — | 50.3 |
| Ni@C-400 | 86.5 | 0.099 | 4.62 | 5.9 | 52.8 |
| Ni@C-500 | 11.3 | 0.045 | 16.2 | 8.4 | 54.2 |
| Ni@C-600 | 8.3 | 0.042 | 20.6 | 10.9 | 56.3 |
| Ni@C-700 | 8.6 | 0.040 | 21.5 | 24.7 | 57.7 |
| Spent catalyst | 84.2 | 0.094 | 4.50 | 6.0 | 52.5 |
3.3 Brunauer–Emmett–Teller (BET)
The N2 adsorption and desorption isotherms and pore size distributions of the Ni-MOF-74 and Ni@C-T catalysts are shown in Fig. 3, and the textural properties of these samples are summarized in Table 1. Ni-MOF-74 displayed a typical type-I isotherm, indicating the existence of micropores. However, all the Ni@C-T samples exhibited typical type IV isotherms with an obvious hysteresis loop within the range of 0.4–1.0 P/P0, corresponding to their notable mesoporous structures. As can be seen from Table 1, the surface area and micropore volume of Ni-MOF-74 were 530.7 m2 g−1 and 0.271 cm3 g−1, respectively. The surface area and pore volume of Ni-MOF-74 decreased significantly after pyrolysis. Meanwhile, the average pore diameter was found to increase due to the collapse of the micropores of Ni-MOF-74 as well as the formation of large metal particles. In addition, with the increase of pyrolysis temperature, the surface area and pore volume of Ni@C-T decreased significantly, which would lead to the decrease in hydrogenation performance.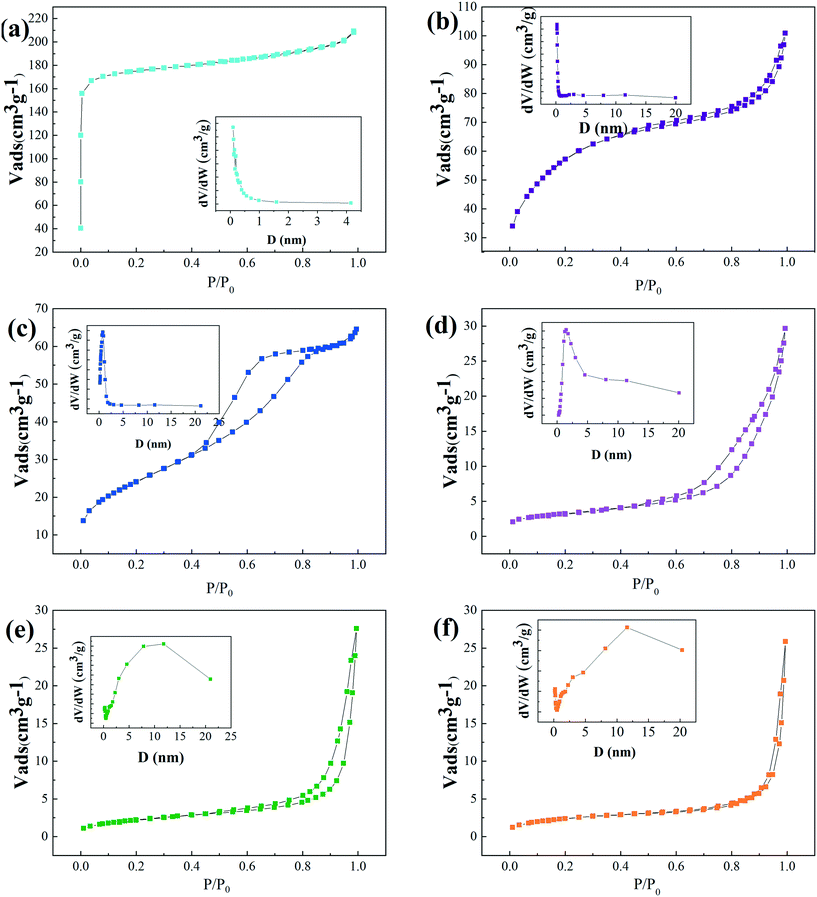 | ||
| Fig. 3 N2 adsorption–desorption isotherms and pore size distributions of (a) Ni-MOF-74, (b) Ni@C-300, (c) Ni@C-400, (d) Ni@C-500, (e) Ni@C-600, and (f) Ni@C-700. | ||
3.4 Inductively coupled plasma mass spectrometry (ICP-MS)
Additionally, the ICP-MS analysis was performed to determine the loading of Ni and the results are shown in Table 1. The Ni content was found to be 50.3%, 52.8%, 54.2%, 56.3% and 57.7% for Ni@C-300, Ni@C-400, Ni@C-500, Ni@C-600 and Ni@C-700, respectively. This suggested that the metal catalysts derived from MOF materials possessed high metal loading with small particle sizes (see TEM analysis). However, it is impossible for conventional supported catalysts to achieve such small nanoparticles with this high loading of Ni.3.5 Scanning electron microscopy (SEM)
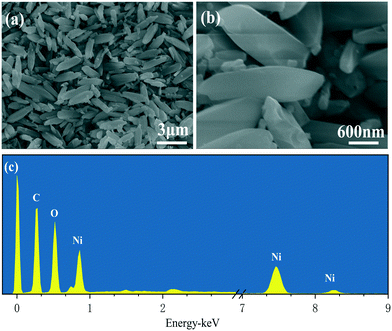
The morphology of Ni-MOF-74 was investigated by scanning electron microscopy (SEM), as shown in Fig. 4a and b. The Ni-MOF-74 crystals were shuttle-like with a uniform particle size. The chemical composition of the freshly prepared Ni-MOF-74 was investigated by EDS, and the result is shown in Fig. 4c. The spectrum revealed that the precursor is primarily composed of Ni, O and C elements.3.6 TEM and HRTEM
The microstructures and particle size distribution of the Ni particles in Ni@C-400 and Ni@C-600 were further revealed by TEM and HRTEM. As displayed in Fig. 5a and b, the Ni nanoparticles were highly dispersed with an average size of 5.76 nm for the Ni@C-400 catalyst. While for Ni@C-600 (Fig. 5c and d), the Ni particles were much larger (10.59 nm), which might be ascribed to the partial aggregation of the particles at higher pyrolysis temperature. The results were consistent with the XRD result. In the HRTEM images (Fig. 5e and f), the lattice spacing of 0.342 nm corresponds to graphene, while the lattice spacing of 0.201 nm corresponds to the (111) crystal planes of the Ni nanoparticles. This clearly showed that the Ni nanoparticles were coated by graphene shells.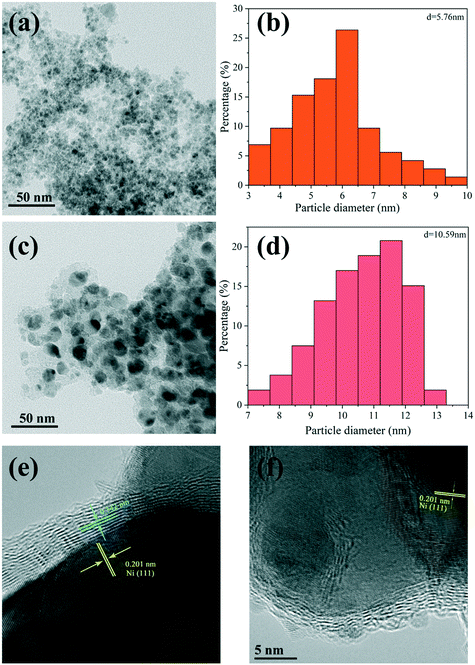 | ||
| Fig. 5 TEM images, corresponding particle size distributions and HRTEM images of Ni@C-400 (a, b and e) and Ni@C-600 (c, d and f). | ||
3.7 X-ray photoelectron spectroscopy (XPS)
XPS analysis was further employed to investigate the surface composition and the chemical states of the samples. As illustrated in Fig. 6a, it can be identified that all the samples consisted of C, O and Ni, which was consistent with the EDS result. The high-resolution XPS spectra for C 1s of Ni@C-300 and Ni@C-400 are depicted in Fig. 6b. It can be seen that the peaks at 284.7 eV, 285.4 eV and 288.4 eV can be attributed to C![[double bond, length as m-dash]](https://www.rsc.org/images/entities/char_e001.gif) C, C
C, C![[double bond, length as m-dash]](https://www.rsc.org/images/entities/char_e001.gif) O and C–O, respectively.27 The Ni 2p XPS spectrum of Ni@C-300 is shown in Fig. 6c, and the two peaks at around 856.30 (Ni 2p3/2) and 874 (Ni 2p1/2) eV were ascribed to the Ni2+ species in MOF-74,25 which indicated that Ni-MOF-74 was not decomposed completely. The Ni 2p spectrum of Ni@C-400 could be divided into 2p1/2 and 2p3/2. As can be seen from Fig. 6d, the characteristic peaks at 854.5 eV and 871.7 eV were ascribed to Ni0 of 2p3/2 and Ni0 of 2p1/2,28 respectively, while the weak peaks located at 855.4 eV and 873.5 eV were attributed to Ni2+ of 2p3/2 and Ni2+ of 2p1/2 in NiO,27 which were from the oxidation of the surface metallic Ni because of the exposure to air. Moreover, the absence of the NiO peaks in the XRD patterns was probably due to their amorphous nature.29
O and C–O, respectively.27 The Ni 2p XPS spectrum of Ni@C-300 is shown in Fig. 6c, and the two peaks at around 856.30 (Ni 2p3/2) and 874 (Ni 2p1/2) eV were ascribed to the Ni2+ species in MOF-74,25 which indicated that Ni-MOF-74 was not decomposed completely. The Ni 2p spectrum of Ni@C-400 could be divided into 2p1/2 and 2p3/2. As can be seen from Fig. 6d, the characteristic peaks at 854.5 eV and 871.7 eV were ascribed to Ni0 of 2p3/2 and Ni0 of 2p1/2,28 respectively, while the weak peaks located at 855.4 eV and 873.5 eV were attributed to Ni2+ of 2p3/2 and Ni2+ of 2p1/2 in NiO,27 which were from the oxidation of the surface metallic Ni because of the exposure to air. Moreover, the absence of the NiO peaks in the XRD patterns was probably due to their amorphous nature.29
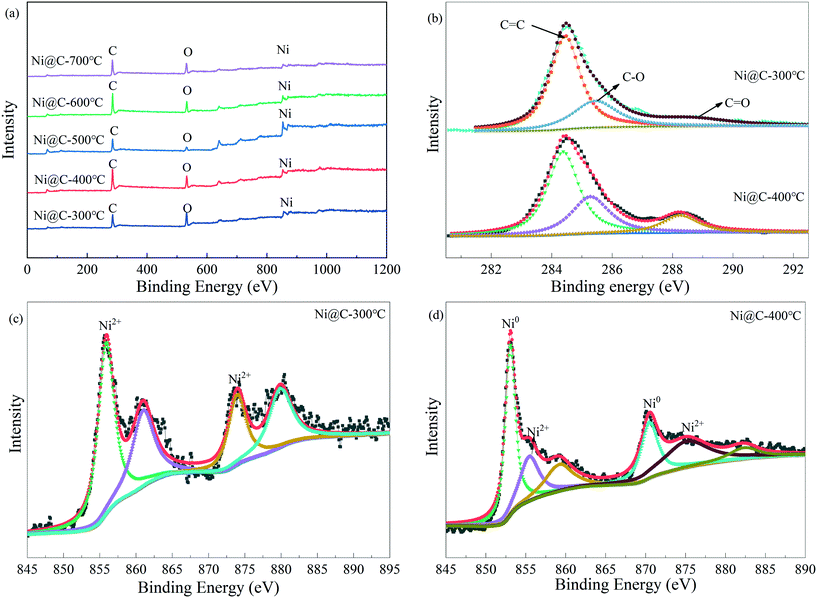 | ||
| Fig. 6 High-resolution XPS spectra of Ni@C-400: survey spectra of Ni@C-T (a), C 1s spectra of Ni@C-300 and Ni@C-400 (b), and Ni 2p spectra of Ni@C-300 (c) and Ni@C-400 (d). | ||
3.8 Phenol hydrogenation
The catalytic activity experiments of the Ni-MOF-74 and Ni@C-T catalysts were carried out in the liquid phase phenol hydrogenation reaction, and the results are also shown in Fig. 7. The reaction conditions are T = 120 °C, p = 2 MPa, and t = 2 h. Firstly, the catalytic performance of Ni-MOF-74 showed that the parent Ni-MOF-74 gave no conversion of phenol, indicating that nickel ions coordinated with DHTA were not active for the phenol hydrogenation. It is interesting to know that Ni@C-300 also exhibited no phenol hydrogenation activity. This may possibly because the Ni species in Ni@C-300 has not been transformed into active metallic Ni at the low pyrolysis temperature of 300 °C as confirmed by the XRD characterization. When the pyrolysis temperature is raised to 400 °C, phenol was completely converted with the cyclohexanol selectivity of 100%. However, with the further increase of the pyrolysis temperature, a significant decline in the phenol conversion and cyclohexanol selectivity was observed. Generally, the decrease of the specific area does have a negative effect on the catalytic performance. With the increase in the pyrolysis temperature, the surface area and micropore volume of Ni@C-T decreased significantly (Table 1, BET), which would cause poor dispersion of active metallic Ni particles and aggregation of Ni particles (Fig. 2, XRD). This is possibly the main reason for the decrease in phenol conversion and cyclohexanol selectivity at high polymerization temperature.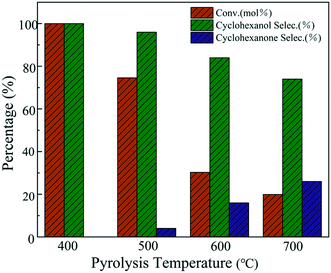 | ||
| Fig. 7 Effects of the pyrolysis temperature on the hydrogenation of phenol over Ni@C-T (reaction conditions: T = 120 °C, p = 2 MPa, t = 2 h). | ||
Both the catalytic activity and selectivity of the catalysts are sensitive to the reaction temperature. The effect of reaction temperature on the hydrogenation performance over Ni@C-400 was studied at a pressure of 2 MPa and reaction time of 2 h (Fig. 8). For all the reaction temperatures, cyclohexanol and cyclohexanone were the two main products with cyclohexanol taking up a greater proportion. At the reaction temperature of 60 °C, the conversion of phenol was 20% with the cyclohexanol selectivity of 82%. With the increasing reaction temperature, the phenol conversion and cyclohexanol selectivity increased, and reached complete conversion of phenol as well as 100% selectivity to cyclohexanol at the reaction temperature of 120 °C. The reason for the enhanced performance with increasing reaction temperature may mainly be ascribed to the increased diffusion rate of phenol in the channels of the catalysts.
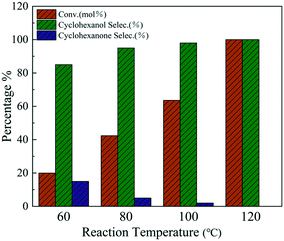 | ||
| Fig. 8 Effects of the reaction temperature on the hydrogenation of phenol over Ni@C-400 (reaction conditions: p = 2 MPa, t = 2 h). | ||
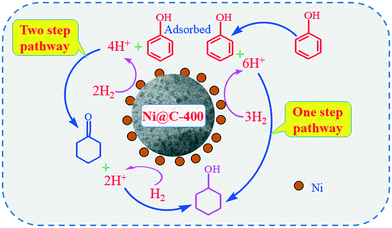
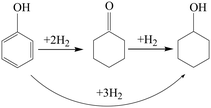
It is well known that there are generally three phenol hydrogenation pathways for producing cyclohexanol: (i) in a two-step pathway, phenol is hydrogenated to cyclohexanone followed by hydrogenation of cyclohexanone to cyclohexanol. (ii) In a one-step pathway, phenol is directly hydrogenated to cyclohexanol. (iii) Phenol is hydrogenated to cyclohexanol via a combination of one-step and two-step pathways.
 | (1) |
 | (2) |
 | (3) |
To study the reaction pathway, the effect of reaction time on the hydrogenation performance over Ni@C-400 was studied at a reaction temperature of 120 °C and pressure of 2 MPa (Fig. 9). At a reaction time of 0.5 h, the phenol conversion and cyclohexanol selectivity over Ni@C-400 were 31% and 68%, respectively. This exhibited that cyclohexanol was found to be predominant in the product at the beginning of the reaction. Therefore, it is reasonable to speculate that H2 molecules dissociated into active H+ over active Ni sites,30 and the phenol was then hydrogenated to cyclohexanol via a combination of one-step and two-step pathways as illustrated in Scheme 1. With the increasing reaction time, the phenol conversion and cyclohexanol selectivity over Ni@C-400 both increased significantly and reached a complete phenol conversion with a 100% cyclohexanol selectivity at a reaction time of 2 h. This demonstrates that the hydrogenation of cyclohexanone to cyclohexanol (ΔG = −1.1 kJ mol−1) is much faster than that of phenol to cyclohexanone (ΔG = −0.8 kJ mol−1) and both are thermodynamically favourable. Therefore, when the reaction time is long enough (2 h), both the hydrogenation pathways will be completed, giving the final product cyclohexanol.
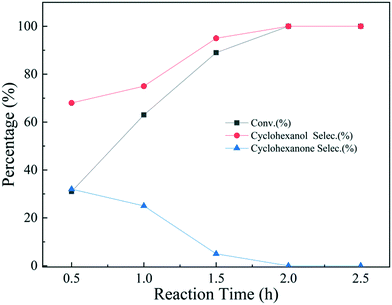 | ||
| Fig. 9 Effects of the reaction time on the hydrogenation of phenol over Ni@C-400 (reaction conditions: T = 120 °C, p = 2 MPa). | ||
The comparison of Ni@C-400 with reported non-noble metal catalysts for phenol hydrogenation is shown in Table 2. It is worth noting that Ni@C-400 showed more excellent phenol hydrogenation performance than most of the reported non-noble metal catalysts, possibly because the Ni@C-400 catalyst derived from the MOF possesses a high specific surface area and more uniformly dispersed active metallic Ni sites. It should be noted that this comparison is not entirely accurate since the hydrogenation conditions and the reaction solvents are somewhat different.
| Catalysts | Time (h) | Temperature (°C) | H2 (MPa) | Conversion (%) | Cyclohexanol selectivity (%) | Phenol to catalyst mass ratio | Ref. | |
|---|---|---|---|---|---|---|---|---|
| 1 | Ni@C-400 | 2 | 120 | 2 | 100 | 100 | 27/1 | This work |
| 2 | RANEY® Ni | 2 | 220 | 2 | 87 | 52 | 1/1 | 31 |
| 3 | Ni/SiO2 | 4 | 200 | 1 | 100 | 100 | 5/1 | 11 |
| 4 | 1Co–1Ni@NC | 12 | 100 | 0.8 | 99.9 | 99.9 | — | 22 |
| 5 | NiCo@C/ZrO2 | 4 | 200 | 2 | 96 | 91 | 1/1 | 32 |
| 6 | NiCo/γ-Al2O3 | 4 | 250 | 2 | 82 | 85 | 1/1 | 33 |
| 7 | CoOx@porous carbon | 16 | 150 | 3 | 98 | 77 | 2/1 | 2 |
3.9 Regeneration performance
Recycling performance is of great significance for catalysts from both environmental and economical aspects.34 The Ni@C-400 catalyst was selected as the typical example to investigate the stability in phenol hydrogenation. The spent Ni@C-400 catalyst was recycled after each run by centrifugation, washed with deionized water and ethanol, and dried at 80 °C under a vacuum atmosphere subsequently. As can be seen in Fig. 10a, there is no appreciable decline in the conversion and selectivity after five successive cycles.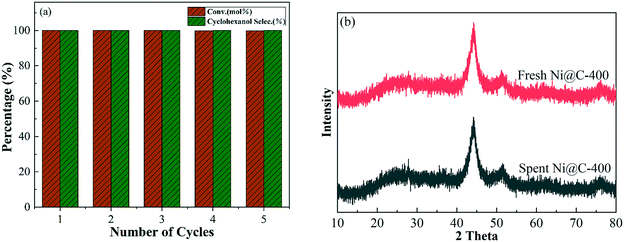 | ||
| Fig. 10 (a) Recycling of the catalyst Ni@C-400. (b) XRD patterns of the fresh Ni@C-400 and spent Ni@C-400 (reaction conditions: T = 120 °C, p = 2 MPa, t = 2 h). | ||
To verify whether phase transformation, structural damage and active Ni loss occurred during the 5 successive cycles, the fresh and spent catalysts were characterized via XRD, BET and ICP. The surface area, pore volume and size of the spent catalyst changed little as compared to those of the fresh one (see Table 1), which may have a negligible effect on the catalytic performance. Besides, after 5 successive cycles, the Ni content did not decrease obviously (from 52.8% to 52.5%, see Table 1), suggesting that there was no obvious nickel leaching. Furthermore, the comparison of the XRD patterns showed that the metallic Ni diffraction peak position and intensity of the spent catalyst were almost the same as those of the fresh one, and no other peak was observed for the spent catalyst, which suggested that no phase transformation was detected after 5 successive cycles. The above phenomenon confirmed that the Ni@C-400 catalyst possessed good stability. This is possibly due to its special core–shell structure (TEM analysis) derived from Ni-MOF-74.
3.10 Extension of substrates
To study the applicability of the Ni@C-400 catalyst, hydrogenation of other phenol derivatives was carried out. As can be seen in Table 3, these phenol derivatives were successfully hydrogenated to their corresponding cyclohexanol products with high yields.4. Conclusion
In this work, Ni@C-T materials with a desirable hydrogenation performance were prepared by direct pyrolysis of Ni-MOF-74 at different temperatures under a N2 atmosphere. The results showed that metallic Ni is identified as the main active site for the hydrogenation of phenol. At a low pyrolysis temperature of 300 °C, the active metallic Ni was not formed, and therefore Ni@C-300 was inactive. When the pyrolysis temperature is >400 °C, the active metallic Ni was formed and Ni@C-400 exhibited the best performance, which was associated with the high surface area and better dispersion of the active sites. Under the reaction conditions of a temperature of 120 °C, a H2 pressure of 2.0 MPa and a time of 2 h, the conversion of phenol reached 100% with a cyclohexanol selectivity of 100%, which are more excellent than those of reported catalysts. Furthermore, phenol is possibly hydrogenated to cyclohexanol via a combination of one-step and two-step pathways. There is no appreciable decline in the conversion and selectivity after five successive cycles, which indicated that the Ni@C-400 catalyst displayed excellent reusability. This work provides a different approach to design highly efficient noble-metal-free catalysts for fast hydrogenation of phenol to cyclohexanol under mild conditions.Author contributions
Shuai Wang: investigation, data curation, and writing original draft. Lidong Yang: characterization. Tianhan Zhu: software. Nan Jiang: resources. Feng Li: formal analysis. Huan Wang: project administration. Chunlei Zhang: visualization. Hua Song: conceptualization and writing review & editing.Conflicts of interest
There are no conflicts to declare.Acknowledgements
This work was supported by the High-level Talent Program of University Reform and Development Fund from the Central Government, China (2020GSP17).References
- K. J. Betsy, A. Lazar and C. P. Vinod, Nano-Struct. Nano-Objects, 2018, 13, 36–43 CrossRef CAS.
- Z. Wei, Y. Li, J. Wang, H. Li and Y. Wang, Chin. Chem. Lett., 2018, 29(6), 815–818 CrossRef CAS.
- A. Li, K. Shen, J. Chen, Z. Li and Y. Li, Chem. Eng. Sci., 2017, 166, 66–76 CrossRef CAS.
- X. Fang, Z. Yin, H. Wang, J. Li, X. Liang and J. Kang, et al. , J. Catal., 2015, 329, 187–194 CrossRef CAS.
- B.-C. Chen, B.-Y. Yu, Y.-L. Lin, H.-P. Huang and I. L. Chien, Ind. Eng. Chem. Res., 2014, 53, 7079–7086 CrossRef CAS.
- X. Cui, A.-E. Surkus, K. Junge, C. Topf, J. Radnik, C. Kreyenschulte and M. Beller, Nat. Commun., 2016, 7, 11326 CrossRef PubMed.
- B. Sarkar, C. Pendem, L. N. S. Konathala, T. Sasaki and R. Bal, J. Mater. Chem. A, 2014, 2, 18398–18404 RSC.
- J. Zhong, J. Chen and L. Chen, Catal. Sci. Technol., 2014, 4(10), 3555–3569 RSC.
- J. Lu, C. Aydin, N. D. Browning and B. C. Gates, J. Am. Chem. Soc., 2012, 134, 5022–5025 CrossRef CAS PubMed.
- A. Maximov, A. Zolotukhina, V. Murzin, E. Karakhanov and E. Rosenberg, Ruthenium, ChemCatChem, 2015, 7(7), 1197–1210 CrossRef CAS.
- J. He, X. H. Lu, Y. Shen, R. Jing, R. F. Nie and D. Zhou, et al. , Mol. Catal., 2017, 440, 87–95 CrossRef CAS.
- X. Ning, Y. Sun, H. Fu, X. Qu, Z. Xu and S. Zheng, Chemosphere, 2020, 241, 124978 CrossRef CAS.
- H. Furukawa, N. Ko, Y. Go, N. Aratani, S. Choi, E. Choi, A. Yazaydin, R. Snurr, M. O'Keeffe, J. Kim and O. Yaghi, Science, 2010, 329, 424–428 CrossRef CAS PubMed.
- H. Liu, L. Chang, C. Bai, L. Chen, R. Luque and Y. Li, Angew. Chem., Int. Ed., 2016, 55, 5019–5023 CrossRef CAS PubMed.
- J. Chen, J. Chen and Y. Li, J. Mater. Chem. A, 2017, 5 Search PubMed.
- A. J. Amali, H. Hoshino, C. Wu, M. Ando and Q. Xu, Chem. – Eur. J., 2014, 20, 8279–8282 CrossRef CAS.
- H. Hayashi, A. P. Côté, H. Furukawa, M. O'Keeffe and O. M. Yaghi, Nat. Mater., 2007, 6(7), 501–506 CrossRef CAS.
- T. Grant Glover, G. W. Peterson, B. J. Schindler, D. Britt and O. Yaghi, Chem. Eng. Sci., 2011, 66, 163–170 CrossRef CAS.
- T.-Y. Wang, J.-L. Meng, Z.-Y. He, L. Chen, H. Zhu and Q.-Q. Sun, et al. , Adv. Sci., 2020, 7(8), 1903480 CrossRef CAS.
- X. Wang and Y. Li, J. Mol. Catal. A: Chem., 2016, 420, 56–65 CrossRef CAS.
- M. A. Ahsan, O. Fernandez-Delgado, E. Deemer, H. Wang, A. A. El-Gendy, M. L. Curry and J. C. Noveron, J. Mol. Liq., 2019, 290, 111059 CrossRef CAS.
- A. Li, K. Shen, J. Chen, Z. Li and Y. Li, Chem. Eng. Sci., 2017, 03, 027 Search PubMed.
- H. T. T. Nguyen, D. N. A. Doan and T. Truong, J. Mol. Catal. A: Chem., 2017, 426, 141–149 CrossRef CAS.
- D. Chen, H. Shang, W. Zhu and R. Krishna, Chem. Eng. Sci., 2014, 117, 407–415 CrossRef CAS.
- Z. Lv, Q. Zhong and Y. Bu, Appl. Surf. Sci., 2018, 439, 413–419 CrossRef CAS.
- D. Qiu, X. Ma, J. Zhang, Z. Lin and B. Zhao, Mater. Lett., 2018, 232, 163–166 CrossRef CAS.
- P. Wang, X. Zhang, Y. Wei and P. Yang, Int. J. Hydrogen Energy, 2019, 44, 19792–19804 CrossRef CAS.
- X. Ning, Y. Sun, H. Fu, X. Qu, Z. Xu and S. Zheng, Chemosphere, 2020, 241, 124978 CrossRef CAS.
- J. Xia, G. He, L. Zhang, X. Sun and X. Wang, Appl. Catal., B, 2016, 180, 408–415 CrossRef CAS.
- X. Q. Gong, A. Selloni, O. Dulub, P. Jacobson and U. Diebold, J. Am. Chem. Soc., 2008, 130(1), 370–381 CrossRef CAS PubMed.
- R. D. D. Putra, H. L. Trajano, S. Liu, S. Lee, L. Smith and C. S. Kim, Chem. Eng. J., 2018, 350, 181–191 CrossRef CAS.
- L. He, Z. Niu, R. Miao, Q. Chen, Q. Guan and P. Ning, J. Cleaner Prod., 2019, 215, 375–381 CrossRef CAS.
- Y. Shi, S. Chen, L. He, P. Ning and Q. Guan, Catalysts, 2019, 9, 212 CrossRef.
- Á. Molnár and A. Papp, Coord. Chem. Rev., 2017, 349, 1–65 CrossRef.
| This journal is © The Royal Society of Chemistry 2022 |

