 Open Access Article
Switching from ultrafast electron transfer to proton transfer in excited drug–protein complexes upon biotransformation†
Lorena
Tamarit
 ab,
Meryem
El Ouardi
ab,
Emilio
Lence
ab,
Meryem
El Ouardi
ab,
Emilio
Lence
 c,
Inmaculada
Andreu
 ab,
Concepción
González-Bello
 *c,
Ignacio
Vayá
 *ab and
Miguel A.
Miranda
 *ab
*ab
aDepartamento de Química/Instituto de Tecnología Química UPV-CSIC, Universitat Politècnica de València, Camino de Vera s/n, 46022 València, Spain. E-mail: mmiranda@qim.upv.es; igvapre@qim.upv.es
bInstituto de Investigación Sanitaria La Fe, Hospital Universitari i Politècnic La Fe, Avenida de Fernando Abril Martorell 106, 46026 Valencia, Spain
cCentro Singular de Investigación en Química Biolóxica e Materiais Moleculares (CiQUS), Departamento de Química Orgánica, Universidade de Santiago de Compostela, Jenaro de la Fuente s/n, 15782 Santiago de Compostela, Spain. E-mail: concepcion.gonzalez.bello@usc.es
First published on 2nd August 2022
Abstract
Photosensitization by drugs is directly related with the excited species and the photoinduced processes arising from interaction with UVA light. In this context, the ability of gefitinib (GFT), a tyrosine kinase inhibitor (TKI) used for the treatment of a variety of cancers, to induce phototoxicity and photooxidation of proteins has recently been demonstrated. In principle, photodamage can be generated not only by a given drug but also by its photoactive metabolites that maintain the relevant chromophore. In the present work, a complete study of O-desmorpholinopropyl gefitinib (GFT-MB) has been performed by means of fluorescence and ultrafast transient absorption spectroscopies, in addition to molecular dynamics (MD) simulations. The photobehavior of the GFT-MB metabolite in solution is similar to that of GFT. However, when the drug or its metabolite are in a constrained environment, i.e. within a protein, their behavior and the photoinduced processes that arise from their interaction with UVA light are completely different. For GFT in complex with human serum albumin (HSA), locally excited (LE) singlet states are mainly formed; these species undergo photoinduced electron transfer with Tyr and Trp. By contrast, since GFT-MB is a phenol, excited state proton transfer (ESPT) to form phenolate-like excited species might become an alternative deactivation pathway. As a matter of fact, the protein-bound metabolite exhibits higher fluorescence yields and longer emission wavelengths and lifetimes than GFT@HSA. Ultrafast transient absorption measurements support direct ESPT deprotonation of LE states (rather than ICT), to form phenolate-like species. This is explained by MD simulations, which reveal a close interaction between the phenolic OH group of GFT-MB and Val116 within site 3 (subdomain IB) of HSA. The reported findings are relevant to understand the photosensitizing properties of TKIs and the role of biotransformation in this type of adverse side effects.
Introduction
The photosensitizing potential of a drug is directly related with the excited species that can be formed upon its interaction with UVA light. In this regard, photo(geno)toxicity or photoallergy are associated with damage to biomolecules such as proteins, lipids or DNA caused by radicals or reactive oxygen species (ROS), which can be generated from excited singlet or triplet states.1–3 Therefore, investigation of the transient species of an excited drug in different media is crucial to better understand the mechanism leading to photodamage, since either their yields of formation, spectral profile and kinetic evolution may be strongly affected by the surroundings. To this end, fluorescence and transient absorption spectroscopies are suitable techniques that allow studying in depth the photophysical properties of a drug, in addition to getting a better understanding of fundamental photoinduced processes such as energy or electron transfer, charge separation, proton transfer, etc.4In this context, gefitinib (GFT) is a tyrosine kinase inhibitor (TKI) clinically used for the treatment of different types of cancer, including lung cancer and locally advanced or metastatic non-small cell lung cancer.5,6 The mechanism of action of this drug involves targeting the ATP binding pocket of the epidermal growth factor receptor to block its kinase activity preventing autophosphorylation.7–11 The photosensitizing potential of GFT has recently been demonstrated by in vitro neutral red uptake (NRU) assays and protein photooxidation.12 This drug is administered orally, and the main route of its elimination is through hepatic metabolism via CYP3A4 and biliary excretion.13 One of its metabolites is shown in Fig. 1: O-desmorpholinopropyl gefitinib (GFT-MB). As it can be observed, both the drug and its metabolite maintain the quinazoline moiety in its structure; drugs containing this chromophore are known to induce photodermatosis.14 Besides, the ability of other TKIs to mediate photodamage has also been proven with lapatinib (LAP),15 a drug currently used for the treatment of lung and breast cancer. Interestingly, not only LAP is phototoxic and photogenotoxic, but also one of its photoactive metabolites, the N-dealkylated derivative (N-LAP).
Previous studies on the photobehavior of LAP and its metabolites by means of spectroscopic techniques have shown that their photophysical properties are strongly medium-dependent.16,17 A similar result was recently obtained for the parent drug GFT.12 Thus, excitation of these anticancer drugs in organic non-polar solvents or in biological media leads to the formation of locally excited (LE) singlet states. By contrast, in organic polar solvents LE states rapidly evolve to the formation of longer-lived intramolecular charge transfer (ICT) singlet states. Actually, LE species have been proposed to be responsible for the photoinduced biological damage mediated by GFT, LAP and its metabolite N-LAP.12,15
With this background, the aim of the present work is to compare the photobehavior of GFT with that of GFT-MB in solution and in the presence of human serum albumin (HSA)18 using fluorescence and transient absorption spectroscopies, from the femtosecond to the microsecond time-scales. Besides, molecular dynamics (MD) simulations have been used to investigate in atomic detail the binding of this drug and its metabolite to the protein, in order to achieve a better understanding of the experimental results.19 In this context, MD simulation has proven to be a powerful tool for studying the strength and characteristics of the interactions of a drug with the amino acids of the protein binding sites.16,20 All these features are relevant as they can be directly connected with the photosensitizing properties of GFT and its metabolite.
Experimental
Chemicals and reagents
Gefitinib (GFT) was purchased from Quimigen. O-Desmorpholinopropyl gefitinib (GFT-MB) was purchased from Fluorochem. N-Acetyl-L-tyrosine methyl ester (NAc-TyrMe), N-acetyl-L-tryptophan methyl ester (NAc-TrpMe), anthracene, 3-methylindole, ibuprofen, warfarin and human serum albumin (HSA) were purchased from Sigma-Aldrich. PBS buffer was prepared by dissolving phosphate-buffered saline tablets (Sigma) using ultrapure water from a Millipore (Milli-Q Synthesis) system. Spectrophotometric HPLC solvents were obtained from Scharlab and used without further purification.Spectroscopic measurements
Steady-state absorption spectra were recorded in a JASCO V-760 spectrophotometer. Steady-state fluorescence spectra were obtained using a JASCO spectrofluorometer system provided with a monochromator in the wavelength range 200–900 nm, with an excitation wavelength of 340 nm at 25 °C. Measurements on ligand@protein complexes were performed of 1![[thin space (1/6-em)]](https://www.rsc.org/images/entities/char_2009.gif) :
:![[thin space (1/6-em)]](https://www.rsc.org/images/entities/char_2009.gif) 1 molar ratio mixtures at 10 μM in aerated PBS. The absorbance of the samples at the excitation wavelength was kept below 0.1. Phosphorescence measurements were performed in a Photon Technology International (PTI, TimeMaster TM-2/2003) spectrophotometer equipped with a pulsed Xe lamp, operating in a time-resolved mode with a delay time of 0.5 ms. The sample was dissolved in ethanol, introduced in a quartz tube of 5 mm of diameter and cooled with liquid nitrogen (77 K).
1 molar ratio mixtures at 10 μM in aerated PBS. The absorbance of the samples at the excitation wavelength was kept below 0.1. Phosphorescence measurements were performed in a Photon Technology International (PTI, TimeMaster TM-2/2003) spectrophotometer equipped with a pulsed Xe lamp, operating in a time-resolved mode with a delay time of 0.5 ms. The sample was dissolved in ethanol, introduced in a quartz tube of 5 mm of diameter and cooled with liquid nitrogen (77 K).
Time-resolved fluorescence measurements were done using an EasyLife X system containing a sample compartment composed of an automated Peltier cuvette holder to control the temperature at 24 °C, a pulsed LED excitation source and a lifetime detector. The employed LED excitation source was 340 nm, with emission filter of WG370.
Laser flash photolysis (LFP) measurements were performed using a pulsed Nd:YAG L52137 V LOTIS TII at the excitation wavelength of 355 nm. The single pulses were ca. 10 ns duration, and the energy was ∼12 mJ per pulse. The laser flash photolysis system consisted of the pulsed laser, a 77250 Oriel monochromator and an oscilloscope DP04054 Tektronix. The output signal from the oscilloscope was transferred to a personal computer. Absorbances of all solutions were adjusted at ∼0.20 at 355 nm. All UV, fluorescence and LFP measurements were recorded using 10 × 10 mm2 quartz cuvettes at room temperature in deaerated conditions (25 min N2 bubbling), or in the case of the protein complexes in aerated atmosphere. Control experiments indicated that the degree of decomposition of the samples after photolysis was lower than 5%.
Femtosecond transient absorption experiments were performed using a typical pump-probe system. The femtosecond pulses were generated with a compact regenerative amplifier that produces pulses centered at 800 nm (τpulse ∼ 100 fs, 1 mJ per pulse). The output of the laser was split into two parts to generate the pump and the probe beams. Thus, tunable femtosecond pump pulses were obtained by directing the 800 nm light into an optical parametric amplifier. In the present case, the pump was set at 330 nm and passed through a chopper prior to focus onto a rotating cell (1 mm optical path) containing the samples in organic or aqueous solution. The white light used as probe was produced after part of the 800 nm light from the amplifier travelled through a computer controlled 8 ns variable optical delay line and impinge on a CaF2 rotating crystal. This white light was in turn split in two identical portions to generate reference and probe beams that then are focused on the rotating cell containing the sample. The pump and the probe were made to coincide to interrogate the sample. The power of the pump beam was set to 180 μW. Under these conditions, the degree of photodegradation of the samples was lower than 5%. A computer-controlled imaging spectrometer was placed after this path to measure the probe and the reference pulses to obtain the transient absorption decays/spectra. The experimental data were treated and compensated by the chirp using the ExciPro program.
Molecular docking
These calculations were performed using GOLD program version 2020.2.0,21 and the protein coordinates were taken from the crystal structure of HSA in complex with hemin and myristic acid (PDB entry 1O9X).22 The experimental procedure was similar to that described for LAP, N-LAP and O-LAP in HSA.17Molecular dynamics simulation studies
The highest score solution obtained by docking was subjected to 100 ns of dynamic simulation. The experimental protocol involved: (i) the minimization of the ligands (GFT, GFT-MB); (ii) the generation and minimization of the binary GFT@HSA and GFT-MB@HSA complexes using the poses obtained by docking; and (iii) simulations of the resulting minimized ligand@HSA complexes. The protocol was performed as described for LAP, N-LAP and O-LAP in HSA.17 The cpptraj module in AMBER 17 was used to analyze the trajectories and to calculate the rmsd of the protein and the ligand during the simulation.23 The molecular graphics program PyMOL24 was employed for visualization and depicting enzyme structures. For figures related to HSA, the amino acid numbering described in PDB entry 1O9X was employed.Binding free energies
The binding free energy for GFT and GFT-MB was calculated by the MM/PBSA approach as implemented in Amber.25 The ante-MMPBSA.py module was used to create topology files for the complexes, protein and ligands, while the binding free energies were calculated with the MMPBSA.py module. Only the last 80 ns of the 100 ns MD trajectories were used to calculate binding free energies. The Poisson–Boltzmann (PB) and generalized Born (GB) implicit solvation models were employed. Both models provided similar results.Results and discussion
In view of the photosensitizing potential recently demonstrated for GFT,12 which is assumed to arise from the excited species formed upon interaction with UVA light, it seemed relevant to study the photophysical properties of GFT-MB, since this metabolite maintains the quinazoline moiety and is structurally similar to the parent drug. To this end, the species formed after excitation of GFT-MB with UVA light were first explored in organic solvents of different polarities by means of fluorescence and ultrafast transient absorption spectroscopies.The UV absorption spectra of GFT-MB hardly changed with the polarity of the organic solvent, while the fluorescence properties (Table 1 and Fig. 2) were strongly affected. This behavior is similar to that previously observed for GFT.12 Accordingly, a similar interpretation can be done for the metabolite and its parent drug: emission from intramolecular charge transfer (ICT) states is detected in polar solvents such as acetonitrile, while locally excited (LE) states are formed in the non-polar ones, i.e. cyclohexane. The latter emit at shorter wavelengths and display higher yields (ϕF) than ICT states. In addition, the fluorescence lifetimes (τF) were found to be much shorter for LE (ca. 1.2 ns) than for ICT states (∼3 ns).
| GFTa | GFT-MB | |||||
|---|---|---|---|---|---|---|
| λ max/nm | ϕ F | τ F/ns | λ max/nm | ϕ F | τ F/ns | |
| a Data from ref. 12. b ϕ F were determined using anthracene in ethanol as ref. 26. c Due to solubility requirements, 10% of toluene was needed to solubilize GFT-MB in cyclohexane. | ||||||
| MeCN | 473 | 0.05 | 3.4 | 468 | 0.03 | 3.2 |
| 1,4-Dioxane | 458 | 0.09 | 2.5 | 456 | 0.08 | 3.1 |
| Toluene | 421 | 0.18 | 2.6 | 442 | 0.14 | 2.9 |
| Cyclohexane | 378 | 0.19 | 1.3 | 375c | 0.16c | 1.2c |
| HSA | 390 | 0.02 | 1.3 | 432 | 0.15 | 2.5 |
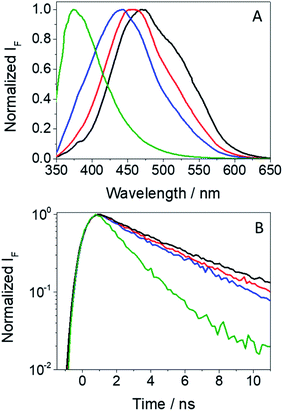 | ||
| Fig. 2 Normalized fluorescence spectra (A) and decay traces (B) for GFT-MB in acetonitrile (black), 1,4-dioxane (red), toluene (blue) and cyclohexane (green) after excitation at 340 nm. | ||
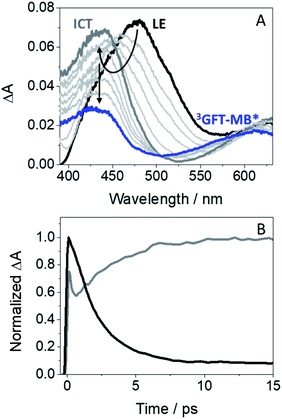
In order to investigate the formation of LE and ICT states in more detail, femtosecond transient absorption experiments were performed for GFT-MB in acetonitrile. This is a very sensitive and precise technique that allows investigating processes occurring at the very early steps after excitation, such as photoinduced energy and electron transfer, charge separation, photoinduced proton transfer and intersystem crossing (ISC).27 Hence, excitation of GFT-MB at 330 nm in acetonitrile gave rise to the instantaneous formation of a band centered at 480 nm (Fig. 3A, black line). In line with the behavior previously observed for GFT,12 this species was assigned to LE states, which rapidly evolved towards the formation of a band with maximum at ∼435 nm (Fig. 3A, dark gray line), associated to ICT states. This process took place in ca. 2.4 ps: as it can be deduced from the kinetic traces of Fig. 3B, the decay at 480 nm (black line) is directly associated with the formation of the trace at 435 nm (dark gray line). Once ICT states were formed, they disappeared in a temporal scale reaching the nanosecond time profile. These results are in line with the observations from the fluorescence experiments. Finally, it is worth to mention that a new absorption band displaying a maximum ∼610 nm (blue line), remained in the ns timescale; this species was assigned to the triplet–triplet absorption of GFT-MB (3GFT-MB*).
As 3GFT-MB* was detected from ultrafast transient absorption spectroscopy, and triplet species normally survive up to the microsecond time scale, it seemed relevant to use the laser flash photolysis (LFP) technique to study in more detail not only their formation but also the reactive species that may arise from triplets, i.e. radicals and/or ROS,28 since they can be responsible for the photosensitized damage to biomolecules (lipids, proteins or DNA).1–3 In this context, it is known that light-absorbing drugs are able to induce photodamage to biomolecules through two different mechanisms: type I, involving formation of radicals via electron transfer and/or hydrogen abstraction, or type II mechanism occurring through energy transfer from the excited drug to molecular oxygen, yielding formation of the highly reactive singlet oxygen (1O2) species.29,30
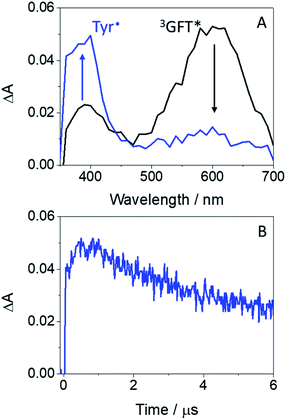
The main transients arising from excitation of GFT-MB in deaerated MeCN upon LFP at λexc = 355 nm are shown in Fig. 4A. In agreement with previous observations from the parent drug GFT, triplets were the main excited species detected for the metabolite. Hence, 3GFT-MB* displayed a maximum absorption band at ca. 600 nm, which disappeared in about 1.3 μs. A similar trend was also observed in the less polar solvent toluene (Fig. 4B), but displaying slightly higher triplet yields and decaying with similar lifetimes as in MeCN. The energy value of 3GFT-MB*, determined from the phosphorescence spectra in a solid matrix of ethanol at 77 K (Fig. S1†), was 67 kcal mol−1, similar to that of GFT (69 kcal mol−1).12
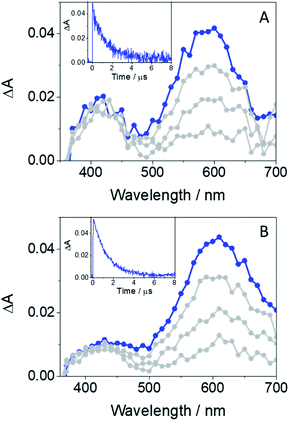 | ||
| Fig. 4 LFP spectra (from 0.2 to 3 μs) and decay traces at 600 nm for GFT-MB in MeCN (A) and toluene (B) under deaerated conditions after excitation at 355 nm. | ||
As stated above, from a photobiological point of view, formation of triplet excited species is important since they can induce a cascade of reactions that could finally result in damage to biomolecules (e.g. proteins). In this regard, since a type I mechanism may operate in the photobiological damage, the ability of both the drug and its metabolite to photoinduce formation of radical species was also investigated in the presence of tyrosine (Tyr) and tryptophan (Trp). These are key amino acids located in different binding sites of transport proteins, which play a significant role in drug@protein interactions.31 In order to check this possibility, application of the Weller equation,32 considering the triplet energy of the drug (or metabolite) and the redox potentials of model compounds such as quinazoline, phenol and 3-methylindole,26,33 agrees with an exergonic electron transfer from the amino acid to the excited drug (ΔG ca. −6 kcal mol−1 for Tyr, and ΔG ca. −4 kcal mol−1 for Trp). As the energies of the singlet excited states are markedly higher, the electron transfer from these states would be even more favorable. In fact, the feasibility of this process was confirmed experimentally as explained below.
Laser flash photolysis measurements at λexc = 355 nm were performed in deaerated MeCN on mixtures containing the drug (or its metabolite) and increasing amounts of the corresponding amino acid (due to solubility requirements, the N-acetyl methyl ester amino acid derivatives, namely NAc-TyrMe or NAc-TrpMe, were used). Thus, selective excitation of GFT in the presence of Tyr or Trp induced deactivation of its triplet excited state with λmax ∼ 600 nm (Fig. S2†); quenching rate constants (kQ) of ca. 1.4 × 10⁸ M−1 s−1 and 1.5 × 10⁷ M−1 s−1 were determined for Tyr and Trp, respectively. This quenching is attributed to a photoinduced electron transfer (PET) process, since energy transfer from the excited drug to the amino acid is energetically disfavored, as the triplet energies of Tyr and Trp (82 and 71 kcal mol−1, respectively)26 are higher than that of GFT (69 kcal mol−1). Interestingly, formation of the Tyr radical at ∼400 nm (ref. 34) was detected for GFT/Tyr mixtures (Fig. 5). PET processes have previously been observed for other drug/Tyr and drug/Trp systems.35
A similar behavior was observed for GFT-MB. Hence, quenching of its triplet excited state was observed upon addition of increasing amounts of the Tyr and Trp derivatives. In this case, kQ values of ca. 6.0 × 10⁷ M−1 s−1 and 2.5 × 10⁸ M−1 s−1 were determined, respectively. Again, as shown above for GFT, formation of the Tyr radical was also detected (Fig. S3†). As stated above, electron transfer processes can also occur from singlet excited states. In fact, this was previously observed for 1GFT* in toluene in the presence of increasing amounts of 3-methylindole, the chromophore of the Trp residue; a kQ value of ∼4.3 × 10¹⁰ M−1 s−1 was determined.12 A similar result has also been obtained here using NAc-TyrMe (Fig. S4A†), with a quenching rate constant of ca. 6.3 × 10⁹ M−1 s−1. As expected, quenching of 1GFT-MB* through electron transfer from 3-methylindole or NAc-TyrMe takes actually place, displaying kQ values of ca. 8.7 × 10⁹ M−1 s−1 and 5.8 × 10⁹ M−1 s−1 (Fig. S4B and C†), respectively, which are slightly lower than those observed for 1GFT*.
So far, the results have only been discussed in organic solvents, where both GFT and GFT-MB are in their neutral forms. However, the scenario may change in aqueous solution, since the quinazoline and morpholine moieties can be protonated at sufficiently low pH; moreover, in the case of the metabolite, the –OH group can be deprotonated leading to phenolate-like species. In this context, the pKa values for the quinazoline moiety and the morpholine side chain of GFT are 5.4 and 7.2, respectively.36 By contrast, for the main chromophore of GFT-MB, 6-hydroxyquinazoline, these values are 3.2 and 8.2, which are associated with deprotonation of the quinazoline moiety and the –OH group, respectively.37 In view of the above pKa values, GFT should be fully protonated at pH 2. However, at physiological pH 7.4, the protonated amino group of the morpholine moiety should be in equilibrium with its neutral form while the quinazoline moiety should be deprotonated. Besides, in basic media GFT would be fully deprotonated, and its absorption band at ca. 330 nm peaks at lower wavelengths compared with the acidic medium (Fig. S5A†). As regards GFT-MB, it should also be fully protonated at pH 2, while at physiological pH its neutral form would predominate. By contrast, at basic pH the metabolite starts to deprotonate to form phenolate-like species, whose UV absorption band appears at longer wavelengths (Fig. S5B†).
Considering the capability of both the drug and its metabolite to participate in photoinduced electron transfer with Tyr and Trp, which could finally result in damage to biomolecules, it seemed appropriate to investigate their interactions with human serum albumin (HSA) in aqueous PBS solution. This is the most abundant protein in human plasma, and it is responsible for a number of relevant processes including transport of endogenous and exogenous agents (e.g. drugs, metabolites, fatty acids, etc.) for their selective delivery to specific targets.38 In this regard, the binding of drugs to transport proteins is important since it regulates drug solubility in plasma, susceptibility to oxidation, toxicity and in vivo half-life.31
The stoichiometry of the protein-bound drug or metabolite has been determined by means of Job's plot analysis,39 which provides evidence for the formation of a 1![[thin space (1/6-em)]](https://www.rsc.org/images/entities/char_2009.gif) :
:![[thin space (1/6-em)]](https://www.rsc.org/images/entities/char_2009.gif) 1 complex; this has been further confirmed by MD simulations, where only a single molecule of GFT (or GFT-MB) can bind within HSA (Fig. S6†).
1 complex; this has been further confirmed by MD simulations, where only a single molecule of GFT (or GFT-MB) can bind within HSA (Fig. S6†).
The photophysical properties of GFT interacting with HSA have been recently investigated.12 In this case, emission from LE singlet states (LE 1GFT*) with λmax ∼ 390 nm is predominantly observed. However, the photobehavior of GFT-MB bound to HSA remains unexplored. Thus, fluorescence and transient absorption spectroscopies were used to study in detail the photobehavior of the protein-bound metabolite upon its selective excitation with UVA light (λexc = 340 nm); this excitation wavelength is relevant from a photobiological point of view since HSA does not absorb light at 340 nm and, therefore, the photoinduced processes would only arise from the excited metabolite.
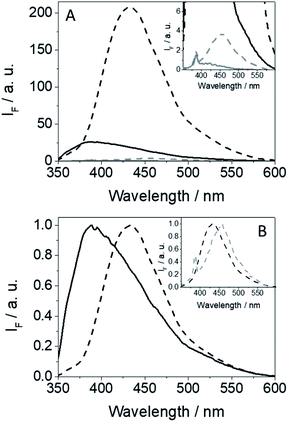
The fluorescence spectra of GFT@HSA and GFT-MB@HSA are compared in Fig. 6. Emission from the drug or the metabolite free in solution is almost negligible; however, it is strongly enhanced within the protein cavities as a result of the higher restrictions in their degrees of freedom for conformational relaxation. Interestingly, this effect is more important for GFT-MB@HSA, which displays a much higher ϕF value than GFT@HSA (∼0.15 vs. ∼0.02, respectively; Table 1). The strength and preferential site of interaction for GFT-MB within HSA has been studied using displacement probes for site 1 (warfarin, WRF),40 site 2 (ibuprofen, IBP).41 In the case of GFT, it was previously reported that it interacts with site 3 of HSA with a binding constant (ka) of 1.7 × 10⁴ M−1.42 Under physiological conditions, ca. 97% of GFT is bound to plasma proteins, namely HSA.43 For GFT-MB@HSA at 1![[thin space (1/6-em)]](https://www.rsc.org/images/entities/char_2009.gif) :
:![[thin space (1/6-em)]](https://www.rsc.org/images/entities/char_2009.gif) 1 molar ratio, addition of IBP or WRF did not result in its displacement from the binding site; instead, a slight fluorescence enhancement was observed due to an allosteric effect. By contrast, addition of GFT induced a clear displacement of the metabolite from its binding site (Fig. S7†). These results are consistent with site 3 as the preferred site for GFT-MB@HSA, with a binding constant in the order of that of GFT@HSA. This was further confirmed by theoretical studies. The binding free energies of GFT and GFT-MB to site 3 of HSA were calculated using the MM/PBSA method in explicit water (generalized Born, GB) as implemented in Amber.25 The affinity of GFT-MB to HSA proved to be slightly weaker (13.1 kcal mol−1) than that of the parent drug.
1 molar ratio, addition of IBP or WRF did not result in its displacement from the binding site; instead, a slight fluorescence enhancement was observed due to an allosteric effect. By contrast, addition of GFT induced a clear displacement of the metabolite from its binding site (Fig. S7†). These results are consistent with site 3 as the preferred site for GFT-MB@HSA, with a binding constant in the order of that of GFT@HSA. This was further confirmed by theoretical studies. The binding free energies of GFT and GFT-MB to site 3 of HSA were calculated using the MM/PBSA method in explicit water (generalized Born, GB) as implemented in Amber.25 The affinity of GFT-MB to HSA proved to be slightly weaker (13.1 kcal mol−1) than that of the parent drug.
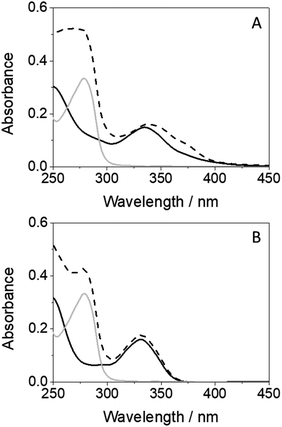
An interesting point to discuss is the bathochromic shift of the emission band of the protein-bound metabolite (λmax ∼ 432 nm) compared with that of GFT@HSA (λmax ∼ 390 nm, Fig. 6B), whose emission arises from LE states. These results point to the occurrence of different photoinduced processes for the drug and the metabolite within HSA upon interaction with UV light. In this context, and as stated above, photoinduced electron transfer from electron donors (Tyr and/or Trp) to the excited drug might occur in GFT@HSA, which explains its low fluorescence yield.12 By contrast, since the metabolite is a phenol, although electron transfer might also occur, as it has been observed for GFT-MB/Tyr (or Trp) mixtures in organic solvent, excited state proton transfer (ESPT) to form phenolate-like excited species might be a competitive process within the protein; these species are known to absorb and emit at wavelengths longer than phenols.44–46 In this regard, not only emission from GFT-MB@HSA was shifted to longer wavelengths, but also its absorption spectrum revealed a red-shifted shoulder at ca. 375 nm compared to GFT-MB in the bulk aqueous solution (Fig. 7A). In fact, the UV absorption spectra of GFT@HSA was hardly affected for aqueous solutions with pH above 6, in contrast to what was observed for GFT-MB@HSA, whose maximum shifted progressively towards longer wavelengths at increasing pH (Fig. S8†). This strongly suggests that phenolate-like species predominate in the GFT-MB@HSA complex; indeed, the shoulder at ca. 375 nm became more important at low GFT-MB/HSA ratios, supporting the prevalence of phenolate species within the protein (Fig. S9†). As it can be anticipated, this effect was not observed for GFT@HSA, since ESPT is not possible (Fig. 7B and S9A†). In this connection, fluorescence of GFT in the bulk solution was negligibly affected by the pH, while it was increased only slightly within HSA in aqueous solutions from pH 6 to 10 (Fig. S10A and C†); this is probably associated with the protonation–deprotonation equilibrium of the morpholine's nitrogen. By contrast, emission from GFT-MB was highly affected by the pH; this effect was even greater in the presence of HSA (Fig. S10B and D†), which is related with the formation of phenolate-like species within the protein. The small differences in the fluorescence maxima for GFT-MB in the bulk basic solution or within HSA (inset in Fig. 6B) arise from the constrained environment provided by the protein, but in both cases this emission is associated to phenolate-like species.
The high ϕF value for GFT-MB@HSA may have implications in connection with its photosensitizing potential. Accordingly, fluorescence for the protein-bound metabolite decays at times longer than that observed for GFT@HSA (2.8 vs. 0.8 ns, respectively; Fig. S11†).
Since diverging photoinduced processes may arise from GFT@HSA or GFT-MB@HSA, i.e. electron or proton transfer, respectively, it seemed appropriate to study the photobehavior of the protein-bound metabolite by means of ultrafast spectroscopy upon excitation with UVA light (λexc = 330 nm). Thus, the transient absorption spectra for GFT-MB@HSA from 1 ps to 0.5 ns are shown in Fig. 8A. For comparison, the spectra of GFT@HSA have also been included; in the latter case, formation of a single transient with maximum at 460 nm is assigned to LE 1GFT* states. It decays following a multi-exponential law (Fig. 8B); the shortest component is associated to electron transfer from appropriate donors to gefitinib.12 By contrast, a broad absorption band (410–600 nm) centered at ∼500 nm was instantaneously formed for GFT-MB@HSA. We assign this species to phenol-like LE 1GFT-MB* states. The absorption maximum shifted over time to longer wavelengths (from 500 to ca. 530 nm). This process can be related to intermolecular ESPT from LE 1GFT-MB to a proper acceptor located in the protein cavity to form phenolate-like excited species. Such assignment is consistent with the ultrafast transient absorption spectra previously observed for phenolate anions.47 The kinetic trace for GFT-MB@HSA can be satisfactorily fitted using a multi-exponential function; the shortest component, on the ps time scale, is associated to the proton transfer process, while the longer one, on the ns scale, is assigned to the decay of the phenolate-like excited species. This agrees with the UV and steady-state fluorescence results, where a bathochromic shift is observed. It is worth to mention that 3GFT-MB* was practically not observed in the protein medium, since the signal at ca. 600 nm is insignificant; this species was not even detected at longer time scales by means of LFP measurements (Fig. S12†). This result agrees with the formation of phenolate-like species within HSA, which hinders the formation of triplet excited species through ISC.
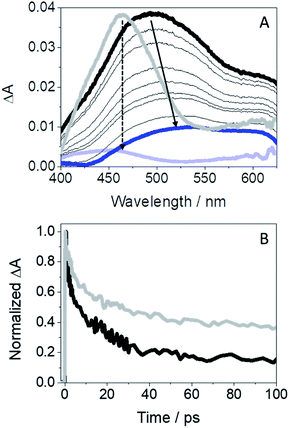 | ||
Fig. 8 (A) Femtosecond transient absorption spectra from 1 ps (black) to 0.5 ns (blue) for GFT-MB@HSA; the absorption spectra of GFT@HSA12 from 1 ps (light gray) to 1 ns (light blue) is also shown for comparison. (B) Kinetic traces for GFT-MB@HSA at 500 nm (black) and for GFT@HSA at 460 nm (light gray) after excitation at 330 nm of a 1![[thin space (1/6-em)]](https://www.rsc.org/images/entities/char_2009.gif) : :![[thin space (1/6-em)]](https://www.rsc.org/images/entities/char_2009.gif) 1 molar ratio ligand@protein complexes in aerated aqueous PBS solution. 1 molar ratio ligand@protein complexes in aerated aqueous PBS solution. | ||
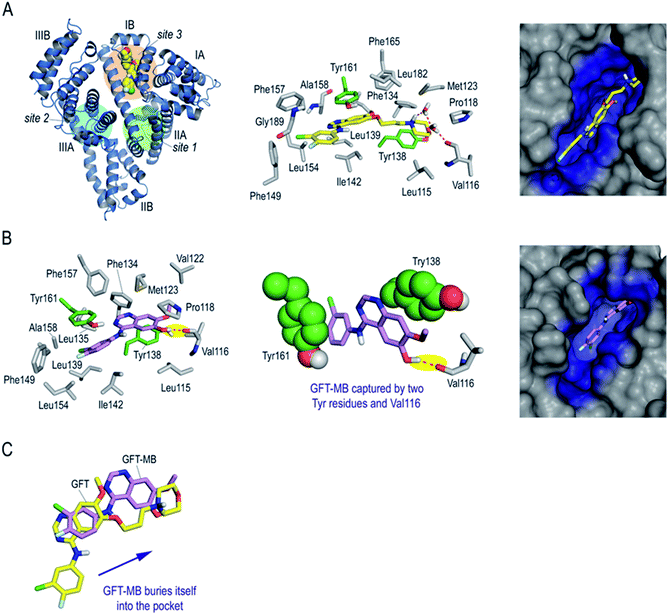
Finally, to get an insight in atomic detail into the ligand@protein interactions responsible for the photophysical properties experimentally observed, the binding mode of GFT and GFT-MB to HSA was explored by molecular docking using the GOLD program version 2020.2.0 (ref. 21) and further studied by molecular dynamics (MD) simulation studies. It should be noted that HSA is a large protein (60 kDa) that contains three main domains, namely I (residues 1–195), II (196–383) and III (384–585) (Fig. 9A). Each domain is divided into two subdomains, namely A and B, with different recognition patterns, which explains the huge capacity of this protein to transport a large variety of endogenous and exogenous compounds.48 HSA employs three main binding sites for recognition: site 1 (subdomain IIA), site 2 (subdomain IIIA) and site 3 (subdomain IB). Based on the structural similarity of the basic core of GFT (N-phenylquinazolin-4-amine moiety) with lapatinib, which was reported to bind to site 3,17 this region was selected for docking. The protein coordinates found in the crystal structure of HSA in complex with hemin (PDB entry 1O9X),22 which also binds to subdomain IB, was used for these studies. The GFT@HSA and GFT-MB@HSA complexes obtained by docking were immersed in a truncated octahedron box of water molecules and then subjected to 100 ns of dynamic simulation for validation using the molecular mechanics force field AMBER ff14SB and GAFF.49,50
The results of these MD simulation studies revealed the significant differences in the binding mode of GFT and GFT-MB with HSA (Fig. 9Avs.Fig. 9B). For GFT@HSA, the existence of a flexible side chain with a terminal morpholine group determines the arrangement of the compounds within the pocket. Thus, the most relevant interaction with the protein is the hydrogen bond between the quaternary amino group in its morpholine moiety and the side chain residues in the vicinity (Val116, Asp183), mainly through a network of water molecules (Fig. 9A). In this case, no direct polar contacts with protein residues were observed. Although the side chain of GFT is flexible and some motion is observed, the position of the quinazoline moiety is frozen within the pocket. Thus, the analysis of the root-mean-square deviation (rmsd) of the quinazoline core in GFT during the whole simulation revealed average values of 1.9 Å (Fig. S13†). This is due to the interaction of its quinazoline ring with the side chain of Tyr161, which is located on top, establishing a strong π–π stacking between them. The analysis of the variation of the relative distance between the mass center of the phenol group in Tyr161 and the quinazoline moiety of GFT in the complex during the whole simulation showed average distances of 3.7 Å (Fig. S14†). In addition, the arrangement of GFT in subdomain IB of HSA is further stabilized by numerous lipophilic interactions with the non-polar residues within the pocket, specifically Leu115, Pro118, Met123, Phe134, Tyr138, Leu139, Ile142, Phe149, Leu154, Phe157, Ala158, Phe165, Leu182, and Gly189.
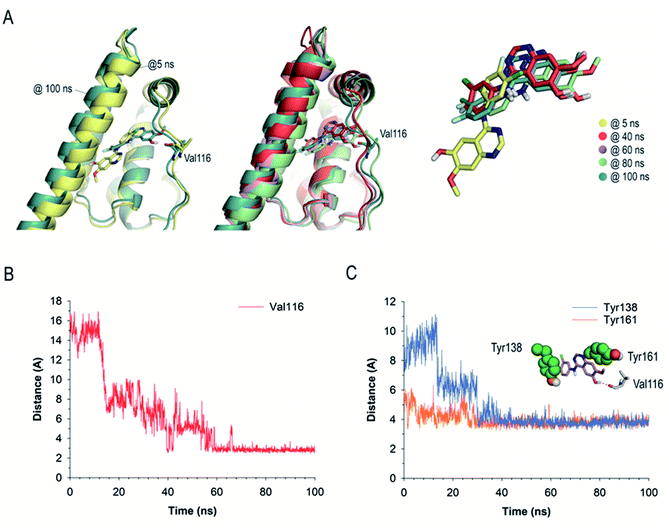
The binding mode of GFT-MB was clearly different from that observed for GFT, since the lack of the flexible chain allows it to bury itself in the pocket, stabilizing its arrangement through a strong hydrogen bonding interaction with the protein, specifically between its hydroxyl group and the main carbonyl group in Val116 (Fig. 9B). In fact, after ∼15 ns of simulation, GFT-MB moved away from the position identified by docking (like GFT) towards the bottom of the pocket to establish a direct contact with Val116, remaining fixed in this arrangement during the rest of the simulation (Fig. 10A). The average distance of the latter interaction during the last 50 ns of simulation was 3.2 Å (Fig. 10B). The position of GFT-MB is also frozen through strong π–π stacking with the phenol groups of Tyr161 and Tyr138, which are located on both faces of the ligand. The average distance between the mass center of the phenol groups and the quinazoline moiety in GFT-MB during the last 50 ns of simulation was 3.8 Å (Fig. 10C). As for GFT, diverse lipophilic interactions with the non-polar residues of the pocket, specifically Leu115, Pro118, Met123, Phe134, Leu135, Ile142, Phe149, Leu154, Phe157, and Ala158, were also identified.
Conclusions
The photobehavior of GFT-MB, a photoactive GFT metabolite, has been compared with that of its parent drug in different media, i.e. in solution and within HSA. To this end, fluorescence and transient absorption spectroscopies, from the femtosecond to the microsecond time scales have been used. Besides, MD simulations have been performed to explain in atomic detail the experimental results. The main excited species detected for both GFT and GFT-MB in solution are very similar. Thus, locally excited (LE) states are mainly formed in non-polar solvents, whereas intramolecular charge transfer (ICT) species predominate in polar solvents. Triplet excited states are detected in both polar and non-polar organic solvents; from this species, a type I mechanism seems to operate in the photodamage to biomolecules, since the resulting radicals have been detected by means of LFP. By contrast, significant differences are observed in the photobehavior of both the drug or the metabolite within the constrained environment provided by HSA. Thus, for GFT@HSA, LE species are instantaneously formed, which can photoinduce electron transfer with appropriate donors (e.g. Tyr or Trp residues). On the contrary, since the metabolite is a phenol, excited state proton transfer to form phenolate-like excited species occurs in GFT-MB@HSA. MD simulations have confirmed the occurrence of this process, which might hinder the formation of triplet species in the protein-bound metabolite. Since phenolate-like excited species exhibit much higher fluorescence yields and longer lifetimes than GFT@HSA, this might have consequences in the photosensitizing potential of GFT-MB, which can be anticipated to be higher than that of GFT.Data availability
All details about the experimental and computational data related with this article are included in the Experimental Section of this manuscript. Additional spectroscopic and theoretical results are provided in the ESI.†Author contributions
Research was conceived by all authors. Experiments were performed by L. T., M. O and E. L., with the aid of C. G.-B., I. A and I. V. The research was supervised by C. G.-B., I. A., I. V. and M. A. M. All authors contributed to the writing of the manuscript and ESI.†Conflicts of interest
There are no conflicts to declare.Acknowledgements
Financial support from the Spanish Ministry of Science and Innovation (RYC-2015-17737, BEAGAL 18/00211, PID2020-115010RB-I00/AEI/10.13039/501100011033, FPU19/00048, PID2019-105512RB-I00/AEI/10.13039/501100011033), the Xunta de Galicia (ED431C 2021/29), the Centro singular de investigación de Galicia accreditation 2019–2022 (ED431G 2019/03), and the European Regional Development Fund (ERDF) is gratefully acknowledged. All authors are grateful to the Centro de Supercomputación de Galicia (CESGA) for use of the Finis Terrae computer.References
- M. Gonçalo, in Contact Dermatitis, ed. J. D. Johansen, Springer-Verlag, Berlin, 2011, ch. 18, pp. 361–376 Search PubMed.
- K. R. Stein and N. S. Scheinfeld, Expert Opin. Drug Saf., 2007, 6, 431–443 CrossRef CAS PubMed.
- J. Kowalska, J. Rok, Z. Rzepka and D. Wrzesniok, Pharmaceuticals, 2021, 14, 723 CrossRef CAS PubMed.
- I. Vayá, V. Lhiaubet-Vallet, M. C. Jimenez and M. A. Miranda, Chem. Soc. Rev., 2014, 43, 4102–4122 RSC.
- M. H. Cohen, G. A. Williams, R. Sridhara, G. Chen and R. Pazdur, Oncologist, 2003, 8, 303–306 CrossRef CAS PubMed.
- J. G. Paez, P. A. Jänne, J. C. Lee, S. Tracy, H. Greulich, S. Gabriel, P. Herman, F. J. Kaye, N. Lindeman, T. J. Boggon, K. Naoki, H. Sasaki, Y. Fujii, M. J. Eck, W. R. Sellers, B. E. Johnson and M. Meyerson, Science, 2004, 304, 1497–1500 CrossRef CAS PubMed.
- P. Cohen, D. Cross and P. A. Janne, Nat. Rev. Drug Discovery, 2021, 20, 551–569 CrossRef CAS PubMed.
- L. Huang, S. Jiang and Y. Shi, J. Hematol. Oncol., 2020, 13, 143 CrossRef PubMed.
- C. Pottier, M. Fresnais, M. Gilon, G. Jerusalem, R. Longuespee and N. E. Sounni, Cancers, 2020, 12, 731 CrossRef CAS PubMed.
- R. Thomas and Z. Weihua, Front. Oncol., 2019, 9, 800 CrossRef PubMed.
- D. Veale, T. Ashcroft, C. Marsh, G. J. Gibson and A. L. Harris, Br. J. Cancer, 1987, 55, 513–516 CrossRef CAS PubMed.
- L. Tamarit, M. El Ouardi, I. Andreu, I. Vayá and M. A. Miranda, Chem. Sci., 2021, 12, 12027–12035 RSC.
- J. T. Hartmann, M. Haap, H.-G. Kopp and H.-P. Lipp, Curr. Drug Metab., 2009, 10, 470–481 CrossRef CAS PubMed.
- T. P. Selvam and P. V. Kumar, Res. Pharm., 2011, 1, 1–21 Search PubMed.
- G. García-Laínez, I. Vayá, M. P. Marín, M. A. Miranda and I. Andreu, Arch. Toxicol., 2021, 95, 169–178 CrossRef PubMed.
- I. Vayá, I. Andreu, E. Lence, C. González-Bello, M. C. Cuquerella, M. Navarrete-Miguel, D. Roca-Sanjuan and M. A. Miranda, Chem.–Eur. J., 2020, 26, 15922–15930 CrossRef PubMed.
- I. Andreu, E. Lence, C. Gonzalez-Bello, C. Mayorga, M. C. Cuquerella, I. Vayá and M. A. Miranda, Front. Pharmacol., 2020, 11, 576495 CrossRef CAS PubMed.
- Y. Toyama, J. Ueyama, H. Nomura, I. Tsukiyama, H. Saito, T. Hisada, K. Matsuura and T. Hasegawa, Anticancer Res., 2014, 34, 2283–2290 CAS.
- A. Spitaleri and W. Rocchia, in Biomolecular Simulations in Structure-Based Drug Discovery, ed. F. L. Gervasio and V. Spiwok, Wiley-VCH, Weinheim, Germany, 2019, pp. 29–39 Search PubMed.
- R. Pérez-Ruiz, E. Lence, I. Andreu, D. Limones-Herrero, C. González-Bello, M. A. Miranda and M. C. Jiménez, Chem.–Eur. J., 2017, 23, 13986–13994 CrossRef PubMed.
- G. Jones, P. Willett, R. C. Glen and R. Taylor, J. Mol. Biol., 1997, 267, 727–748 CrossRef CAS PubMed.
- P. A. Zunszain, J. Ghuman, T. Komatsu, E. Tsuchida and S. Curry, BMC Struct. Biol., 2003, 3, 6 CrossRef PubMed.
- D. A. Case, R. M. Betz, D. S. Cerutti, T. E. Cheatham, T. A. Darden, R. E. Duke, T. J. Giese, H. Gohlke, A. W. Goetz, N. Homeyer, S. Izadi, P. Janowski, J. J. Kaus, A. Kovalenko, T. S. Lee, S. LeGrand, P. Li, C. Lin, T. Luchko, R. Luo, B. Madej, D. Mermelstein, K. M. M. Merz, G. Monard, H. Nguyen, H. Nguyen, I. Omelyan, A. Onufriev, D. R. R. Roe, A. Roitberg, C. Sagui, C. L. Simmerling, W. M. Botello-Smith, J. Swails, R. Walker, J. Wang, R. M. Wolf, X. Wu, L. Xiao and P. A. Kollman, Amber, University of California, San Francisco, CA, USA, 2016 Search PubMed.
- W. L. DeLano, The PyMOL Molecular Graphics System, DeLano Scientific LLC, Palo Alto, CA, 2008, 2021, http://www.pymol.org/ Search PubMed.
- B. R. Miller 3rd, T. D. McGee Jr, J. M. Swails, N. Homeyer, H. Gohlke and A. E. Roitberg, J. Chem. Theory Comput., 2012, 8, 3314–3321 CrossRef PubMed.
- M. Montalti, A. Credi, L. Prodi and M. T. Gandolfi, Handbook of Photochemistry, CRC Press, Taylor and Francis Group, Boca Raton, FL, 2006 Search PubMed.
- C. Ruckebusch, M. Sliwa, P. Pernot, A. de Juan and R. Tauler, J. Photochem. Photobiol., C, 2012, 13, 1–27 CrossRef CAS.
- G. Cosa and J. C. Scaiano, Photochem. Photobiol., 2004, 80, 159–174 CrossRef CAS PubMed.
- M. S. Baptista, J. Cadet, P. Di Mascio, A. A. Ghogare, A. Greer, M. R. Hamblin, C. Lorente, S. C. Nunez, M. S. Ribeiro, A. H. Thomas, M. Vignoni and T. M. Yoshimura, Photochem. Photobiol., 2017, 93, 912–919 CrossRef CAS PubMed.
- D. I. Pattison, A. S. Rahmanto and M. J. Davies, Photochem. Photobiol. Sci., 2012, 11, 38–53 CrossRef CAS PubMed.
- T. Peters, in All about Albumin - Biochemistry, Genetics, and Medical Applications, Elsevier, Academic Press, San Diego, 1995, ch. 3, pp. 76–132 Search PubMed.
- A. Z. Weller, Phys. Chem., 1982, 133, 93–98 CAS.
- A. Harriman, J. Phys. Chem., 1987, 91, 6102–6104 CrossRef CAS.
- C.-Y. Lu and Y.-Y. Liu, Biochim. Biophys. Acta, 2002, 1571, 71–76 CrossRef CAS.
- I. Vayá, I. Andreu, V. T. Monje, M. C. Jimenez and M. A. Miranda, Chem. Res. Toxicol., 2016, 29, 40–46 Search PubMed.
- https://pubchem.ncbi.nlm.nih.gov/compound/Gefitinib .
- A. Albert and J. N. Phillips, J. Chem. Soc., 1956, 1294–1304 RSC.
- T. Peters, in Advances in Protein Chemistry, Academic Press, New York, 1985, vol. 37, pp. 161–245 Search PubMed.
- C. Y. Huang, Methods Enzymol., 1982, 87, 509–525 CAS.
- T. Wybranowski, M. Cyrankiewicz, B. Ziomkowska and S. Kruszewski, Biosystems, 2008, 94, 258–262 CrossRef CAS PubMed.
- T. Itoh, Y. Saura, Y. Tsuda and H. Yamada, Chirality, 1997, 9, 643–649 CrossRef CAS.
- M. Z. Kabir, W.-V. Tee, S. B. Mohamad, Z. Alias and S. Tayyab, RSC Adv., 2016, 6, 91756–91767 RSC.
- J. Li, J. Brahmer, W. Messersmith, M. Hidalgo and S. D. Baker, Invest. New Drugs, 2006, 24, 291–297 CrossRef CAS PubMed.
- J. R. Lakowicz, Principles of Fluorescence Spectroscopy, Plenum Press, New York, 3rd edn, 2006 Search PubMed.
- M. Lukeman and P. Wan, J. Am. Chem. Soc., 2002, 124, 9458–9464 CrossRef CAS PubMed.
- P. Bonancia, I. Vayá, D. Markovitsi, T. Gustavsson, M. C. Jimenez and M. A. Miranda, Org. Biomol. Chem., 2013, 11, 1958–1963 RSC.
- X. Chen, D. S. Larsen, S. E. Bradforth and I. H. van Stokkum, J. Phys. Chem. A, 2011, 115, 3807–3819 CrossRef CAS PubMed.
- G. Rabbani and S. N. Ahn, Int. J. Biol. Macromol., 2019, 123, 979–990 CrossRef CAS PubMed.
- J. Wang, W. Wang, P. A. Kollman and D. A. Case, J. Mol. Graphics Modell., 2006, 25, 247–260 CrossRef CAS PubMed.
- J. Wang, R. M. Wolf, J. W. Caldwell, P. A. Kollman and D. A. Case, J. Comput. Chem., 2004, 25, 1157–1174 CrossRef CAS PubMed.
Footnote |
| † Electronic supplementary information (ESI) available. See https://doi.org/10.1039/d2sc03257k |
| This journal is © The Royal Society of Chemistry 2022 |


