 Open Access Article
Enhanced electrocatalytic activity of Cu-modified, high-index single Pt NPs for formic acid oxidation†
Ke
Huang
and
Richard M.
Crooks
 *
*
Department of Chemistry, Texas Materials Institute, The University of Texas at Austin, 100 E. 24th St., Stop A1590, Austin, Texas 78712, USA. E-mail: crooks@cm.utexas.edu; Tel: +1-512-475-8674
First published on 18th October 2022
Abstract
A key goal of nanoparticle-based catalysis research is to correlate the structure of nanoparticles (NPs) to their catalytic function. The most common approach for achieving this goal is to synthesize ensembles of NPs, characterize the ensemble, and then evaluate its catalytic properties. This approach is effective, but it excludes the certainty of structural heterogeneity in the NP ensemble. One means of addressing this shortcoming is to carry out analyses on individual NPs. This approach makes it possible to establish direct correlations between structures of single NPs and, in the case reported here, their electrocatalytic properties. Accordingly, we report on enhanced electrocatalytic formic acid oxidation (FAO) activity using individual Cu-modified, high-indexed Pt NPs. The results show that the Cu-modified Pt NPs exhibit significantly higher currents for FAO than the Pt-only analogs. The increased activity is enabled by the Cu submonolayer on the highly stepped Pt surface, which enhances the direct FAO pathway but not the indirect pathway which proceeds via surface-absorbed CO*.
Introduction
Nanoparticle electrochemistry comprises an important aspect of the modern chemical industry, particularly as it relates to catalysis and renewable energy. For example, nanoparticles (NPs), acting as electrocatalysts, have found many applications in chemical synthesis,1,2 energy conversion,3,4 and energy storage.5,6 One key finding that has resulted from studies of NP electrocatalysts is that there is a strong correlation between their surface structure and their electrochemical properties. Developing a quantitative understanding of these structure–function relations is fundamental to both the understanding of nanoscale materials and the rational design of efficient electrocatalysts.Until recently, NP structure–function relations were studied using ensembles of nanomaterials that were first synthesized in a single batch, and then characterized as an ensemble. Variations in the size, morphology, and composition within such an ensemble of NPs are inevitable, however, and this intrinsic heterogeneity complicates the quantification of structure–function relationships.7–9 For electrocatalytic NPs specifically, electrochemical characterization methods, such as cyclic voltammetry and chronoamperometry, measure only the average response from an ensemble of materials, which implies any variations within the ensemble will be neglected.
One means of addressing the heterogeneity is to carry out analyses on individual NPs. This approach makes it possible to establish direct correlations between structures of NPs and their electrochemical properties.9–19 Several different techniques have been developed for analyzing the catalytic properties of single NPs. For example, the Unwin group developed scanning electrochemical cell microscopy (SECCM) to map the electrochemical activity and the topography of individual Pt NPs immobilized on single-walled carbon nanotubes.7 Likewise, the Baker group used SECCM to compare the electrocatalytic activity of individual Au NPs having two different shapes.12 The Mirkin and Zhang groups reported separately on electrochemical analyses of single Au NPs immobilized on carbon nanoelectrodes.20,21 The Tao and Chen groups developed spectroscopic methods to simultaneously measure the catalytic activity of individual NPs and locate their catalytic active sites.22,23
The foregoing studies have established methods for analyzing structure–function relationships for single NPs, but they also reveal two significant challenges. First, most single NP studies rely on ligands for shaping, stabilizing, and/or immobilizing single NPs. Such ligands can impact the function of the catalysts.24 Second, it has not been possible to obtain detailed structural analysis of single NPs before or after catalysis. This difficulty compromises the link between structure and function.
Our approach for preparing individually addressable, ligand-free Pt NPs is derived from a method developed by the Sun group for electrodepositing high-index Pt NP ensembles onto macroscopic electrodes.25,26 In our case, we used this method to electrodeposit single ∼200 nm Pt NPs having well-defined shapes onto the tips of carbon nanoelectrodes (CNEs).13,27 A key point is that the electrosynthesis is reproducible, and that very small changes in deposition conditions lead to different shapes. Most importantly, we also showed that these individual Pt NPs can be characterized using advanced microscopy and electrochemical methods, and that their electrocatalytic properties for the formic acid oxidation reaction align well with DFT predictions. Taken together, the foregoing findings provide a foundation for developing a detailed understanding of structure–function relationships of individual electrocatalytic NPs.
Encouraged by these previous results, we now report electrocatalytic findings relating to individual Cu-decorated, shaped Pt NPs. We chose this particular type of bimetallic material for two reasons. First, Cu monolayers can be deposited with high fidelity and reproducibility onto Pt, including NPs, using the method of underpotential deposition (UPD).28–33 Second, Pt–Cu bimetallics, in the form of Pt@Cu core@shell NPs or as alloyed Cu–Pt NPs, have been reported to possess superior electrocatalytic properties for several reactions (e.g., the oxygen reduction reaction,34 the formic acid oxidation (FAO) reaction,35,36 and the CO oxidation reaction37) compared to their single-metal counterparts. Here, we report on the electrochemical FAO reaction at Pt NPs having submonolayer Cu coverage.
The FAO is of significant scientific interest and a particularly good choice for the present study for three reasons. First, it forms the basis of several industrial applications.38,39 Second, it is a good model reaction for understanding small alcohol electrooxidation processes.40,41 Third, the FAO is highly active on Pt electrodes and is well-known for being sensitive to surface structures.42–46 There is still some disagreement over the detailed mechanism of FAO on Pt, but there is consensus regarding some aspects of it. Specifically, there are two oxidation processes that occur in concert on Pt surface. One is an indirect reaction pathway in which surface-bound CO (hereafter, CO*), arising from a nonelectrochemical, Pt-catalyzed reaction of formic acid, acts as an intermediate.47,48 The other is direct oxidation of a formate-derived active intermediate whose exact identity is still debated.49–52
Although CO* is the key intermediate in the indirect oxidation pathway, it also blocks sites on the Pt surface at low overpotentials that would otherwise be available for direct FAO reaction. Specifically, CO* acts as a poison for the Pt surface until the electrode potential is high enough to oxidize CO* to CO2 (∼0.8 V vs. RHE). Studies suggest that sites with at least three adjacent Pt atoms (one empty and two with formate-derived adsorbed species) are required for the formation of CO*.49,50,53 Previous studies have also demonstrated that the poisoning effect is negligible on the Pt(111) surface but facile on Pt(100) and Pt(110).42,54 In other words, in the presence of CO*, Pt(100) and Pt(110) surfaces can seem less active towards FAO than the Pt(111) surface.
The intrinsic electrocatalytic activity towards FAO on each Pt surface can only be measured after CO* is fully oxidized (removed) from the surfaces. This can be accomplished by examining the reverse FAO scan54 or by using pulse voltammetry methods.42,46 The results show that of the three basal planes, the Pt(100) surface yields the highest current density, while the Pt(111) surface yields the lowest.45,54,55 This seemingly contradictory activity in the presence and absence of CO* poisoning suggests that one should consider the indirect and direct pathways separately for a full mechanistic understanding for a specific surface.
In this study, we first present the preparation of shaped, single Pt NPs having {11 5 1} surface facets modified with Cu. Electrochemical measurements show that reproducible, submonolayer Cu coverages can be achieved. Second, we show that after modification with Cu, the single Pt NPs exhibit enhanced electrocatalytic activity for FAO. By studying the stability of the Cu adlayer, the CO* oxidation process on the Cu-modified single Pt NPs, and the dependency of the enhancement on Pt surface structure, we argue that the overall activity enhancement is achieved because the submonolayer of Cu enhances the activity of Pt sites for the direct FAO pathway without affecting the CO*-involved indirect pathway. We also suggest that the pathway-specific enhancement is related to the {11 5 1} Pt surface on which the Cu atoms reside. On this highly stepped surface, the Cu-modified sites are likely different from the CO*-adsorbing sites. Therefore, there is no significant alteration of the activity for the indirect FAO pathway (which involves CO*) after the Cu-modification of the single Pt NPs with {11 5 1} surface facets.
Experimental section
Chemicals and materials
The following chemicals were obtained as received: H2SO4 (OmniTrace, Ultra Grade), CHOOH (MilliporeSigma, 88–90%), (NH4)2Fe(SO4)2·6H2O (MilliporeSigma), [Ru(NH3)6]Cl3 (MilliporeSigma), K2PtCl4 (MilliporeSigma, 99.99% trace metal basis), Cu(ClO4)2 (MilliporeSigma), HClO4 (MilliporeSigma, 70%), and KCl (Fisher). Solutions were prepared using deionized (DI) water (18.2 MΩ cm) from a Milli-Q system (MilliporeSigma).Electrochemistry
All electrochemical reactions and measurements were carried out in a two-electrode cell. The working electrode was a carbon nanoelectrode (CNE, discussed in the ESI†) and the reference electrode was a leak-free Ag|AgCl (3.4 M KCl) miniature reference electrode (eDAQ). The reference electrode was calibrated against a Hg|Hg2SO4 (saturated K2SO4) reference electrode (CH Instrument) and found to have a potential of −433 mV vs. Hg|Hg2SO4 or 217 mV vs. RHE at pH = 0. Hereafter, all potentials are reported vs. RHE.Square-wave potentials were programmed using a function generator (BK Precision). A universal programmer (EG&G, model 175) was used to generate all other necessary waveforms. All potentials and currents were processed through a Chem-Clamp (Dagan) that was set to pass unfiltered current. The gain of the Chem-Clamp was set at 1 mV pA−1. All electrochemical results were recorded using a Labview program.
Fabrication of single Pt NPs supported on CNEs
The fabrication procedure for the CNEs is provided in the ESI.† After fabrication, each CNE was electrochemically assessed by cycling the electrode between 0.13 V and 0.63 V in a solution containing 5.0 mM Ru(NH3)63+ (from [Ru(NH3)6]Cl3) and 0.1 M KCl. An additional assessment was carried out by cycling between 0.25 V and 1.45 V in a solution containing 2 mM Fe2+/3+ (from (NH4)2Fe(SO4)2·6H2O) and 0.2 M HClO4. CNEs that yielded sigmoidal-shaped cyclic voltammograms (CVs) in both the Ru(NH3)63+ and Fe2+/3+ solutions were used for single-NP experiments after being rinsed in 0.1 M H2SO4.Electrodeposition of single Pt NPs onto CNEs was carried out in a solution containing 2.0 mM K2PtCl4 and 0.10 M H2SO4 using procedures reported previously.13 Briefly, a one-step square-wave potential treatment that switched between 1.50 V and 0.19 V at 1.0 kHz was used for electrodepositing and shaping single Pt NPs. During electrodeposition, current responses as a function of time were monitored and used as a proxy for particle size. The electrodeposition process was halted when the current increase due to NP formation reached ∼0.35 nA.
Electron microscopy
Environmental scanning electron microscopy (ESEM) images of CNEs and Pt NPs were acquired using an FEI Quanta 650 microscope at 10.0 kV with a spot size of 3.0. The mounting of single Pt NP-modified CNEs onto transmission electron microscopy (TEM) grids is described in a previous publication.13 The resulting grid was attached to a double-tilt TEM holder (JEOL) that allowed both x and y directional tilting of ∼15°. TEM and selected area electron diffraction (SAED) imaging of Pt NPs were then carried out using a JEOL 2010f microscope at 200 kV.Results and discussion
Preparation of Cu-modified single Pt NPs
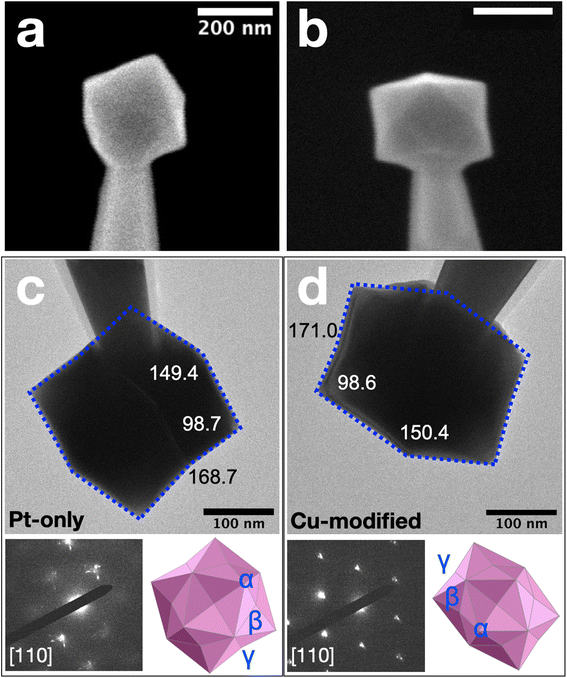
The shape-controlled single Pt NPs were electrodeposited as described in the Experimental section. Following electrodeposition, but prior to electrocatalytic measurements or Cu decoration, all single Pt NPs underwent electrochemical cleaning in N2-purged 0.5 M H2SO4 by scanning their potential between −0.02 V and 1.10 V for 6–8 cycles at 1.0 V s−1. The average size of five independently prepared single Pt NPs, determined by environmental scanning electron microscopy (ESEM), was 187 ± 8 nm and the geometric shape was hexoctahedron (HOH). One representative HOH single Pt NP is shown in Fig. 1a. To demonstrate reproducibility, more single Pt NPs electrodeposited using the same conditions are provided in Fig. S1 in the ESI.† Using the H adsorption charge obtained from the cycles and an approximate charge density of 230 μC cm−2,56,57 we estimate the average surface area of the five HOH single Pt NPs to be 0.28 ± 0.03 μm2.Single Pt NPs having submonolayer coverages of Cu (hereafter single Pt@Cux% NPs, where x% is the measured percentage coverage of Cu) were prepared by Cu UPD following cleaning. Specifically, the single Pt NP was held at a potential of 0.42 V for 240 s in a N2-purged solution containing 10 mM Cu(ClO4)2 and 0.1 M HClO4. Comparison of ESEM images obtained before (Fig. 1a) and after (Fig. 1b) Cu decoration indicate no observable geometric changes arising from the Cu UPD process.
More detailed analysis of the surface faceting of HOH single Pt NPs after electrodeposition of Cu was carried out by transmission electron microscope (TEM) using projection angle analysis. In this method, bright-field TEM images of the HOH single NPs were obtained along the [110] zone axis. Three projection angles, denoted as α, β, and γ, were measured for each HOH single NP. These experimentally measured values were then compared with theoretically predicted values for different {hkl} combinations to determine the Miller indices of the surface facet. Equations for calculating the theoretical projection angles for a Pt HOH NP are provided in Table S1 in the ESI.†
Fig. 1c presents the projection angle results for a typical HOH single Pt NP before Cu modification. The measured angles between edge-on facets are 149.4°, 98.7°, and 168.7° for α, β, and γ, respectively. These measured values are in good agreement with the theoretical values calculated for a {11 5 1} surface (Table S2 in the ESI†). A Pt(11 5 1) surface can be denoted using the microfacet notation as [63(100) + 42(110) + 11(111)],58 which shows the presence of (100) terraces of 3 unit cells, (110) steps of 2 unit cells, and (111) kinks with 1 unit cell. An illustration of the Pt(11 5 1) surface as described above is provided as Fig. S2 in the ESI.†
The projection angle results for a typical HOH single Pt@Cux% NP after Cu modification are presented in Fig. 1d. The measured values in this case are 150.4°, 98.6°, and 171.0° for α, β, and γ, respectively. The small difference in the projection angles before and after Cu modification indicates that the surface facet on the HOH single Pt NPs is not greatly perturbed by the submonolayer of Cu. As will be discussed next, this is likely because less than half a monolayer of Cu is present on top of the Pt NPs, and the resolution of the projection angle analysis is not sufficient to distinguish this amount of Cu from the underlying Pt.
Although we are presenting the structural analysis prior to the electrochemical results, we actually carried out electrochemistry first because the single NPs are not useable for electrochemical measurements after mounting them for SEM or TEM analysis. In other words, all samples that underwent structural analysis had already undergone electrochemical cleaning cyclic voltammograms (CVs) by scanning between −0.02 V and 1.10 V for at least 6 cycles in 0.5 M H2SO4. Additionally, the FAO analysis was carried out by scanning the electrode between 0.01 V and 1.10 V for at least 5 cycles in 0.5 M HCOOH and 0.5 M H2SO4 prior to structural analysis. By obtaining the electrochemical results first and then characterizing the structure, the correlation between structure and function should be reliable.
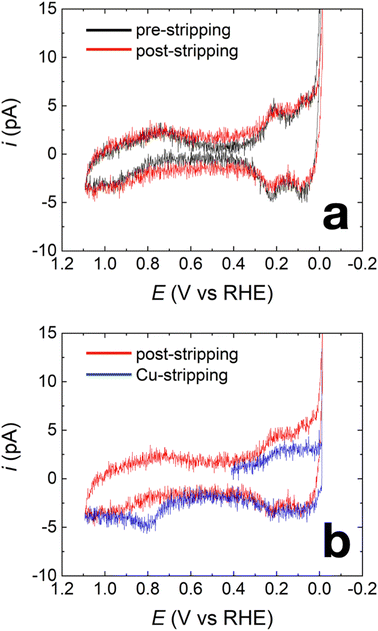
Fig. 2a shows representative capacitance-subtracted CVs of HOH single Pt NP before Cu UPD (black) and after Cu UPD and stripping (red). CVs obtained before capacitance subtraction are provided in Fig. S3 in the ESI.† Typical features of a Pt surface in H2SO4 are present for the HOH single Pt NPs. Other than a slight increase in capacitive current after Cu UPD and stripping, there is little difference in H adsorption/desorption peaks (between 0 and 0.4 V) and in the PtOx-formation/reduction peaks (above 0.7 V). These results indicate that most of the Cu is removed during the stripping scan, which is consistent with previous observations after similar Cu UPD and stripping on Pt NPs.33
The nearly overlapping voltammetric features before Cu UPD and after stripping imply that it is possible to estimate the amount of Cu deposited on the NP surface by integrating the Cu stripping charge. Fig. 2b shows two voltammograms. The blue CV corresponds to Cu stripping from an HOH single Pt@Cux% NP immediately after the 240 s Cu UPD. The red CV was obtained immediately after Cu stripping and serves as a baseline for determining Cu coverage. Integration of the charge resulting from the Cu oxidation peak at ∼0.8 V indicates a Cu coverage of 41 ± 4% (results obtained from four independently prepared single NPs). Accordingly, we term this material Pt@Cu40%.
Electrocatalytic activity
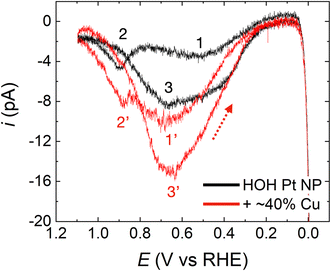
The FAO activities of HOH single Pt NPs and HOH single Pt@Cu40% NPs were assessed by cycling them in N2-purged solutions containing 0.5 M HCOOH and 0.5 M H2SO4.59 The potential was initially scanned from 0.13 V to −0.01 V, reversed until the upper-limit potential of 1.10 V was attained, and then reversed again.Fig. 3 compares FAO CVs for the same HOH single Pt NP before (black) and after (red) ∼40% of the surface was covered with Cu. The black trace in Fig. 3, which represents the FAO on an HOH single Pt-only NP, exhibits features typical of FAO on a Pt surface and is in good agreement with previously reported results.13,42,54 Three peaks that correspond to FAO reaction taking place on a Pt surface, under different surface reaction environments and through different reaction mechanisms, are observed in this CV.
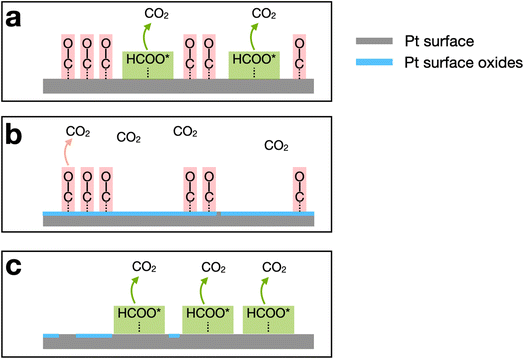
To facilitate understanding of the FAO mechanism, illustrations of the general reaction environment corresponding to each peak are provided in Scheme 1. The three peaks are numbered in the order of their appearance after initiating the scan at 0.13 V and proceeding in the positive scan direction. Initially, CO*, produced by dehydration of formic acid, poisons a significant fraction of the Pt surface sites. Because CO* is not oxidized until >0.8 V on Pt, Pt surface sites that are poisoned by CO* are not capable of electrochemically catalyzing the direct FAO reaction at lower potentials. As a result, peak 1 (∼0.5 V) arises from the direct FAO occurring only on unpoisoned Pt surface sites (Scheme 1a).
As the potential moves further in the positive direction, oxygenated species, originating from water electrolysis, adsorb to the Pt surface. These species block Pt sites and thereby restrict the direct FAO, but they also enable oxidation of CO* via the Langmuir–Hinshelwood mechanism.60–62 In other words, peak 2 (∼0.9 V) arises from the oxidation of previously adsorbed CO* (Scheme 1b). After peak 2, oxidation no longer proceeds due to the presence of the highly oxidized (noncatalytic) Pt surface.
Upon scan reversal, surface oxides on Pt are reduced, and this leads to reactivation of the surface. The reactivated Pt surface is capable of electrochemically catalyzing the direct FAO until CO* once again poisons the surface at low potentials, usually below 0.5 V. Accordingly, peak 3, present upon scan reversal, is attributed to the direct oxidation of formic acid on the CO*-free Pt surface (Scheme 1c). The ratio between the currents corresponding to peaks 1 and 3 (the two direct oxidation peaks), reflects the effect that CO*-poisoning has on the HOH single Pt NP surface during the forward scan. Specifically, a lower ratio indicates that a lower fraction of the surface is capable of electrocatalyzing FAO due to the presence of CO*.54,56
The CV for the HOH single Pt NP after depositing 40% of a Cu monolayer (i.e., Pt@Cu40% NP, red trace in Fig. 3) largely preserves the basic shape of the FAO on the Pt-only surface. The three peaks in the CV are directly compared with peak 1, 2, and 3 for the HOH single Pt NP and are marked accordingly as peak 1′, 2′, and 3′. Preservation of the three peaks indicates that the FAO reaction mechanism on the Pt@Cu40% NP is similar to that on the naked Pt-only surface. To be more specific, however, we compared the onset potentials of peak 1 and peak 1′. Here, we define the onset potential as the potential at which 5% of the maximum current is achieved. Following that definition, we found that the onset of the first oxidation peak for the FAO reaction is similar before (∼0.24 V) and after (∼0.26 V) Cu decoration.
The potentials for peak 2′ and peak 3′ for the Pt@Cu40% NP are also at the same potentials as peak 2 (0.89 V) and peak 3 (0.69 V) before Cu decoration. This result strongly suggests that the reaction sites on the HOH single Pt@Cu40% NPs, for the indirect FAO through CO* oxidation (peak 2′) and the direct FAO on a CO*-free surface (peak 3′), are similar to those on the Pt-only NPs. In other words, the active sites for CO* oxidation and the direct FAO on a CO*-free surface must both be Pt sites regardless of the presence of Cu.
In addition to the similarities between the two CVs in Fig. 3, there are also three obvious differences. First and foremost, both the forward and reverse currents are significantly higher after Cu decoration (recall that the exact same single-NP electrode was used for both the black and red CVs). Accordingly, the enhanced current on the Cu-modified Pt NP means that the Pt@Cu40% NP surface is more active for the FAO reaction than the corresponding Pt-only surface before Cu modification. Second, the position of peak 1′ is ∼150 mV more positive after Cu decoration than peak 1 for the Pt-only NP. This suggests that the reaction environment is somewhat different before and after Cu deposition for the direct FAO (when the surface is partially covered by CO*, Scheme 1a). The features of the CVs shown in Fig. 3 are fully reproducible as shown by the replicates presented in Fig. S4.† Finally, the ratio between the peak 1′ and 2′ currents after Cu modification is greater than the ratio observed before Cu modification (i.e., between peaks 1 and 2). As discussed earlier in the context of Scheme 1, the peak 1 current (or peak 1′ after Cu decoration) corresponds to the direct FAO on unpoisoned surface sites, while the peak 2 current (or peak 2′) corresponds to the indirect FAO through the oxidation of CO*. Hence, by estimating the ratio of the currents of the first and second peaks, it is possible to gain a qualitative understanding of the effect of surface-poisoning CO* on the rest of the unpoisoned CO* sites for catalyzing the direct FAO. From Fig. 3, we can clearly observe that ipeak1′/ipeak2′ is greater than ipeak1/ipeak2, indicating that the poisoning CO* on the HOH Pt@Cu40% NP surface has a less significant effect on the direct FAO reaction on unpoisoned sites than CO* on HOH Pt-only NP surface. This finding supports the better activity of the HOH Pt@Cu40% NP surface towards the FAO reaction compared to its Pt-only counterpart.
To ensure that the potential excursions associated with the FAO CVs do not remove Cu from the Pt@Cu40% NP electrodes, we estimated the amount of Cu remaining on the single NPs after FAO measurements. Fig. 4 shows a comparison of the CVs in 0.5 M H2SO4 for a typical single HOH Pt NP (black) and its Pt@Cu40% counterpart (red). Both CVs were obtained after an FAO CV. The H adsorption/desorption peaks for the Pt@Cu40% NP are significantly smaller than those for the Pt-only NP, which suggests the presence of Cu. Interestingly, the estimated Pt surface area on the Pt@Cu40% NP is ∼62% of the original Pt surface area, which implies a ∼38% surface coverage of Cu. As discussed earlier, the initial Cu coverage immediately following Cu UPD was 41 ± 4%, and therefore we conclude that all or most of the Cu originally present on the Pt surface remains present following FAO CVs. According, we believe the observed activity enhancement arises from the presence of Cu on the Pt surface.
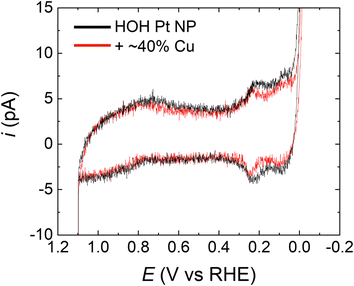 | ||
| Fig. 4 CVs for representative HOH single Pt NP (black) and the same NP after modification with 40% of a Cu monolayer (red). The CVs were obtained as follows. First, the electrodes were cycled at least five times using the conditions for FAO analysis (i.e., same as in Fig. 3). Second, the electrodes were scanned three times in 0.5 M H2SO4 over the potential range shown in the figure. The CVs presented here are the third CV obtained in 0.5 M H2SO4. The decrease in the peaks in the H adsorption/desorption region in the red trace supports the presence of the submonolayer Cu even after the initial FAO CVs. The scan rate was 1.0 V s−1. | ||
In addition to the just-discussed measurements obtained in acidic solution, additional experiments were carried out in 0.1 M NaOH. Results from these experiments serve as additional support for (1) the presence of Cu after the UPD process and (2) the stability of the Cu modification submonolayer after FAO measurements. The step-by-step experimental procedure is provided in the ESI,† but the results are summarized next.
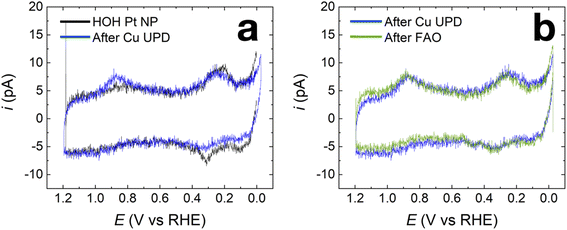
Fig. 5a compares the CVs of the HOH single Pt NP (black) and its HOH single Pt@Cu40% counterpart (blue) immediately after Cu UPD. As shown in Fig. 5a, the current in the blue trace decreases in the H adsorption/desorption region between 0.00 V and 0.50 V. Additionally, a pair of peaks emerge between 0.60 V and 1.20 V for the blue trace, indicating the presence of Cu over part of the Pt surface after Cu UPD.63 The blue trace in Fig. 5b is the same as the blue trace in Fig. 5a, but here it is compared with a CV obtained using an HOH single Pt@Cu40% NP after FAO measurements (green). As clearly shown in Fig. 5b, the CV obtained using the HOH Pt@Cu40% NP after FAO overlaps well with the one obtained before FAO. This result indicates that the submonolayer of Cu on HOH Pt NPs is stable during FAO.
An additional control experiment, which is described in detail in the ESI,† was also performed to further ensure the direct relationship between the introduction of Cu and the increased activity of the HOH single Pt NPs for FAO. It is also worth mentioning that in this study we were only able to obtain support for the presence of Cu on the single Pt NPs, following Cu UPD and subsequent FAO, through electrochemical measurements. Elemental mapping techniques like EDX were not viable for our NPs due to the large Pt single NP diameter in contrast to the less than one monolayer of Cu on the surface.
Effect of Cu on FAO
As discussed earlier, there are two reaction pathways for FAO on Pt: the direct pathway and the indirect pathway (which proceeds via CO* oxidation). To better understand the effect that the presence of Cu has on each of these, we examined CO* oxidation using Pt-only and Pt@Cu40% single HOH NPs. This test mimics CO* formation, adsorption, and oxidation during the FAO reaction, and therefore provides information about the activities of the two different types of NPs for the indirect FAO pathway.The foregoing experiment was carried out as follows. After recording five consecutive FAO CVs, the single NP electrodes were placed in the formic acid solution for 60 s at 0.12 V, which is sufficiently low to induce CO* adsorption. The electrodes were then transferred to a formic acid-free, 0.5 M H2SO4 solution so that the amount of CO* on the surface could be evaluated electrochemically.
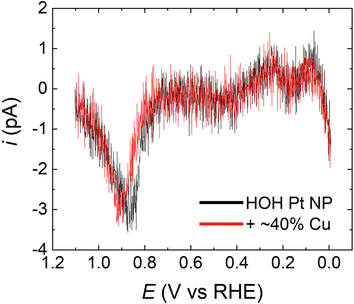
Fig. 6 shows a comparison of the resulting CO* stripping voltammograms for a typical HOH single Pt NP (black) and its Pt@Cu40% analog (red). The CO* oxidation peak potentials in the two cases overlap almost exactly regardless of the presence (0.90 V) or absence (0.87 V) of Cu. Moreover, the surface coverage of CO*, as judged by the charge under the oxidation peaks, corresponds to ∼42% ± 2% (no Cu) and ∼36% ± 2% (Cu present) of the total Pt surface area. The similarity of the peak potentials and charge suggests that the majority of CO* on the two surfaces is in very similar environments. These findings further imply that the Pt@Cu40% surface has a similar activity for CO* formation in formic acid as the Pt-only surface. Accordingly, we contend that the CO* binding sites on the two surfaces are similar.
On the basis of the foregoing discussion, it is logical to conclude that the activity for the indirect FAO reaction of HOH single Pt@Cu40% and Pt-only NPs is substantially the same. As a result, the increased current for the FAO observed on HOH single Pt@Cu40% NPs must be caused primarily by an increase in activity of the direct FAO pathway. Moreover, it is also reasonable to argue that Cu atoms do not block CO* binding sites significantly on the HOH single Pt NPs. Otherwise, a stripping peak having a different peak potential or charge would be observed.
Surface-related activity enhancement
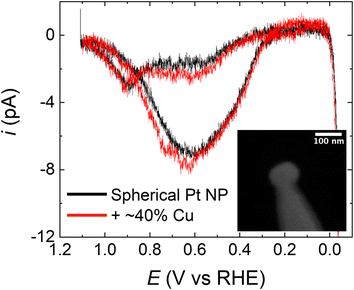
It is important to emphasize that, judging from the Miller indices, the surface facets on the HOH single Pt NPs are highly stepped. Accordingly, we next examined the effect that the surface structure of Pt has on the observed FAO activity enhancement after Cu modification. This analysis was carried out by comparing the FAO activity of HOH single Pt@Cu40% NPs with spherical, polycrystalline single Pt NPs modified with Cu.Polycrystalline spherical single Pt NPs were prepared by electrodeposition using a CV method reported elsewhere.13 A comparison of FAO CVs obtained using a spherical single Pt NP and HOH single Pt NPs, without Cu modification, is provided in Fig. S6.† The most significant difference between the spherical and HOH single Pt NPs during FAO is that the HOH NP surface has an earlier onset potential (∼0.21 V) for direct FAO on non-poisoned sites than the polycrystalline NP surface (∼0.30 V). These results are in agreement with our previous reports.13 A submonolayer Cu coverage of ∼40% was deposited on the spherical single Pt NPs via UPD for 240 s at 0.45 V in a solution containing 10 mM Cu(ClO4)2 and 0.1 M HClO4. Fig. 7 presents a comparison of CVs obtained using a spherical Pt NP before (black) and after (red) modification with ∼40% of a Cu monolayer. The obvious observation is that there is little difference between the CVs, which is in contrast to the results in Fig. 3, and it indicates that in the spherical-NP case the submonolayer coverage of Cu does not significantly affect FAO. Importantly, Fig. S7 in the ESI† shows that the submonolayer of Cu remains present on the surface of the spherical Pt NP even after the FAO scan shown in Fig. 7. Therefore, the absence of the type of activity enhancement shown in Fig. 3 is not due to the loss of surface Cu in the case of the spherical Pt NP.
To further investigate the effect of submonolayer Cu on the spherical single Pt NPs and on the HOH single Pt NPs, we performed CO*-stripping voltammograms on the spherical NP before and after Cu-modification (Fig. S8 in the ESI†). This experiment is analogous to that shown in Fig. 6 for the HOH Pt NP. In the case of the spherical Pt NP, however, a significant amount (∼50%) of CO* oxidation charge is lost when 40% of a monolayer of Cu is present on the Pt surface. This observation shows that the Cu-modified spherical single Pt NP is less active towards CO* binding and oxidation (the indirect FAO reaction). Recall that in the case of the HOH Pt NP, no significant CO* charge was lost when the submonolayer of Cu was added to the surface, indicating that Cu does not affect the CO* oxidation process associated with the indirect FAO reaction pathway.
There are two important implications of the results arising from the polycrystalline spherical single Pt NP experiments that provide insight into the activity enhancement observed for HOH single Pt@Cu40% NPs. First, the difference between the FAO CVs for the spherical (Fig. 7) and HOH (Fig. 3) Pt NPs following Cu modification shows that not all Cu deposited on the Pt surface impacts the electrocatalytic properties of the NP and can induce the activity increase for FAO reaction. This means that the enhancement of the HOH single Pt@Cu40% NPs for FAO arises not only from the presence of Cu but also from some unique features of the underlying stepped {11 5 1} surface.
Second, the CO* stripping results for spherical single Pt NPs before and after Cu modification imply that the submonolayer of Cu on the polycrystalline Pt NP surface blocks some active sites for CO* binding and oxidation. This contrasts with the results observed for the HOH Pt NP surface. In that case, little difference is observed between the CO* stripping voltammograms with and without Cu-modification, and hence we concluded that the Cu sites are probably not the CO* binding sites. As we discussed earlier, we believe the origin of the site separation for Cu deposition and CO* binding/oxidation on the HOH single Pt@Cu40% NPs is the highly stepped feature of {11 5 1} Pt surface. In any event, the results from polycrystalline spherical Pt NPs strongly suggest that the FAO activity enhancement caused by the submonolayer of Cu is not general for any Pt@Cu NP combination but surface-structure specific. Furthermore, the degree of perturbation that a submonolayer of Cu has on CO* binding and oxidation processes during FAO is also surface structure specific.
Summary and conclusions
In this paper, we have reported the preparation and characterization of HOH-shaped single Pt NPs with {11 5 1} surfaces. Using a controlled UPD process it was possible to reproducibly electrodeposit ∼40% of a Cu monolayer on the surface of the Pt NPs. Most importantly, we have shown that the activity of HOH Pt single NPs modified with ∼40% of a monolayer of Cu on the surface is higher than for an identical Cu-free HOH single Pt NPs for the FAO reaction. Results presented herein suggest that the enhanced activity is induced by the Cu adlayer and related to the highly stepped Pt surface. Specifically, peak potentials and onset potentials in FAO CVs suggest that the active sites on both the Pt-only and Cu-modified HOH single NPs are Pt. Electrochemical results for CO* stripping experiments suggest that Cu enhances the direct FAO pathway without significantly affecting the indirect pathway.Determining the exact location and oxidation state of Cu on the highly stepped Pt NP surface is challenging. This problem is exacerbated for the single NP electrodes reported here due to their small size and configuration. These features make bulk measurements, such as X-ray absorption spectroscopy and high-resolution TEM techniques, such as electron energy loss spectroscopy, impossible. Consequently, future structural studies will need to rely principally on theoretical models.
Author contributions
RMC and KH designed the experiments, KH performed the experiments, and both authors contributed to the writing of the manuscript.Conflicts of interest
The authors declare no competing interests.Acknowledgements
We gratefully acknowledge support from the National Science Foundation (Grant: CHE-1855980). We also acknowledge the Robert A. Welch Foundation (Grant: F-0032) for sustained support of our research. We also sincerely thank Dr K. Jarvis for her assistance with the TEM imaging results.References
- Y. Inoue, M. Kitano, K. Kishida, H. Abe, Y. Niwa, M. Sasase, Y. Fujita, H. Ishikawa, T. Yokoyama, M. Hara and H. Hosono, Efficient and Stable Ammonia Synthesis by Self-Organized Flat Ru Nanoparticles on Calcium Amide, ACS Catal., 2016, 6(11), 7577–7584, DOI:10.1021/acscatal.6b01940.
- X. Guo, H. Du, F. Qu and J. Li, Recent Progress in Electrocatalytic Nitrogen Reduction, J. Mater. Chem. A, 2019, 7(8), 3531–3543, 10.1039/c8ta11201k.
- P. Trogadas and M.-O. Coppens, Nature-Inspired Electrocatalysts and Devices for Energy Conversion, Chem. Soc. Rev., 2020, 3107–3141, 10.1039/c8cs00797g.
- T. Sheng, Y.-F. Xu, Y.-X. Jiang, L. Huang, N. Tian, Z.-Y. Zhou, I. Broadwell and S.-G. Sun, Structure Design and Performance Tuning of Nanomaterials for Electrochemical Energy Conversion and Storage, Acc. Chem. Res., 2016, 49(11), 2569–2577, DOI:10.1021/acs.accounts.6b00485.
- A. S. Aricò, P. Bruce, B. Scrosati, J. Tarascon and W. van Schalkwijk, Nanostructured Materials for Advanced Energy Conversion and Storage Devices, Nat. Mater., 2005, 4(5), 366–377, DOI:10.1038/nmat1368.
- C. D. Wessells, M. T. McDowell, S. V. Peddada, M. Pasta, R. A. Huggins and Y. Cui, Tunable Reaction Potentials in Open Framework Nanoparticle Battery Electrodes for Grid-Scale Energy Storage, ACS Nano, 2012, 6(2), 1688–1694, DOI:10.1021/nn204666v.
- S. C. S. Lai, P. v. Dudin, J. v. MacPherson and P. R. Unwin, Visualizing Zeptomole (Electro)Catalysis at Single Nanoparticles within an Ensemble, J. Am. Chem. Soc., 2011, 133(28), 10744–10747, DOI:10.1021/ja203955b.
- X. Xiao, F.-R. F. Fan, J. Zhou and A. J. Bard, Current Transient in Single Nanoparticle Collision Events, J. Am. Chem. Soc., 2008, 130(22), 16669–16677, DOI:10.1021/ja8051393.
- W. Wei, T. Yuan, W. Jiang, J. Gao, H. Y. Chen and W. Wang, Accessing the Electrochemical Activity of Single Nanoparticles by Eliminating the Heterogeneous Electrical Contacts, J. Am. Chem. Soc., 2020, 142(33), 14307–14313, DOI:10.1021/jacs.0c06171.
- T. Tarnev, H. B. Aiyappa, A. Botz, T. Erichsen, A. Ernst, C. Andronescu and W. Schuhmann, Scanning Electrochemical Cell Microscopy Investigation of Single ZIF-Derived Nanocomposite Particles as Electrocatalysts for Oxygen Evolution in Alkaline Media, Angew. Chem., Int. Ed., 2019, 58(40), 14265–14269, DOI:10.1002/anie.201908021.
- S. E. F. Kleijn, S. C. S. Lai, T. S. Miller, A. I. Yanson, M. T. M. Koper and P. R. Unwin, Landing and Catalytic Characterization of Individual Nanoparticles on Electrode Surfaces, J. Am. Chem. Soc., 2012, 134(45), 18558–18561, DOI:10.1021/ja309220m.
- M. Choi, N. P. Siepser, S. Jeong, Y. Wang, G. Jagdale, X. Ye and L. A. Baker, Probing Single-Particle Electrocatalytic Activity at Facet-Controlled Gold Nanocrystals, Nano Lett., 2020, 20(2), 1233–1239, DOI:10.1021/acs.nanolett.9b04640.
- K. Huang, K. Shin, G. Henkelman and R. M. Crooks, Correlating Surface Structures and Electrochemical Activity Using Shape-Controlled Single-Pt Nanoparticles, ACS Nano, 2021, 15(11), 17926–17937, DOI:10.1021/acsnano.1c06281.
- X. Xiao and A. J. Bard, Observing Single Nanoparticle Collisions at an Ultramicroelectrode by Electrocatalytic Amplification, J. Am. Chem. Soc., 2007, 129(31), 9610–9612, DOI:10.1021/ja072344w.
- S. J. Kwon and A. J. Bard, Analysis of Diffusion-Controlled Stochastic Events of Iridium Oxide Single Nanoparticle Collisions by Scanning Electrochemical Microscopy, J. Am. Chem. Soc., 2012, 134(16), 7102–7108, DOI:10.1021/ja300894f.
- M. Zhou, Y. Yu, K. Hu, H. L. Xin and M. v. Mirkin, Collisions of Ir Oxide Nanoparticles with Carbon Nanopipettes: Experiments with One Nanoparticle, Anal. Chem., 2017, 89(5), 2880–2885, DOI:10.1021/acs.analchem.6b04140.
- T. J. Anderson and B. Zhang, Single-Nanoparticle Electrochemistry through Immobilization and Collision, Acc. Chem. Res., 2016, 49(11), 2625–2631, DOI:10.1021/acs.accounts.6b00334.
- X. Li, H. Hodson, C. Batchelor-Mcauley, L. Shao and R. G. Compton, Improving Formate and Methanol Fuels: Catalytic Activity of Single Pd Coated Carbon Nanotubes, ACS Catal., 2016, 6(10), 7118–7124, DOI:10.1021/acscatal.6b02023.
- A. El Arrassi, Z. Liu, M. v. Evers, N. Blanc, G. Bendt, S. Saddeler, D. Tetzlaff, D. Pohl, C. Damm, S. Schulz and K. Tschulik, Intrinsic Activity of Oxygen Evolution Catalysts Probed at Single CoFe2O4 Nanoparticles, J. Am. Chem. Soc., 2019, 141(23), 9197–9201, DOI:10.1021/jacs.9b04516.
- Y. Li, J. T. Cox and B. Zhang, Electrochemical Responses and Electrocatalysis at Single Au Nanoparticles, J. Am. Chem. Soc., 2010, 132(9), 3047–3054, DOI:10.1021/ja909408q.
- Y. Yu, Y. Gao, K. Hu, P. Y. Blanchard, J. M. Noël, T. Nareshkumar, K. L. Phani, G. Friedman, Y. Gogotsi and M. v. Mirkin, Electrochemistry and Electrocatalysis at Single Gold Nanoparticles Attached to Carbon Nanoelectrodes, ChemElectroChem, 2015, 2(1), 58–63, DOI:10.1002/celc.201402312.
- X. Shan, I. Díez-Pérez, L. Wang, P. Wiktor, Y. Gu, L. Zhang, W. Wang, J. Lu, S. Wang, Q. Gong, J. Li and N. Tao, Imaging the Electrocatalytic Activity of Single Nanoparticles, Nat. Nanotechnol., 2012, 7(10), 668–672, DOI:10.1038/nnano.2012.134.
- X. Zhou, N. M. Andoy, G. Liu, E. Choudhary, K.-S. Han, H. Shen and P. Chen, Quantitative Super-Resolution Imaging Uncovers Reactivity Patterns on Single Nanocatalysts, Nat. Nanotechnol., 2012, 7(4), 237–241, DOI:10.1038/nnano.2012.18.
- L. Lu, S. Zou and B. Fang, The Critical Impacts of Ligands on Heterogeneous Nanocatalysis: A Review, ACS Catal., 2021, 11(10), 6020–6058, DOI:10.1021/acscatal.1c00903.
- N. Tian, Z.-Y. Zhou, S.-G. Sun, Y. Ding and Z. L. Wang, Synthesis of Tetrahexahedral Platinum Nanocrystals with High-Index Facets and High Electro-Oxidation Activity, Science, 2007, 316(5825), 732–735, DOI:10.1126/science.1140484.
- B.-A. Lu, J.-H. Du, T. Sheng, N. Tian, J. Xiao, L. Liu, B.-B. Xu, Z.-Y. Zhou and S.-G. Sun, Hydrogen Adsorption-Mediated Synthesis of Concave Pt Nanocubes and Their Enhanced Electrocatalytic Activity, Nanoscale, 2016, 8(22), 11559–11564, 10.1039/C6NR02349E.
- K. Huang, J. Clausmeyer, L. Luo, K. Jarvis and R. M. Crooks, Shape-Controlled Electrodeposition of Single Pt Nanocrystals onto Carbon Nanoelectrodes, Faraday Discuss., 2018, 210, 267–280, 10.1039/C8FD00018B.
- E. Herrero, L. J. Buller and H. D. Abruña, Underpotential Deposition at Single Crystal Surfaces of Au, Pt, Ag and Other Materials, Chem. Rev., 2001, 101(7), 1897–1930, DOI:10.1021/cr9600363.
- E. Garnier, F. J. Vidal-Iglesias, J. M. Feliu and J. Solla-Gullón, Surface Structure Characterization of Shape and Size Controlled Pd Nanoparticles by Cu UPD: A Quantitative Approach, Front. Chem., 2019, 7, 1–11, DOI:10.3389/fchem.2019.00527.
- E. V. Carino, H. Y. Kim, G. Henkelman and R. M. Crooks, Site-Selective Cu Deposition on Pt Dendrimer-Encapsulated Nanoparticles: Correlation of Theory and Experiment, J. Am. Chem. Soc., 2012, 134(9), 4153–4162, DOI:10.1021/ja209115e.
- L. J. Buller, E. Herrero, R. Gómez, J. M. Feliu and H. D. Abruña, Induced Adsorption of Sulfate/Bisulfate Anions by Submonolayer Amounts of Copper on Deliberately Stepped Pt Surfaces, J. Chem. Soc., Faraday Trans., 1996, 92(20), 3757–3762, 10.1039/FT9969203757.
- H. D. Abruña, J. M. Feliu, J. D. Brock, L. J. Buller, E. Herrero, J. Li, R. Gómez and A. Finnefrock, Anion and Electrode Surface Structure Effects on the Deposition of Metal Monolayers: Electrochemical and Time-Resolved Surface Diffraction Studies, Electrochim. Acta, 1998, 43(19–20), 2899–2909, DOI:10.1016/S0013-4686(98)00030-9.
- E. V. Carino and R. M. Crooks, Characterization of Pt@Cu Core@Shell Dendrimer-Encapsulated Nanoparticles Synthesized by Cu Underpotential Deposition, Langmuir, 2011, 27(7), 4227–4235, DOI:10.1021/la2001915.
- L. Han, H. Liu, P. Cui, Z. Peng, S. Zhang and J. Yang, Alloy Cu3Pt Nanoframes through the Structure Evolution in Cu-Pt Nanoparticles with a Core-Shell Construction, Sci. Rep., 2014, 4, 1–6, DOI:10.1038/srep06414.
- L. Huang, C. Y. Zheng, B. Shen and C. A. Mirkin, High-Index-Facet Metal-Alloy Nanoparticles as Fuel Cell Electrocatalysts, Adv. Mater., 2020, 32(30), 1–6, DOI:10.1002/adma.202002849.
- Y. Jia, Y. Jiang, J. Zhang, L. Zhang, Q. Chen, Z. Xie and L. Zheng, Unique Excavated Rhombic Dodecahedral PtCu3 Alloy Nanocrystals Constructed with Ultrathin Nanosheets of High-Energy {110} Facets, J. Am. Chem. Soc., 2014, 136(10), 3748–3751, DOI:10.1021/ja413209q.
- L. Luo, L. Zhang, Z. Duan, A. S. Lapp, G. Henkelman and R. M. Crooks, Efficient CO Oxidation Using Dendrimer-Encapsulated Pt Nanoparticles Activated with <2% Cu Surface Atoms, ACS Nano, 2016, 10(9), 8760–8769, DOI:10.1021/acsnano.6b04448.
- X. Yu and P. G. Pickup, Recent Advances in Direct Formic Acid Fuel Cells (DFAFC), J. Power Sources, 2008, 182(1), 124–132, DOI:10.1016/j.jpowsour.2008.03.075.
- M. Grasemann and G. Laurenczy, Formic Acid as a Hydrogen Source - Recent Developments and Future Trends, Energy Environ. Sci., 2012, 5(8), 8171–8181, 10.1039/c2ee21928j.
- R. Parsons and T. VanderNoot, The Oxidation of Small Organic Molecules. A Survey of Recent Fuel Cell Related Research, J. Electroanal. Chem., 1988, 257(1–2), 9–45, DOI:10.1016/0022-0728(88)87028-1.
- K. A. Schwarz, R. Sundararaman, T. P. Moffat and T. C. Allison, Formic Acid Oxidation on Platinum: A Simple Mechanistic Study, Phys. Chem. Chem. Phys., 2015, 17(32), 20805–20813, 10.1039/C5CP03045E.
- V. Grozovski, V. Climent, E. Herrero and J. M. Feliu, Intrinsic Activity and Poisoning Rate for HCOOH Oxidation on Platinum Stepped Surfaces, Phys. Chem. Chem. Phys., 2010, 12(31), 8822–8831, 10.1039/b925472b.
- Y. Kang, M. Li, Y. Cai, M. Cargnello, R. E. Diaz, T. R. Gordon, N. L. Wieder, R. R. Adzic, R. J. Gorte, E. A. Stach and C. B. Murray, Heterogeneous Catalysts Need Not Be so “Heterogeneous”: Monodisperse Pt Nanocrystals by Combining Shape-Controlled Synthesis and Purification by Colloidal Recrystallization, J. Am. Chem. Soc., 2013, 135(7), 2741–2747, DOI:10.1021/ja3116839.
- V. Grozovski, J. Solla-Gullón, V. Climent, E. Herrero and J. M. Feliu, Formic Acid Oxidation on Shape-Controlled Pt Nanoparticles Studied by Pulsed Voltammetry, J. Phys. Chem. C, 2010, 114(32), 13802–13812, DOI:10.1021/jp104755b.
- J. Clavilier, R. Parsons, R. Durand, C. Lamy and J. M. Leger, Formic Acid Oxidation on Single Crystal Platinum Electrodes. Comparison with Polycrystalline Platinum, J. Electroanal. Chem., 1981, 124(1–2), 321–326, DOI:10.1016/S0022-0728(81)80311-7.
- V. Grozovski, V. Climent, E. Herrero and J. M. Feliu, Intrinsic Activity and Poisoning Rate for HCOOH Oxidation at Pt(100) and Vicinal Surfaces Containing Monoatomic (111) Steps, ChemPhysChem, 2009, 10(11), 1922–1926, DOI:10.1002/cphc.200900261.
- V. S. Bagotzky, Y. B. Vassiliev and O. A. Khazova, Generalized Scheme of Chemisorption, Electrooxidation and Electroreduction of Simple Organic Compounds on Platinum Group Metals, J. Electroanal. Chem., 1977, 81(2), 229–238, DOI:10.1016/S0022-0728(77)80019-3.
- B. Beden, A. Bewick and C. Lamy, A Comparative Study of Formic Acid Adsorption on a Platinum Electrode by Both Electrochemical and Emirs Techniques, J. Electroanal. Chem. Interfacial Electrochem., 1983, 150(1–2), 505–511, DOI:10.1016/S0022-0728(83)80230-7.
- A. Ferre-Vilaplana, J. V. Perales-Rondón, C. Buso-Rogero, J. M. Feliu and E. Herrero, Formic Acid Oxidation on Platinum Electrodes: A Detailed Mechanism Supported by Experiments and Calculations on Well-Defined Surfaces, J. Mater. Chem. A, 2017, 5(41), 21773–21784, 10.1039/C7TA07116G.
- A. Cuesta, G. Cabello, M. Osawa and C. Gutiérrez, Mechanism of the Electrocatalytic Oxidation of Formic Acid on Metals, ACS Catal., 2012, 2(5), 728–738, DOI:10.1021/cs200661z.
- Y. X. Chen, M. Heinen, Z. Jusys and R. J. Behm, Bridge-Bonded Formate: Active Intermediate or Spectator Species in Formic Acid Oxidation on a Pt Film Electrode?, Langmuir, 2006, 22(25), 10399–10408, DOI:10.1021/la060928q.
- G. Samjeské, A. Miki, S. Ye and M. Osawa, Mechanistic Study of Electrocatalytic Oxidation of Formic Acid at Platinum in Acidic Solution by Time-Resolved Surface-Enhanced Infrared Absorption Spectroscopy, J. Phys. Chem. B, 2006, 110(33), 16559–16566, DOI:10.1021/jp0618911.
- A. Cuesta, M. Escudero, B. Lanova and H. Baltruschat, Cyclic Voltammetry, FTIRS, and DEMS Study of the Electrooxidation of Carbon Monoxide, Formic Acid, and Methanol on Cyanide-Modified Pt(111) Electrodes, Langmuir, 2009, 25(11), 6500–6507, DOI:10.1021/la8041154.
- J. Solla-Gullón, F. J. Vidal-Iglesias, A. López-Cudero, E. Garnier, J. M. Feliu and A. Aldaz, Shape-Dependent Electrocatalysis: Methanol and Formic Acid Electrooxidation on Preferentially Oriented Pt Nanoparticles, Phys. Chem. Chem. Phys., 2008, 10(25), 3689, 10.1039/b802703j.
- R. R. Adžić, A. V. Tripkoviá and W. E. O'grady, Structural Effects in Electrocatalysis, Nature, 1982, 296(5853), 137–138, DOI:10.1038/296137a0.
- Q. S. Chen, Z. Y. Zhou, F. J. Vidal-Iglesias, J. Solla-Gullón, J. M. Feliu and S.-G. Sun, Significantly Enhancing Catalytic Activity of Tetrahexahedral Pt Nanocrystals by Bi Adatom Decoration, J. Am. Chem. Soc., 2011, 133(33), 12930–12933, DOI:10.1021/ja2042029.
- J. V. Perales-Rondón, E. Herrero and J. M. Feliu, Effects of the Anion Adsorption and PH on the Formic Acid Oxidation Reaction on Pt(111) Electrodes, Electrochim. Acta, 2014, 140, 511–517, DOI:10.1016/j.electacta.2014.06.057.
- M. A. van Hove and G. A. Somorjai, A New Microfacet Notation for High-Miller-Index Surfaces of Cubic Materials with Terrace, Step and Kink Structures, Surf. Sci., 1980, 92(2–3), 489–518, DOI:10.1016/0039-6028(80)90219-8.
- Z. Fang and W. Chen, Recent Advances in Formic Acid Electro-Oxidation: From the Fundamental Mechanism to Electrocatalysts, Nanoscale Adv., 2021, 3(1), 94–105, 10.1039/d0na00803f.
- A. Cuesta, A. Couto, A. Rincón, M. C. Pérez, A. López-Cudero and C. Gutiérrez, Potential Dependence of the Saturation CO Coverage of Pt Electrodes: The Origin of the Pre-Peak in CO-Stripping Voltammograms. Part 3: Pt(Poly), J. Electroanal. Chem., 2006, 586(2), 184–195, DOI:10.1016/j.jelechem.2005.10.006.
- M. J. S. Farias, G. A. Camara and J. M. Feliu, Understanding the CO Preoxidation and the Intrinsic Catalytic Activity of Step Sites in Stepped Pt Surfaces in Acidic Medium, J. Phys. Chem. C, 2015, 119(35), 20272–20282, DOI:10.1021/acs.jpcc.5b05386.
- A. V. Rudnev, A. Kuzume, Y. Fu and T. Wandlowski, CO Oxidation on Pt(100): New Insights Based on Combined Voltammetric, Microscopic and Spectroscopic Experiments, Electrochim. Acta, 2014, 133, 132–145, DOI:10.1016/j.electacta.2014.04.034.
- P. Borthen, B. J. Hwang, H. H. Strehblow and D. M. Kolb, In Situ Observation of the Potential-Dependent Chemical State and Structure of a Cu Monolayer Deposited on the Surface of Carbon-Supported Platinum Clusters, J. Phys. Chem. B, 2000, 104(21), 5078–5083, DOI:10.1021/jp993168j.
Footnote |
| † Electronic supplementary information (ESI) available. See DOI: https://doi.org/10.1039/d2sc03433f |
| This journal is © The Royal Society of Chemistry 2022 |

