 Open Access Article
Ultra-short helix pitch and spiral ordering in cholesteric liquid crystal revealed by resonant soft X-ray scattering†
Alevtina
Smekhova
 *a,
Vladimíra
Novotná
 b,
Ladislav
Fekete
b,
Radu
Abrudan
a,
Mattis
Fondell
b,
Ladislav
Fekete
b,
Radu
Abrudan
a,
Mattis
Fondell
 a,
Věra
Hamplová
b and
Boris I.
Ostrovskii
*cd
aHelmholtz-Zentrum Berlin für Materialien und Energie, Berlin 12489, Germany. E-mail: alevtina.smekhova@helmholtz-berlin.de
bInstitute of Physics of the Czech Academy of Sciences, Prague 8, Czech Republic
cFederal Scientific Research Center “Crystallography and photonics”, Russian Academy of Sciences, 119333 Moscow, Russia. E-mail: ostrenator@gmail.com
dInstitute of Solid State Physics, Russian Academy of Sciences, 142432 Chernogolovka, Russia
First published on 29th November 2021
Abstract
The spontaneous formation of chiral structures offers a variety of liquid crystals (LC) phases that could be further tailored for practical applications. In our work, the characteristic features of spiral ordering in the cholesteric phase of EZL10/10 LC were evaluated. To disclose resonant reflections related to a nanoscale helix pitch, resonant soft X-ray scattering at the carbon K edge was employed. The angular positions of the observed element-specific scattering peaks reveal a half-pitch of the spiral ordering p/2 ≈ 52 nm indicating the full pitch of about 104 nm at room temperature. The broadening of the peaks points to a presence of coherently scattering finite-size domains formed by cholesteric spirals with lengths of about five pitches. No scattering peaks were detectable in the EZL10/10 isotropic phase at higher temperatures. The characteristic lengths extracted from the resonant soft X-ray scattering experiment agree well with the periodicity of the surface “fingerprint” pattern observed in the EZL10/10 cholesteric phase by means of atomic force microscopy. The stability of LC molecules under the incident beam was proven by X-ray absorption spectroscopy in transmission geometry.
Introduction
Nanostructured forms of different soft materials are of continuous growing interest for both practical applications and fundamental physics. Examples of such systems can be found among a broad family of liquid crystals (LCs), polymers and ordered organic films; the behavior of these smart materials can be modified by tuning their particular functional properties like a period of helical modulation, optical or electronic band gap, magnetic or polar order, etc. Many of these materials form helical superstructures; the most notable examples are the spiral ordering of the DNA and the peptides made of chiral molecular blocks. A variety of helical structures can be found among LCs as well: chiral molecules can self-assemble into cholesteric or various tilted smectic C* phases with a uniform twist.1,2 A self-assemble of achiral LC molecules into helical aggregates is present to a much rare extent. Nevertheless, in recent years several remarkable examples of a spontaneous breaking of mirror symmetry with formation of nanoscale helices of opposite handedness were discovered among a new class of bent-core and dimer-like LCs (see ref. 3 for a review).Liquid crystals are anisotropic fluids that combine the fluidity of isotropic liquids with the long range orientational and partial translational order of the rod-like molecules. They are characterized by certain symmetries in the preferred orientations of the long axes of LC molecules, i.e. the director n. Chiral LCs can exhibit the cholesteric phase wherein a helically twisted structure is driven by the molecular chirality. The spirals fill a space in such a way that a helical axis is perpendicular to the local director n(r) which undergoes precession along the helix axis with a constant spatial period – pitch.1,2 The pitch can lie in the optical wavelength range giving rise to a selective reflection of light: this provides the basis for applications of cholesteric LCs as color reflectors and filters, tunable lasers, nonlinear optical elements and thermal imaging devices.4 The helical pitch of cholesteric LCs can be controlled by external stimuli (temperature, electric or optical fields).1,5 These unique properties enable to develop a great variety of optical elements and devices based on cholesteric LC cells. The cholesteric LCs with a short pitch lying in the UV range (below 200 nm) are rare, especially when synthesized as individual chemical compounds.6 However, such short-pitch cholesterics have a great advantage over their typical counterparts when they are applied for fast switching electro optical devices. This is due to the fact that the relaxation time of the deformed cholesteric spiral after the switching off of the electric field is proportional to the square of the pitch.5 Thus, the cholesterics with a short pitch appear to be very promising materials for the high frequency switchable display applications including 3D television devices.7,8
The properties of cholesteric helixes are usually probed by optical spectrometry and reflectometry techniques. However, these methods are hardly accessible when the pitch is going to the UV spectral domain. The optical spectroscopy does not provide information on the shape of cholesteric spirals and their correlations in space, as it cannot resolve structures smaller than the visible-light wavelength. In recent years the atomic force microscopy (AFM) technique has been suggested for the measurements of the relatively short helix pitches in cholesteric LCs.9 The method can be applied to the surface patterns of chiral materials and is based on periodic force profile measurements along the free surface of the cholesteric drops placed on the substrate.
X-Ray diffraction is one of the most useful tools to determine the structure of various phases in LCs due to its sensitivity to electron density modulation characterizing positional order. However, this technique is not applicable to studies of cholesteric helixes since they do not exhibit such a density modulation. The projection of the electron density on the helix axis does not change upon the precession of the molecules around it. This is valid not only for the spiral ordering in cholesteric LCs but also for the helical precession of the molecular tilt direction around the cone in the chiral smectic C* phase1,2,10 and in the heliconical nematic phases.3 Thus, these particular types of molecular ordering in LCs could not be probed by conventional X-ray diffraction.
To overcome these limitations, Resonant Soft X-ray Scattering (RSoXS) at the absorption edges of LC constituent atoms could be used. It probes effectively the helical ordering11,12 since the interaction of linearly polarized X-rays and the asymmetric electron cloud around the resonant atom in a molecule is determined by tensorial atomic scattering cross section.13 Such experiments generally require the specially synthesized molecules with the covalently bonded resonant atoms (S, Se or P); however, the carbon K-edge resonant scattering has also been started to be applied to studies of various carbon-rich organic materials. These include studies of the carbon electronic structure and phase separation in polymer blends,14 block copolymers,15,16 organic photovoltaic solar cells,17 and some others. The pioneering experiments with LCs represented by variant chiral smectic C* phases started in late 90s, and were performed at the S and Se absorption edges. The ferroelectric, antiferroelectric or ferrielectric fluidic phases arranged in a “clock-like” spiral fashion were subsequently elucidated.18–20 Very recently, the resonant X-ray scattering near the C K absorption edge was exploited highlighting the nanoscale structures formed by much broader LC phases including the newly discovered ‘twist bend’ mesogens, spiral nanofilaments in the B4 phase of bent-core LCs, ‘blue phases’ in chiral LCs and a double gyroid cubic phase.21–26 Resonant scattering peaks forbidden by the crystallography extinction rules have been detected close to the absorption edges in addition to those observed via conventional X-ray diffraction.
Herein, resonant soft X-ray scattering at the C K edge with linearly polarized X-rays was exploited to probe the spiral structure of newly synthesized liquid crystal EZL10/10 with an ultra-short helical pitch.6 A strong scattering peak associated with the half-pitch of the cholesteric spiral structure was observed and has revealed its resonant origin. The periodicity extracted from RSoXS peaks is compared with the surface stripe texture observed in the cholesteric phase of EZL10/10 at room temperature by atomic force microscopy (AFM). Besides, the space correlations of helices and the characteristic size of coherently scattering domains were analyzed. X-Ray absorption spectra recorded at the carbon K-edge resonance have shown the stability of EZL10/10 molecules under the X-ray beam.
Experimental
Material and its preparation for the experiment
The cholesteric LC material used in this study, (S)-4-(((1-(decyloxy)-1-oxopropan-2-yl)oxy)carbonyl)phenyl 4′-(decyloxy)′-ethyl-[1,1′-biphenyl]-4-carboxylate denoted as EZL10/10, belongs to the new lactic acid derivatives with a molecular core being laterally substituted by an ethyl group. Its synthesis was described earlier in ref. 6. The EZL10/10 undergoes a transition from the cholesteric (Ch) to the isotropic (Iso) phase at 47 °C (≈320 K) while preserving the stable Ch phase at room temperature (RT). The molecular representation of EZL10/10 is shown in Scheme 1.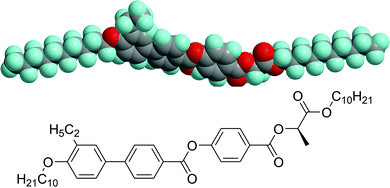 | ||
| Scheme 1 The schematic representation of EZL10/10 molecule: the 3D model and the structural formula. | ||
To be able to perform the X-ray experiments in transmission geometry in vacuum, the LC material was placed between two 100 nm-thick silicon nitride (Si3N4) membranes with 5 × 5 mm2 window size in the silicone frame (Silson, Inc.). The thickness of the cell was set by the standard spacer balls of 1.5 μm in diameter. The attenuation length of the soft X-rays at the C K-edge is extremely small due to strong absorption: for common carbon-based materials it constitutes only a few microns in the pre-edge region and dramatically falls down to about 0.2 μm closer to E = 283.5 eV;21,27 thus, the special precautions had to be made for such a cell preparation. The cells were filled with the EZL10/10 LC being in the isotropic phase, cooled down, and were closed hermetically with the epoxy glue. The optical interferometry indicated an only partially uniform thickness distribution of LC along the window with approximately 1 μm LC thickness in the center of the cell.
Prior to the measurements, the LC cell was heated up to the 340 K with the heating rate of 2 K min−1, kept at this temperature for approx. 6 hours, and then cooled down to RT with a natural cooling speed to be consistent with the results from ref. 6. Such an additional heating/cooling cycle across the phase transition ensures a more homogeneous distribution of the LC material between the two Si3N4 membranes. In Fig. 1, RT_1 and RT_2 temperatures denote the RT point before and after the second heating/cooling cycle within which the main results were obtained.
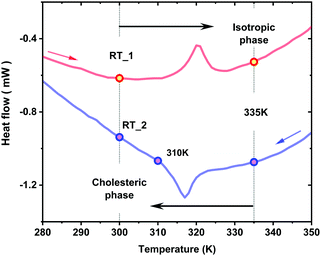 | ||
| Fig. 1 Temperature points used in the synchrotron-based X-ray experiments with EZL10/10 compound in the cholesteric and isotropic phases; lines represent the digitized data from ref. 6. RT_1 and RT_2 denote the RT point before and after the second heating/cooling cycle, respectively, during which the main results were obtained. | ||
Synchrotron-based experiments
RSoXS experiments have been performed with linearly polarized X-rays in transmission geometry at temperatures corresponding to the stable cholesteric and isotropic phases of EZL10/10 liquid crystal. The sample was mounted into the ALICE reflectometer chamber28,29 attached to the UE52_SGM undulator beamline30 of BESSY II synchrotron storage ring operated by Helmholtz-Zentrum Berlin (HZB). X-Ray photons of horizontal polarizations were used in the energy range of 270–290 eV covering the carbon K-edge resonances of different carbon-based compounds. Due to a long wavelength of soft X-ray radiation, E = 283.5 eV, λ ≈ 4.4 nm, large helical periodicities (up to few hundred nanometers) can be easily measured in various LCs. The intensity of the incoming X-ray photons was monitored by the drain current of a gold-coated plane elliptical mirror upstream the experimental chamber. The photon flux was on the level of 108 photons per s. The typical basic pressure inside the chamber during the experiment was in the range of 10−7–10−8 mbar.To detect the scattering peaks expected at certain wavenumbers q the radial scans in the horizontal plane at both sides of the direct beam position were performed using a Si point photodetector (q = (4π/λ)·sin![[thin space (1/6-em)]](https://www.rsc.org/images/entities/char_2009.gif) θ, where θ is a half of the scattering angle). The vertical slits with a gap of 500 μm placed in front of the detector offer a higher angular resolution and a lower background signal that are crucial for the current experiment. The sample to detector distance within the ALICE chamber was 0.2 m; the corresponding angular resolution in the scattering plane was about 0.2° in terms of the scattering angle 2θ (full width at half maximum, FWHM). The size of the beam on the sample was about 0.7 × 0.6 mm. Since the range of periodicities expected to be probed was about 100 nm, the scattering angles (2θ) up to 7–8° from the direct beam position were of the main interest. The most important parameters to detect were the angular position of the scattering peaks and the FWHM of their radial cross-sections depending on the temperature and the energy of the incoming X-rays. The data obtained were used to quantify both the pitch of the helical structure and the characteristic length within which the cholesteric spirals are correlated.
θ, where θ is a half of the scattering angle). The vertical slits with a gap of 500 μm placed in front of the detector offer a higher angular resolution and a lower background signal that are crucial for the current experiment. The sample to detector distance within the ALICE chamber was 0.2 m; the corresponding angular resolution in the scattering plane was about 0.2° in terms of the scattering angle 2θ (full width at half maximum, FWHM). The size of the beam on the sample was about 0.7 × 0.6 mm. Since the range of periodicities expected to be probed was about 100 nm, the scattering angles (2θ) up to 7–8° from the direct beam position were of the main interest. The most important parameters to detect were the angular position of the scattering peaks and the FWHM of their radial cross-sections depending on the temperature and the energy of the incoming X-rays. The data obtained were used to quantify both the pitch of the helical structure and the characteristic length within which the cholesteric spirals are correlated.
In addition to the scattering experiment, the absorption spectra at the carbon K-edge resonance were measured in transmission geometry using the same point photodetector placed at the position of the direct beam. The identical set of parameters for the undulator provided the same level of incoming flux for the horizontally polarized X-ray photons as in the case of the X-ray scattering experiment. The reproducibility of the absorption spectra measured before the heating up to the isotropic phase and after the cooling down to RT confirmed the stability of the LC sample under the X-ray beam. A single Si3N4 membrane of 150 nm thick and a sandwich of two 100 nm thick Si3N4 membranes (without LC in between) were used as references. The main outcomes of X-ray absorption experiments could be found in ESI.†
AFM technique
The AFM measurements were carried out using a Bruker Dimension Icon microscope (Bruker, Santa Barbara, CA, USA) operated at the LC/air interface in the PeakForce mode at room temperature. The cantilevers with a low spring constant of 0.4 N m−1 and the resonant frequency in the range of 70–80 kHz were employed. For AFM studies the cholesteric sample was prepared by spreading of the melted LC droplet on the untreated glass surface. In such a way a surface texture with a regular stripe pattern can be obtained for further analysis.Experimental results
X-ray resonance scattering
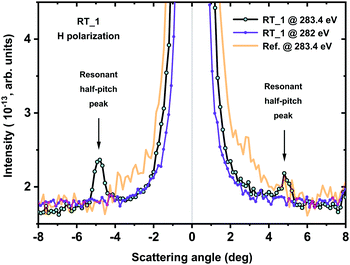
The angular dependence of the scattered X-rays recorded at two energies near the C K absorption edge at RT are shown in Fig. 2. A pronounced resonant peak associated with the half-pitch (p/2) of the cholesteric spiral is observed for the incoming photon energy E = 283.4 eV at both sides of the direct beam in the horizontal scattering plane. At the same time, only a smooth background signal was detected at lower energy E = 282 eV. The reference Si3N4 plate does not show any peaks either for E = 283.4 eV (see Fig. 2) or E = 282 eV (not shown); however, a more intense direct beam and a higher background were found due to a larger transmission of Si3N4 membrane.For the non-oriented cholesteric sample expected in the LC cell under study, the uniform scattering rings in the detection plane are anticipated since an arbitrary orientation of helix axes within an X-rays illuminated area produces the powder-like diffraction patterns. The scans performed with the point detector display the radial cross-sections of these rings revealing various types of periodicities in the system. The scattering angle 2θ of the observed resonant peak in the cholesteric phase of EZL10/10 was found to be 4.80 ± 0.05°. That corresponds to the half-pitch of the cholesteric spiral p/2 ∼ 52 ± 0.5 nm, and, accordingly, to the full pitch of about 104 ± 1 nm.
The difference in intensities found for the resonant peaks at both sides of the primary beam is mainly related to a slight deviation of the sample alignment from the normal incidence geometry with respect to the incoming beam that creates a difference in X-ray paths within the membranes and the LC between them. Due to a strong absorption of X-rays within the LC and an additional attenuation by both membranes, even a tiny difference between X-ray paths creates a visible difference in the resonant peak intensities. For further evaluations the peak of higher intensity was chosen.
The observed resonant peak in the cholesteric phase is not resolution-limited. It can be well fitted by the Gaussian lineshape to reproduce the experimental FWHM, Δ(2θ) ≈ 0.55°, which can be related to the presence of small domains with a uniform orientation of helix axes in the EZL10/10 sample. An average linear size L of these domains can be estimated as L = 2π/FWHM ≈ λ/Δ(2θ).31,32 Taking into account the used wavelength λ ≈ 4.4 nm (E = 283.4 eV) and the revealed value of Δ(2θ) corrected to the finite instrumental resolution (Δinst(2θ) ≈ 0.2°),33 the linear size of domains was estimated to be about L ≈ 500 nm. This means that the parts of helixes with lengths of approximately five full pitches contribute coherently to the observed resonant scattering signal. Thus, the detected X-ray resonant scattering peaks originate from the randomly oriented finite-size cholesteric domains, within which the helix axes of the spiral ordering are well aligned.
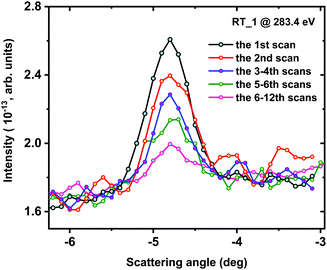
By doing successive angular scans around the resonant peak position the substantial diminishing of the scattering peak intensity was found from one scan to another (Fig. 3). The observed decrease in the signal intensity might be related to a partial reorientation of the LC molecules under the X-ray beam resulting in a lower number of molecules satisfying the resonant scattering conditions in the horizontal plane. At the same time, the angular position and the FWHM of the resonant peaks do not change. This points out that there are no detectable changes in the half-pitch and the size of the cholesteric domains coherently scattering under the X-ray irradiation of the EZL10/10 sample. A partial decomposition of the LC molecules can be excluded, due to the fact that the absorption spectra of the EZL10/10 sample do not demonstrate any changes during the multiple X-ray exposure scans (see ESI†).
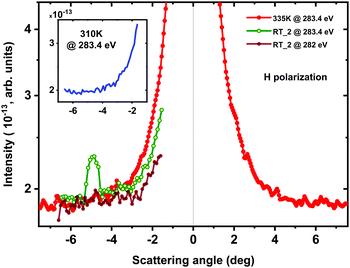
Upon heating to the isotropic phase over the second heating/cooling cycle (up to 335 K) the resonant scattering peak at the half-pitch angular position disappears while on coming back to RT_2 it reappears again as shown in Fig. 4. The intensity of the resonant peak was found to be comparable with ones found earlier. Quite unexpectedly, the measurements performed at the intermediate temperature of 310 K did not show any sign of the resonant scattering peak (see inset in Fig. 4). This might mean that the formation of the regular cholesteric structure in the studied sample requires a certain time. The abovementioned measurements at 335 K, 310 K and RT_2 were taken from exactly the same spot on the LC sample cell that was monitored not only by the standard position scans but also by energy scans as it will be mentioned below. These results confirm the reversibility of the cholesteric/isotropic phase transition in EZL10/106 and directly assign the nature of this transition to the appearance of the helixes formed by EZL10/10 molecules.
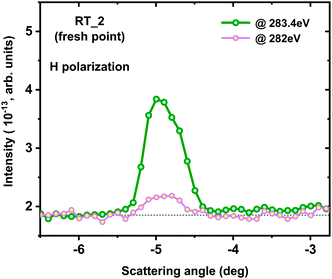
The first angular scan recorded from the fresh area with a larger thickness of the EZL10/10 material demonstrates a significantly larger intensity of the scattering peak at E = 283.4 eV (Fig. 5). At the first glance this observation looks counterintuitive, because the X-ray absorption near the absorption edge for the thicker sample is obviously getting higher. However, the higher absorption leads to smaller background level, which in turn provides an advantage for better visibility of the resonant scattering signal. Thus, there is a strong interdependence between the incoming flux, absorption in the sample of a given thickness and the intensities of the scattered X-rays in the resonant experiments performed in the transmission geometry. Moreover, due to a smaller background level it became possible to detect the subtle non-resonant scattering peak also at E = 282 eV as can be seen in Fig. 5. This contribution is related to the steric repulsions of the helices parts and is described on the basis of the “excluded volume” effect,34,35 as it will be further discussed. Thus, the resonant origin of the signal becomes undeniable: tuning the energy of the incoming X-ray photons over the resonance results in drastic changes of the scattering peak intensity. The subtle non-resonant scattering was also seen earlier in ref. 21 from bent-core LCs spiral structures in the B4 phase.
Formally, both energies used in the described X-ray resonant scattering experiment (282 eV and 283.4 eV) could be considered as prior to the carbon K-edge resonance in the studied EZL10/10 as shown in Fig. S1 of ESI.† However, as it was previously described in ref. 21 at exactly these energies an acceptable compromise between the absorption coefficient and the scattering amplitudes in the LC could be reached.
X-Ray absorption spectroscopy
The absorption spectra at energies around the carbon K-edge resonance commonly demonstrate a very complex behaviour not only due to different contributions from the sample itself but also due to contributions from elemental carbon and different carbon-based complexes that are always present as residuals in the experimental chamber and beamline vacuum. The contributions from all interfaces within the X-ray paths before and after the samples studied (e.g. at optical elements of the beamline and at the surface of the photodetector) play a role as well. X-ray absorption spectra collected from the EZL10/10 LC at the C K absorption edge in transmission geometry are shown in Fig. S1 of ESI.†The molecules of EZL10/10 LC have a complex 3D structure which results in several clearly seen polarization-dependent resonances. However, the detailed analysis of all features found in the X-ray absorption spectra are beyond the goal of the current paper, and these energy dependencies were mostly used to control the stability of the LC material and to monitor the position of the X-ray beam on the sample prior to measurements of the resonant scattering signal. The spectra confirm an absence of the radiation or heat damage of the sample as well as an absence of visible sample diffusion over the second heating/cooling cycle. Thus, a huge drop of the resonant scattering signal described above could not be associated with the sample damage due to its decomposition.
AFM studies
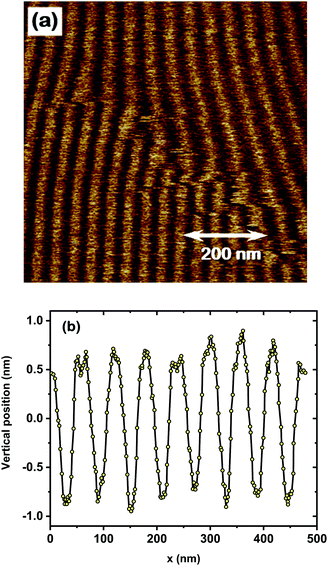
The cholesteric LCs usually display the characteristic “fingerprint” surface patterns that reflect their intrinsic helicity.1,2 Such textures with the periodicity depending on temperature and surface anchoring are easily visualized with the help of polarizing optical microscopy. However, upon the shift of the helix pitch towards the UV spectral range the above method ceased to work properly. Fortunately, the AFM technique has shown its feasibility for the measurements of the rather short helix pitches in cholesteric LCs.9 The AFM method is based on periodic force profile measurements along the free surface of the cholesteric material placed on the untreated substrate. Typically, at the LC/air interface the molecules follow a homeotropic alignment with the LC director oriented perpendicular to the surface. For such a case the spiral axes are lying parallel to the interface making the intrinsic periodicity visible. The AFM image of the surface of the drop of EZL10/10 compound in the cholesteric phase displays the typical stripe pattern, Fig. 6(a). In Fig. 6(b), the corresponding periodic force profile is shown with respect to a horizontal scale, directed perpendicular to the local stripes orientation and denoted as x-axis. The half-pitch of a stripe pattern is about 55 nm; thus, the full pitch is about 110 nm at room temperature. It is important to point out that the precise determination of the x-axis orientation from the 2D image is rather complicated, as it should be perpendicular to stripe orientation. Additionally, the surface is not ideally horizontal, that introduces an additional error in determining the pitch value. Considering together all these factors, the pitch of EZL10/10 was evaluated with the accuracy of 10 nm (p = 110 ± 10 nm) at room temperature. This result agrees well with the data obtained via the soft resonant X-ray scattering, which gives the full pitch of the cholesteric spiral in EZL10/10 of about 104 ± 1 nm at the same temperature. A tendency of having a bit larger pitch determined from AFM studies, can be attributed to the action of surface forces at the LC/air interface. Generally, the surface forces disturb a uniform twisted structure of the cholesteric spiral more easily in the direction of the increasing of the helix pitch.5Discussion
In our work, the spiral ordering in the cholesteric phase of EZL10/10 liquid crystal was probed by soft X-ray resonant scattering at the C K edge and AFM studies. The helical structure with an exceptionally low pitch of about 100 nm at RT was established by both techniques. Such an ultra-short helix pitch makes the EZL10/10 compound rather unique and assigns it as a promising material for various electro-optical devices which require a high rate of optical switching. In the earlier studies by Salamończyk et al.23 the soft X-ray resonant technique was already applied to studies of helix ordering in the cholesteric phase of several chiral LCs (SB3 and AZO7). A single resonant X-ray scattering peak related to the half-pitch of spiral ordering p/2 ≈ 110 nm was observed for both LC materials at higher temperatures. Thus, the full pitch found in the EZL10/10 compound here is twice as short than the full pitch p ≈ 220 nm recorded so far in other cholesteric LCs.The cholesteric phase is characterized by a helically twisted structure in which rod-like molecules rotate around the axis perpendicular to the local director n(r). In accordance with the symmetry of the cholesteric phase, its tensorial atomic scattering factor differs from zero only for the wave vector q corresponding to a half-pitch of the helical structure q0 = 2π/(p/2) = 4π/p, where p is a pitch of a helical modulation.13 The intensity of resonant q0 peak is sensitive to polarization of the incident X-ray photons: if the electric field within a beam oscillates perpendicular to the helix axis, then the highly polarizable direction (in the plane of the benzene rings) along of the aromatic hard core of the rod-like LC molecules is probed, whereas the electric field oscillating along the helix axis interacts mainly with the more or less uniformly distributed carbon atoms attached to the core of the LC molecule. As a result, for a powder-like sample in which the helix axes are randomly distributed in space, the scattering pattern is anisotropic, with stronger intensity of scattering perpendicular to the X-ray polarization direction. The anisotropy of the X-ray resonant scattering pattern is readily seen when the measurements are performed with a use of an area (2D) detector.21,23 For the case when the measurements are carried out with the point detector as it took place in our experiment, the optimal strategy of measurements would be to choose the geometry for which the scattering plane (within which the radial scans are made) is perpendicular to the polarization direction.
In the previous section it was shown that the observed resonant peak associated with the cholesteric phase of EZL10/10 compound is not resolution-limited. In general, two reasons leading to the resonant peak broadening above the FWHM determined by the instrumental resolution can be indicated. The first one is related to the possible distribution of helix pitches in the cell which might lead to the spread in the peak angular positions: the helix pitch distribution might be induced in a thin “sandwich-like” cell with the thickness of about 1 μm by an action of the surface forces. The second reason is related to a presence in a system of well-aligned finite-size domains within which the length of the cholesteric spirals is limited by a few (up to five) pitches.
Let us discuss the first scenario with distribution of pitches. The relative variation of the half-pitch in the cell Δ(p/2)/(p/2) is related to the FWHM of the resonant peak by the expression: Δ(p/2)/(p/2) = Δ(2θ)/2θ ≈ 0.5°/5° = 0.1. This means that the variation of the helical pitch Δp in the cell might be as large as 10 nm. However, for the case of the untreated silicon nitride plates the possible distortion of the cholesteric helix occurring at the cell interfaces does not penetrate inside the cell on the distances exceeding the helix pitch p ≈ 100 nm,5 which constitute about 20% of the total cell thickness. Moreover, the surface forces acting on the spirals in the cholesteric phase distort their uniform twisted structure more easily by dilating them. This should lead to asymmetry of the resonant peak with the larger intensity on the smaller scattering angles side, which is clearly not the case for the measured resonant peaks (see Fig. 2–5). Thus, the influence of the possible distribution of helix pitches on the broadening of the resonant peak can be disregarded. It can be concluded that the broadening of the resonant peak is predominantly due to partition of space into the finite size domains. So, the X-ray resonant scattering peak from the cholesteric sample under study originates from a powder-like mosaic of finite size domains that are internally well ordered but distributed randomly in the azimuthal plane.
As it was already mentioned in the Experimental section, the subtle non-resonant scattering peak was detected at the same angular position as the resonant peak, but at lower energy, E = 282 eV, which is out of the absorption range, Fig. 5. This scattering peak originates from the steric repulsions of the well oriented helices, i.e. the neighboring helices can not penetrate within each other over distances r restricted by p/2 and D, the half-pitch and the width of the helices, respectively. As a result, the so-called excluded volume is formed within which the pair density correlation function g(r) attains the zero value (g(r) defines the probability of finding a scattering object at the separation r from any other arbitrary chosen object).34,35 The structure factor S(q) measured in the X-ray scattering experiment is a Fourier transform of the pair density correlation function. Then the expression for S(q) is reduced to the integration carried out over the excluded volume of the system and finally shows the scattering maxima in the reciprocal space in the vicinity of q1 ≈ 2π/(p/2) = 4π/p and q2 ≈ 2π/D.34,35 The wave number q1 deduced within the aforementioned model coincides with the wave vector q0 that corresponds to the half-pitch of the helical structure observed under resonant conditions (E = 283.4 eV), as shown in Fig. 5. However, the intensities of these peaks differ by an order of magnitude. This indicates a giant amplification of X-ray scattering intensities for the periodicities measured under the resonant conditions.
Conclusions
To the best of our knowledge, in our work the shortest up-to-now reported value of the helix pitch in the cholesteric phase of liquid crystals was detected. To directly probe the formation of helices in the LC material and to estimate quantitatively the pitch and peculiarities of space filling by existing spiral ordering in the newly synthesized EZL10/10 compound, the anomalous soft X-ray scattering near the carbon K-edge resonance was exploited. The ultra-short helix pitch of approx. 104 nm and a presence in a system of well-aligned finite-size domains formed by cholesteric spirals with lengths of about five pitches were found within the LC cell at RT. These results are in accordance with the periodicity of the stripe pattern, p ≈ 110 nm, observed at the surface of the EZL10/10 cholesteric drop by means of AFM.All short-pitch cholesterics reported previously in literature were based on dimeric molecules and/or included more than one chiral center in the molecular structure. Contrary to this, the studied compound EZL10/10 represents a rather simple molecular structure (Scheme 1), with a lactate in the chiral chain. In our previous research it was proved that lactate unit as a source of chirality is very efficient as was demonstrated by frequent presence of blue and twist-grain boundary phases.36–38 In comparison with low pitch cholesterics studied by soft X-ray resonant scattering earlier,23,39 herein we present a simple molecular structure those pitch length can be easily varied by admixture of opposite enantiomer to get a series of structures with tailored pitches. The anomalous soft X-ray scattering technique taking an advantage of both linear polarizations of incoming X-ray photons will allow to reconstruct the space ordering of chiral LC molecules in this series with a precision not accessible by other methods.
Besides, the cholesteric compound EZL10/10 is thermally and chemically stable, and as it was currently revealed by X-ray absorption spectroscopy its molecules are also stable under the X-ray beam without any decomposition. The compound preserves its mesogenic properties at room temperature after the heating/cooling cycles, and the reversibility of the cholesteric/isotropic phase transition was confirmed by X-rays. In combination with the extremely short pitch this makes EZL10/10 a promising material for various electro-optical applications requiring a high rate of optical switching.
Conflicts of interest
There are no conflicts to declare.Acknowledgements
The authors thank the Helmholtz-Zentrum Berlin for the provision of access to synchrotron radiation facilities and allocation of synchrotron radiation at the UE52-SGM beamline of BESSY II at HZB and use of ALICE chamber (BMBF project no. 05K19W06). A. Smekhova acknowledges personal funding from CALIPSOplus project (the Grant Agreement no. 730872 from the EU Framework Programme for Research and Innovation HORIZON 2020). The work of B. I. O. was supported by the Russian Science Foundation (Grant No. 18-12-00108). The preparation of the LC samples and initial characterization of the cholesteric liquid crystals at FSRC “Crystallography and Photonics” RAS were supported by the Ministry of Science and Higher Education of Russian Federation within the corresponding State assignments. V. N. and V. H. acknowledge the financial support from MEYS of the Czech Republic (grant LTC19051). We are also thankful to Helen Gleeson and Mamatha Nagaraj for their participation at the initial stage of this project and valuable discussions. Special thanks are due to Alexey Bobrovsky for stimulating discussions on the chemistry and applications of short-pitch cholesterics. We are grateful to Artur Geivandov and Ivan Simdyankin for their contributions to design of the LC samples for the resonant soft X-ray scattering studies.References
- P. Oswald and P. Pieranski, Nematic and Cholesteric Liquid Crystals: Concepts and Physical Properties Illustrated by Experiments, Taylor & Francis, New York, 2006 Search PubMed.
- Chirality in Liquid Crystals, ed. H. Kitzerow and C. Bahr, Springer-Verlag, New York, 2001 Search PubMed.
- A. Jákli, O. D. Lavrentovich and J. V. Selinger, Rev. Mod. Phys., 2018, 90, 045004 CrossRef , and references therein.
- A. Ryabchun and A. Bobrovsky, Adv. Opt. Mater., 2018, 6, 1800335 CrossRef , and references therein.
- L. M. Blinov and V. G. Chigrinov, Electrooptic effects in liquid crystal materials, Springer, New York, 1994 Search PubMed.
- V. Novotná, V. Hamplová, M. Glogarová, L. Lejček and E. Gorecka, Liq. Cryst., 2018, 45, 634–640 CrossRef.
- L. M. Blinov and S. P. Palto, Liq. Cryst., 2009, 36, 1037 CrossRef CAS.
- S. P. Palto, M. I. Barnik, A. R. Geivandov, I. V. Kasyanova and V. S. Palto, Phys. Rev. E: Stat., Nonlinear, Soft Matter Phys., 2015, 92, 032502 CrossRef CAS PubMed.
- M. Škarabot, Ž. Lokar, K. Gabrijelčič, D. Wilkes and I. Muševič, Liq. Cryst., 2011, 38, 1017–1020 CrossRef.
- W. H. de Jeu, B. I. Ostrovskii and A. N. Shalaginov, Rev. Mod. Phys., 2003, 75, 181 CrossRef CAS.
- V. E. Dmitrienko, Acta Crystallogr., Sect. A: Cryst. Phys., Diffr., Theor. Gen. Crystallogr., 1983, 39, 29–35 CrossRef.
- V. E. Dmitrienko, K. Ishida, A. Kirfelc and E. N. Ovchinnikova, Acta Crystallogr., Sect. A: Found. Crystallogr., 2005, 61, 481–493 CrossRef PubMed.
- A.-M. Levelut and B. Pansu, Phys. Rev. E: Stat. Phys., Plasmas, Fluids, Relat. Interdiscip. Top., 1999, 60, 6803 CrossRef CAS PubMed.
- F. Liu, C. Wang, J. K. Baral, L. Zhang, J. J. Watkins, A. L. Briseno and T. P. Russell, J. Am. Chem. Soc., 2013, 135, 19248 CrossRef CAS PubMed.
- J. M. Virgili, Y. Tao, J. B. Kortright, N. P. Balsara and R. A. Segalman, Macromolecules, 2007, 40, 2092 CrossRef CAS.
- C. Wang, D. H. Lee, A. Hexemer, M. I. Kim, W. Zhao, H. Hasegawa, H. Ade and T. P. Russell, Nano Lett., 2011, 11, 3906 CrossRef CAS PubMed.
- J. R. Tumbleston, B. A. Collins, L. Yang, A. C. Stuart, E. Gann, W. Ma, W. You and H. Ade, Nat. Photonics, 2014, 8, 385 CrossRef CAS.
- P. Mach, R. Pindak, A.-M. Levelut, P. Barois, H. T. Nguyen, C. C. Huang and L. Furenlid, Phys. Rev. Lett., 1998, 81, 1015 CrossRef CAS.
- L. S. Matkin, S. J. Watson, H. F. Gleeson, R. Pindak, J. Pitney, P. M. Johnson, C. C. Huang, P. Barois, A.-M. Levelut, G. Srajer, J. Pollmann, J. W. Goodby and M. Hird, Phys. Rev. E: Stat., Nonlinear, Soft Matter Phys., 2001, 64, 021705 CrossRef CAS PubMed.
- H. F. Gleeson and L. S. Hirst, ChemPhysChem, 2006, 7, 321 CrossRef CAS PubMed.
- C. Zhu, C. Wang, A. Young, F. Liu, I. Gunkel, D. Chen, D. Walba, J. Maclennan, N. Clark and A. Hexemer, Nano Lett., 2015, 15, 3420 CrossRef CAS PubMed.
- C. Zhu, M. R. Tuchband, A. Young, M. Shuai, A. Scarbrough, D. M. Walba, J. E. Maclennan, C. Wang, A. Hexemer and N. A. Clark, Phys. Rev. Lett., 2016, 116, 147803 CrossRef PubMed.
- M. Salamończyk, N. Vaupotič, D. Pociecha, C. Wang, C. Zhu and E. Gorecka, Soft Matter, 2017, 13, 6694–6699 RSC.
- J. P. Abberley, R. Killah, R. Walker, J. M. D. Storey, C. T. Imrie, M. Salamończyk, C. Zhu, E. Gorecka and D. Pociecha, Nat. Commun., 2018, 228 CrossRef PubMed.
- W. Lewandowski, N. Vaupotič, D. Pociecha, E. Górecka and L. M. Liz-Marzán, Adv. Mater., 2020, 190, 5591 Search PubMed.
- Y. Cao, M. Alaasar, A. Nallapaneni, M. Salamończyk, P. Marinko, E. Gorecka, C. Tschierske, F. Liu, N. Vaupotič and C. Zhu, Phys. Rev. Lett., 2020, 125, 027801 CrossRef CAS PubMed.
- https://henke.lbl.gov/optical_constants/filter2.html .
- R. Abrudan, F. Brüssing, R. Salikhov, J. Meermann, I. Radu, H. Ryll, F. Radu and H. Zabel, Rev. Sci. Instrum., 2015, 86, 063902 CrossRef CAS PubMed.
- R. Abrudan and F. Radu, JLSRF, 2016, 2, A69 CrossRef.
- P. S. Miedema, W. Quevedo and M. Fondell, JLSRF, 2016, 2, A70 CrossRef.
- B. I. Ostrovskii, S. N. Sulyanov, N. I. Boiko, V. P. Shibaev and W. H. de Jeu, Eur. Phys. J. E: Soft Matter Biol. Phys., 2001, 6, 277–285 CrossRef CAS.
- W. H. de Jeu, E. P. Obraztsov, B. I. Ostrovskii, W. Ren, P. J. McMullan, A. C. Griffin, A. Sánchez-Ferrer and H. Finkelmann, Eur. Phys. J. E: Soft Matter Biol. Phys., 2007, 24, 399–409 CrossRef CAS PubMed.
- B. E. Warren, X-ray Diffraction, Dover, New York, 1990 Search PubMed.
- M. A. Osipov and B. I. Ostrovskii, Crystallogr. Rev., 1992, 3, 113 CrossRef.
- B. I. Ostrovskii, Sov. Sci. Rev. Ser. A Phys., Harwood Academic, 1989, vol. 12, pp. 85–146 Search PubMed.
- M. Garic, A. Bubnov, M. Kašpar, V. Hamplová, V. Novotná, D. Z. Obadovic and M. Glogarová, Liq. Cryst., 2005, 32, 565–572 CrossRef CAS.
- V. Novotná, L. Fekete, V. Hamplová, M. Glogarová, L. Lejček, M. Cigl and D. Pociecha, Liq. Cryst., 2018, 45, 1155–1163 CrossRef.
- V. Novotná, M. Glogarová, M. Kašpar, V. Hamplová, L. Lejček and D. Pociecha, Soft Matter, 2015, 11, 4649–4657 RSC.
- J. Pišljar, G. Posnjak, S. Pajk, A. Godec, R. Podlipec, B. Kokot and I. Muševič, Liq. Cryst., 2020, 47, 1303–1311 CrossRef.
Footnote |
| † Electronic supplementary information (ESI) available. See DOI: 10.1039/d1sm01543e |
| This journal is © The Royal Society of Chemistry 2022 |

